HAL Id: hal-03120991
https://hal.archives-ouvertes.fr/hal-03120991
Submitted on 26 Jan 2021
HAL is a multi-disciplinary open access
archive for the deposit and dissemination of
sci-entific research documents, whether they are
pub-lished or not. The documents may come from
teaching and research institutions in France or
abroad, or from public or private research centers.
L’archive ouverte pluridisciplinaire HAL, est
destinée au dépôt et à la diffusion de documents
scientifiques de niveau recherche, publiés ou non,
émanant des établissements d’enseignement et de
recherche français ou étrangers, des laboratoires
publics ou privés.
Variability of tropical upper tropospheric humidity
1979-1998
John Bates, Darren Jackson, Francois-Marie Bréon, Zachary Bergen
To cite this version:
John Bates, Darren Jackson, Francois-Marie Bréon, Zachary Bergen. Variability of tropical upper
tro-pospheric humidity 1979-1998. Journal of Geophysical Research: Atmospheres, American Geophysical
Union, 2001, 106 (D23), pp.32271-32281. �10.1029/2001JD000347�. �hal-03120991�
JOURNAL OF GEOPHYSICAL RESEARCH, VOL. 106, NO. D23, PAGES 32,271-32,281, DECEMBER 16, 2001
Variability of tropical upper tropospheric humidity 1979-1998
John J. BatesEnvironmental Technology Laboratory, NOAA, Boulder, Colorado, USA
Darren L. Jackson,
Francois-Marie Br•on, • and Zachary D. Bergen
Cooperative Institute for Research in Environmental Sciences, University of Colorado, Boulder, Colorado, USA
Abstract. We update the time series of upper tropospheric humidity observations, begun in 1979 through May 1998, which includes the major E1 Nifio event of 1997-1998. The intercalibration of different satellites is updated and compared to a physically based intercalibration. The results show excellent agreement and indicate that the main source of intersatellite bias is the known filter response function of the different instruments. Interannual variability of spatial fields is dominated by the major E1 Nifio events in the 1979-1998 time period. Tropical average anomaly time series of upper tropospheric humidity, however, are dominated by a pronounced seasonal preference in extremes. Large deviations from the anomaly time series are twice as likely to occur in boreal winter and spring as in boreal summer and fall. During boreal winter and spring, the tropical basic state circulation permits the opening of a westerly wave duct such that midlatitude Rossby waves can propagate into the subtropics and tropics. We hypothesize that variation in the Rossby wave activity modulates the vertical water vapor flux and is responsible for large variations in the tropical upper tropospheric humidity time series.
1. Introduction
Studies of upper tropospheric water vapor variability have
concentrated on understanding the water and energy balance
in the subtropical dry zones (-10øN-30øN and 10øS-30øS). In
the subtropics a relatively small change in upper tropospheric
water vapor can lead to a relatively large change in the clear-
sky outgoing longwave radiation (OLR) [Spencer and Braswell,
1997]. Discussions of the processes controlling the upper tro-
pospheric water vapor distribution in the subtropics has fo-
cused on the interaction of the tropics with the subtropics and
of the midlatitudes with the subtropics. This focus is because
most theories have attempted to explain the steady state bal-
ance in the subtropics, and in the zonally averaged time-mean,
the subtropics are regions of mean descending air. As a result,
it is generally thought that the water vapor balance in the
subtropics is not determined by local processes but is largely
controlled by interactions with the tropics, such as detrainment
from persistent regions of deep convection from the monsoons
and intertropical convergence zones [Salathe and Hartmann,
2000], and interactions with midlatitudes, such as large-scale
advection [Pierrehumbert and Roca, 1998].
There is increasing evidence, however, that these idealized theories for explaining the observed and modeled behavior of
upper tropospheric water vapor in the tropics may be an over-
simplification. An early study of the water and energy budget
of the tropics [Holland and Rasmusson, 1973] found that the
vertical eddy transport produced a large water vapor flux through the boundary layer and was positive up to the 500 hPa
layer. More recently, work by Sherwood [1996] and Pierrehum-
•On leave from the Laboratoire des Sciences du Climat et de
l'Environnement, CEA/DSM/LSCE, Saclay, France. Copyright 2001 by the American Geophysical Union. Paper number 2001JD000347.
0148-0227/01/2001JD000347509.00
bert [1998] have identified lateral mixing by transient eddies to
be an important process in the water budget of the subtropical
upper troposphere. Recent analysis of a general circulation
model (Rind, personal communication) also indicates that ver-
tical and horizontal mixing of water vapor by transient eddies
is an important mechanism in moistening the subtropical up-
per troposphere.
In this investigation we examine the observed interannual
variability for the past 20 years using satellite-derived upper
tropospheric humidity observations. Satellite remote sensing
observations do not provide direct information on the water
vapor content (i.e., the water vapor mixing ratio). Rather, the
satellite radiance observations, from filtered radiometers op-
erating near the center of the water vapor absorption band at 6.7/am, observe the water vapor and temperature over a rel- atively thick layer in the upper troposphere. As detailed by
Soden and Bretherton [1996] and by Stephens et al. [1996], the
satellite observations are most closely related to the relative
humidity of a layer and the radiance-to-humidity relationship
(for a more complete discussion, see Jackson and Bates [this
issue]) results in a quantity called the upper tropospheric hu-
midity (UTH).
In our analysis we consider whether some of the observed
variability in UTH may be explained by the modulation of
transient eddy activity in the tropics by changes in the seasonal
to interannual basic state circulation. Basic state is a generic term for the time-mean circulation, in this case the monthly mean zonal wind speed at 200 hPa. We are primarily interested in examining the relationship between UTH and dynamical
states in the subtropical regions. We do not examine the role of
clouds and precipitation in the water and energy balance. Since accurate long-term satellite data sets require the ac-
curate intercalibration of a number of satellites, we first reex-
amine our intersatellite calibration methodology (detailed in
the work of Bates et al. [1996], hereinafter referred to as BWJ) and compare it to an intersatellite calibration method based on 32,271
32,272 BATES ET AL.: VARIABILITY OF UPPER TROPOSPHERIC HUMIDITY
known differences in filter response functions between satel-
lites. Next, we analyze the observed interannual variability
using several different satellite-derived data sets and a reanal-
ysis data set. We then analyze the relationship between tropi-
cal-wide variability and regional variability. We find an impor-
tant connection between the tropical-wide variability and the
interaction between the tropical basic state circulation and the
midlatitude circulation. We then present our conclusions.
2. Intercalibration of Water Vapor Radiances
A critical step in the use of observations from multiple
satellites for climate analysis is the end-to-end calibration and
intercalibration of all instruments used. Care must be taken to
avoid spurious jumps in the time series due to changes in
instrumentation or algorithms. For this work, we use data from
the High Resolution Infrared Sounder (HIRS), which is a
20-channel filtered radiometer. The HIRS is one of a suite of
sounding instruments that flies on the NOAA polar-orbiting satellites collectively referred to as the TIROS Operational
Vertical Sounder (TOVS). It is difficult to quantify the effects
of all sources of systematic errors that arise in merging data
from similar instruments on differing satellites [National Re-
search Council (NRC), 2000]. The intercalibration process can
be thought of as a three-step process [Brest et al., 1997]: (1) the
nominal calibration of each individual instrument, (2) the nor-
malized calibration that adjusts all instruments to a baseline
instrument, and (3) the absolute calibration that adjusts the
normalized calibration to an independent reference standard.
The nominal calibration of the HIRS instruments and all
sources of random and systematic error associated with the use
of the HIRS upper tropospheric water vapor channel are dis-
cussed in detail by BWJ. Random errors dominate this error
budget.
For studies of interannual variability, such as this work, the
systematic errors from instrument to instrument are significant
(ranging from 0.05 to 0.95 K) and must be corrected. The
intercalibration procedure, using the method known as empir-
ical dynamic function (EDF), is described in BWJ and sum-
marized here. Normally, there are two NOAA polar-orbiting
satellites in orbit at any time and we use the overlap periods of
the different satellites in the normalizing procedure. Each sat- ellite passes over the same geographical area twice per day,
morning-evening and afternoon-night. To apply the EDF pro-
cedure, interannual anomalies are first constructed for each
satellite pass (morning, afternoon, evening, and night) and
cumulative histograms of the anomaly data for each satellite,
channel, and pass are constructed for time periods where data
exist from both morning and afternoon satellites. Then the
cumulative histograms for each period from the morning, af-
ternoon, and night passes are adjusted to the evening pass using the EDF method. Adjustments are made to the evening pass since this pass has the smallest variance between cumu-
lative histograms of the eight different satellite periods. Fol-
lowing the EDF anomaly adjustment, a mean bias adjustment
is made with the EDF-adjusted anomalies for each period to eliminate small jumps between satellite periods. Mean bias adjustments are less than 0.3 K for HIRS channel 12 for all periods. Satellite periods with only one satellite have the two
available passes adjusted to the evening pass using EDF infor-
mation from the nearest period containing data from that satellite.
The absolute calibration of the HIRS upper tropospheric
(a) HIRS Channel 12
N14/Nll
]'
N14/N12 1 N11/N12 t '• N11/N10 t '-" a. N9/N10 N7/N8 N7/N6 •TN/N6
'i
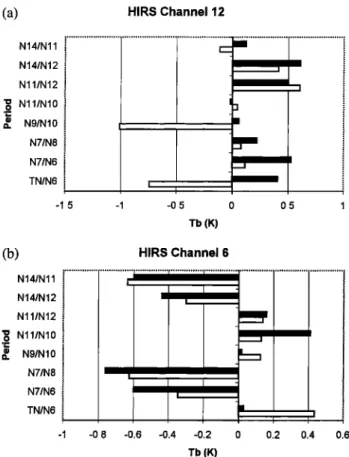
-1.5 -1 -0.5 0 0.5 1 Tb (K) (b) N14/N11 N14/N12 N11/N12 '• N11/N10 ._ •. N9/N10 N7/N8 N7/N6 TN/N6 HIRS Channel 6 -1 -0.8 -0.6 -0.4 -0.2 0 0.2 0.4 0.6 Tb (K)Figure 1. Satellite-to-satellite systematic biases for HIRS (a)
channels 12 and (b) 6 computed from forward physical princi-
ples (solid bar) and from empirical dynamic function analysis
(open bar).
water vapor channel is complicated by a lack of high-quality in
situ data. A complete and detailed description of all instru-
ments and methods to measure upper tropospheric water va-
por is available in a recent international assessment [Kley et al.,
2000]. Systematic biases between HIRS and other sources of
upper tropospheric water vapor were found to be generally
small (less than 1.5%), and the report concludes that there
were no major inconsistencies in the HIRS UTH data that
would preclude their use in climate and process studies.
We are continuing, however, to examine and quantify the
two major sources of systematic error in the HIRS data set.
These are the systematic differences from instrument to instru-
ment which are probably attributable to small changes in the
filter response functions and changes in the cloud detection
procedure over time. To assess the systematic error due to the
filter response functions, we have compared the BWJ empirical
calibration with a forward modeled calculation. To perform
the forward modeled calculation, we use the instrument spec-
tral response functions, a sample set of atmospheric tem- perature and moisture profiles (from the TIGR atmospheres [Chaboureau et al., 1998]) and a radiative transfer model
(MODTRAN 3.7 [Berk et al., 1989]). The convolution of the
response function with the transmittance for a variety of
atmospheres provides an a priori estimate of the systematic
biases from instrument to instrument.
The results of these calculations are presented in Figure 1.
In this figure we compare the systematic bias between each set
of overlapping satellites using our empirical method (the open
BATES ET AL.: VARIABILITY OF UPPER TROPOSPHERIC HUMIDITY 32,273
the filter functions for the different instruments (the solid bars). We do not expect an exact match between the empirical
and the forward modeled intersatellite biases because the sam-
ple atmospheres will not be an exact match with the observed
atmospheres. In most cases, however, the agreement between
the empirical and the forward-modeled intersatellite biases is
on the order of only a few tenths of a degree. This is an
excellent agreement and lends credibility to our assertion that
most of the intersatellite bias is attributable to known differ-
ences in the filter response functions from instrument to in-
strument. There are, however, a few notable exceptions. Dis-
agreements of -1 K are found in HIRS channel 12 between
the NOAA-9 and the NOAA-10 instruments and between the
TIROS-N and NOAA-6 instruments. The difference between
TIROS N and NOAA 6 is attributed to a relatively short
overlap between the two instruments. The difference between
NOAA 9 and NOAA 10 is not clear, but we believe it is
attributable to errors in the specification of the filter response
function for the NOAA-9 instrument. We are reexamining the
filter response specification of NOAA 9 to ensure that the
manufacturer correctly specified it.
These results are in conflict with those BWJ reported in an
earlier attempt to perform a physically based assessment of
intersatellite biases [Bates et al., 1996]. For that work BWJ had
used a different radiative transfer model, RTTOV-3 [Eyre, 1991]. A recent comparison of this model with others in the
water vapor absorption band [Soden et al., 2000] revealed that
the RTTOV-3 model had large systematic and random errors
relative to the other models. In this same intercomparison,
MODTRAN was found to have very low systematic and ran-
dom errors. Thus we believe that our poor results in our earlier attempt to physically model the intersatellite biases in HIRS
channel 12 were due to the use of an inaccurate radiative
transfer model and not to the uncertainties in the filter func-
tions.
As detailed by Jackson and Bates [this issue], the empirical
relationship between HIRS channel 12 and UTH can be im- proved by using temperature data from HIRS channel 6. For this reason we also performed similar calculations for this
channel. We find (Figure lb) even better agreement between
the empirical intersatellite calibrations for this channel. Thus
we conclude that our empirical intersatellite bias adjustment is
highly consistent with known physical differences in the differ-
ent instruments, lending credibility to the adjustment proce-
dure.
This and all prior UTH work using the NOAA satellites have
used the clear column radiance (CCR) data set produced op-
erationally by National Environmental Satellite Data and In- formation Service (NESDIS). Thus far it has not been possible
to assess systematic biases that may have arisen due to small
changes in the operational cloud detection procedure over time. After April 1998 the CCR data set produced by NESDIS
changed substantially, and so we do not use the CCR data after
that time. We are in the process of computing a clear column
radiance data set from the raw (level lb) TOVS data with a
consistent cloud detection scheme, updated quality control,
and longer data records. This project, called the TOVS Radi-
ance Pathfinder Project, involves a massive reprocessing of
over 1.5 terabytes of data but will be available soon and will
allow us to minimize this source of systematic error.
It should be noted that it is common practice in discussing
data from filtered radiometers such as the HIRS instrument to
use the terms radiance and brightness temperature inter-
changeably even though they have different units. This is be-
cause the central frequency for each channel on a filtered radiometer is defined exactly, so that through the use of the
Planck function, we can unambiguously equate radiance and
brightness temperature.
3. Observed Interannual Variability
One way to examine the processes that relate the surface
temperature, deep convection, upper tropospheric water va-
por, and clear-sky outgoing longwave radiation is to examine
the largest interannual signals. Within the tropics the largest
signals are related to E1 Nifio-Southern Oscillation (ENSO)
events. We have therefore plotted several tropical interannual
anomaly time series and their spatial patterns for the past 20
years. The time series will be discussed first. The time series of
sea surface temperature (SST) anomalies in the central equa-
torial Pacific, the Nifio-3 area (Figure 2c), and the Southern Oscillation index (SOl) (the Darwin-Tahiti pressure differ-
ence) are highly correlated with the leading principal compo-
nent time series of precipitation and HIRS UTH (Figure 2d).
Variability in the precipitation and the UTH are synchronous. A measure of the intensity of the tropical Hadley cell over-
turning (Figure 2e) has been computed from NCEP reanalysis
data [Kalnay, 1996]. This meridional mass stream function
[Peixoto and Oort, 1992] has been computed for the northern
winter season (December-January-February) when the effects
of ENSO warm events are most pronounced in the Northern Hemisphere midlatitudes and only the maximum value of the zonal-mean cross section for the Hadley cell has been plotted.
This index shows that the Hadley cell intensifies during ENSO
warm events and that it was very intense during the 1982-1983,
1994-1995, and 1997-1998 warm events. Thus in terms of all these indices, the ENSO warm events of 1982-1983 and 1997-
1998 stand out in terms of the largest signals.
Figure 2a shows the leading empirical orthogonal function
(EOF) of anomalous precipitation [Xie and Arkin, 1997] during
the past 20 years. During ENSO warm events, precipitation is
enhanced in the central and eastern equatorial Pacific and
precipitation is decreased in the western equatorial Pacific and
in the South Pacific convergence zone. Figure 2b shows the
leading EOF of interannual variability of HIRS UTH. The spatial pattern shows an increase in the upper tropospheric humidity over the central and eastern equatorial Pacific, over
western Australia and extending west into the southern Indian
Ocean, and over smaller regions in the North and South At-
lantic. Decreases in the upper tropospheric humidity are found
in the north and south subtropics of the Pacific, over the
western equatorial Pacific over northeast Brazil, and over the Gulf of Guinea. Of these, however, the largest decrease is
found over the subtropical North Pacific between Hawaii and
Baja California. This is an area where the upper tropospheric humidity is already low, so this is where we would expect
changes in UTH to have a large impact on clear-sky OLR.
ENSO events have often been described as simply a rear-
rangement of the existing hydrological and circulation features
within the tropical atmosphere. The variations of the mass stream function shown above indicate this is not the case and that ENSO warm events result in a fundamentally different basic state of the tropical circulation. It is therefore of interest
to examine the tropical averaged responses of UTH and clear-
sky OLR for interannual signals. Tropical average (30øN-30øS)
32,274 BATES ET AL.: VARIABILITY OF UPPER TROPOSPHERIC HUMIDITY
CMAP Precipitation
(Jan 1979- May 1998) EOF 1
Explained variance = 11.9023% a .:•..•....,..•...::.•:;•:;•..:.:•:•.... . •:•.•.•=•;?•?•.:•=•..:•.•.;•s•:.•.•.•-•-•.:-•:• .. ..•::•:::::....:.::,•.•::•..•.•:.::•:.:. ....• ...:
30N
...
•:-.':•'
...
;•.
....•.•.•;•-
:•...
• ...
•
-...;--•?::;....5•.. ß
10S '" ?•.. ß ... .... ½..• . ;• ... .. .•. 0 60E 120E 180 120W 60W 0 -9 30N 20N 10N EQ .•!, 10S ... -6 -3 0 3 6 9UTH (Jan 1979- May 1998•
Explained variance = 10.1992 •EOF 1
b•:.•.;. • •. •'..:,; .."-•:½y•/•.. ....: .... :.• 120E 180 120W 80W 0 60E -6 -4 -2 0 2 4 6 C 3.8 -5•'
•' 1.9
-3>.
0 0.0 0z t
•- -1.9 so• 3CO
... NINO
3
t•
co
-3.8
5 •
d 3.8 1.5'-•.•F
/•.
•
•:
/.."/'
-tø'• •
o' 4
z
-0.3•
• -1.9
-0.9
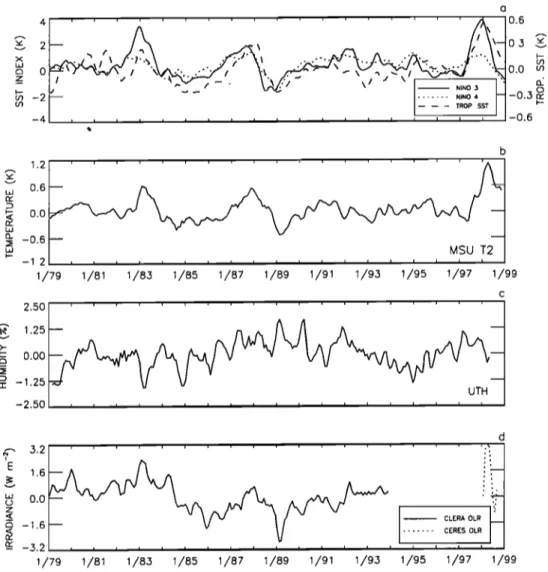
-3.8 -1.5 e •- 20 • 19 • 18 _o 17 o '- x 16 ,,' 15 o5 14 • 13 1179 1/81 1/83 1/85 1/87 1/8g 1/91 1/g3 1/95 1/97 1/g9Figure 2. Leading empirical orthogonal function for (a) CMAP precipitation interannual anomalies, (b)
UTH interannual anomalies, (c) ENSO indices for SST interannual anomalies in Nifio-3 region and Southern
Oscillation Index, (d) principal component of leading EOF for CMAP and UTH, and (e) meridional stream
function for DJF season.
tropospheric temperature from the TOVS Microwave Sound-
ing Unit (MSU channel 2) [Christy et al., 1998, 1995], UTH,
and clear-sky OLR from CLERA [Slingo et al., 1998] and
CERES [l, Vielicki et al., 1998] are shown in Figure 3. Since
these indices are now tropical averages, the values of the vari-
ability are rather small because they are the result of much
larger anomalies of opposite sign. (Because of the short record
of the CERES data, we have computed CERES anomalies
with respect to the long-term mean of the CLERA data. Since
we are interested in relative variations, we have also removed
a bias between the CLERA and the CERES data for the base
month of January 1998 when the tropical anomalies of both
data sets were near zero.) Also included in these plots are SST
indices for the tropical Pacific regions sensitive to ENSO, the
Nifio-4 region in the western equatorial Pacific, and the Nifio-3
BATES ET AL.: VARIABILITY OF UPPER TROPOSPHERIC HUMIDITY 32,275 o
4
...
• 0.6
• 2 \ \ 0.3 x . • r\ . • .-.-'.- . -.. .. ...-...,. . \ w o 0 0.0 i- t• -2 -0.3 -4 -0.6 1.2 o.o -0.6 -1.2 1/79 b 1/81 1/83 1/85 1/87 1/89 1/91 1/93 1/95 1/97 1/99 c 2.50 ... • 1.25 • o oo @ ß -r- -1.25 UTH -2.50 3.2 -1.6 3.2 1/79 d CLERA OLR • T 7 T 1/81 1/83 1/85 1/87 1/89 1/91 1/93 1/95 1/97 1/99Figure
3. Interannual
anomaly
time
series
of indices
for tropical
region
(30øN-30øS)
for (a) SST
(and
SST
for Nifio regions
3 and 4; note
change
of scale),
(b) MSU tropospheric
temperature,
(c) UTH, and (d)
clear-sky OLR from CLERA and CERES.
correlations for these variables and the significance of the cross
correlations accounting for the lag-one persistence in each time series. The tropospheric temperatures are correlated to SSTs in the Nifio-3 region at 0.60 (significance level between 80 and 85%). Yulayeva and Wallace [1994] find that lower tropo-
spheric
temperatures
are more highly
correlated
with Ni•o-3
SST at a 1-month lag. Correlations are lower between Nifio-3
SST and UTH (-0.30) and clear-sky
OLR (0.50), and signif-
icance levels are below 80%. There is a significant negative
Table 1. Cross-Correlation Table for Tropical, Zonally
Averaged Nifio-3 SST, MSU-2 Tropospheric Temperature,
UTH, and Clear-Sky OLR a
MSU 2 UTH CLERA Clear-Sky OLR Nifio-3 SST 0.60 (>80%) -0.30 (<80%) 0.50 (<80%) MSU-2 -0.40 (>90%) 0.56 (>90%) UTH 0.60 (>99%)
aSignificance levels, accounting for lag-one autocorrelation between
time series are given in parentheses.
correlation between the UTH and the clear-sky OLR time
series
(-0.60 significance
greater
than 99%). This is to be
expected
because
HIRS channel
12 is a main predictor
of
clear-sky OLR [Ellingson et al., 1994], and HIRS channel 12
was used in the ECMWF reanalysis [McNally and Vesperini,
1996]. Slight differences in these time series are found and are
attributed to the use of HIRS radiances only over the oceans in
the ECMWF reanalysis (G. Kelly, personal communication). Although the correlations between SST and UTH and be- tween SST and clear-sky OLR are not significant, there does
appear
to be some
association
between
the different
time se-
ries. The two most extreme negative values of UTH (most
extreme
positive
value of clear-sky
OLR) occur during the
mature
phase
of the extreme
ENSO events
of 1982-1983
and
1997-1998. The most extreme positive value of UTH (most
extreme
negative
value of clear-sky
OLR) occurs
during
the
extreme cold event of 1989. These UTH extremes are of much
shorter duration than the SST and tropospheric temperature
anomalies. This suggests that anomalies in tropical UTH and
clear-sky
OLR occur
on both seasonal
and interannual
time-
scales in contrast to SST and tropospheric temperature, which show only interannual variability.
32,276 BATES ET AL.: VARIABILITY OF UPPER TROPOSPHERIC HUMIDITY a -3 1/79 1181 1/83 1/85 1187 1189 1t91 1t93 1/95 1197 1/99 lOS 20S-. 30S ß .. .5•.. .'..::?:'.: ... ß ...,....:.:• ... ...:...• ... ß ... • ... ..:.. - ' •- 60E 120E 180 120W 6 W ß ... : ... •"•':' ... "•" ... '" "• !i•" 0.07 O. 18 0,29 -0.15 Figure 4. map. -0.04 0.40
Interannual anomaly time series of (a) tropical UTH (30øN-30øS) an (b) one-point correlation
In an attempt to quantify which regions of the tropics con-
tribute most significantly to the tropical wide time series of
Figure 3c, we computed a one-point correlation map between
the tropical-wide UTH time series and the UTH time series at
each grid point. This map (Figure 4) shows that the largest
contribution comes from the eastern Pacific. Several studies
have indicated that transient eddy activity is high in this area
[Kiladis and Weickmann, 1997] and that the transient eddies
are associated with large plumes of moisture [Iskenderian,
1995]. This transient eddy activity has a strong seasonal com-
ponent [Kiladis and Weickmann, 1997] and also shows a strong
interaction with ENSO events [Matthews and Kiladis, 1999].
Thus variations in eddy activity are a possible candidate to explain some extremes of the tropical interannual anomaly time series of UTH and clear-sky OLR.
To further examine the relationship between the UTH time
series and the seasonal to interannual variability, we identified
all months with UTH variability exceeding 0.7%. A histogram
of those months within the seasonal cycle revealed that ex- tremes of UTH are twice as likely to occur in the boreal winter
and spring (38 in December-January-February (DJF) and
March-April-May (MAM)) as in boreal summer and fall (19
in June-July-August (JJA) and September-October-Novem-
ber (SON)). This seasonal preference for tropic-wide extremes
in the UTH time series again suggests we should examine the
possible contribution of transient eddy activity in producing
the extremes.
4. Dynamical Analysis of Transient Eddy Activity
To examine the changes in transient eddy activity in this region during the large warm event of 1982-1983 and the large cold event of 1989-1990, we employed the dynamical analysis of 200 hPa winds as outlined by Kiladis [1998]. The horizontal
E vector is a pseudovector constructed by calculating time-
mean covariances between the perturbation zonal (u') and
meridional (v') wind components:
.• : (V'2--
U
'2
,
(1)The term V '2 -- U'2 is a measure of the mean anisotropy of Rossby waves. For example, if v'2 is consistently larger than u'2 the Rossby waves are preferentially elongated in the me-
ridional direction and the E-vector points eastward. The term
-u' v' is the negative of the time-mean northward flux of
westerly momentum associated with perturbations. Together,
the two components approximate the preferred direction of
the group velocity of the Rossby waves using suitable approx-
BATES ET AL.: VARIABILITY OF UPPER TROPOSPHERIC HUMIDITY 32,277 30N 20N 10N EQ 10S 20$ 30S
120E 140E 160E 180 160W 140W 120W 100W 80W
30N 20N 10N EQ 10S 20S 30S •...[
120E 140E 160E 180 160W 140W 120W 100W 80W
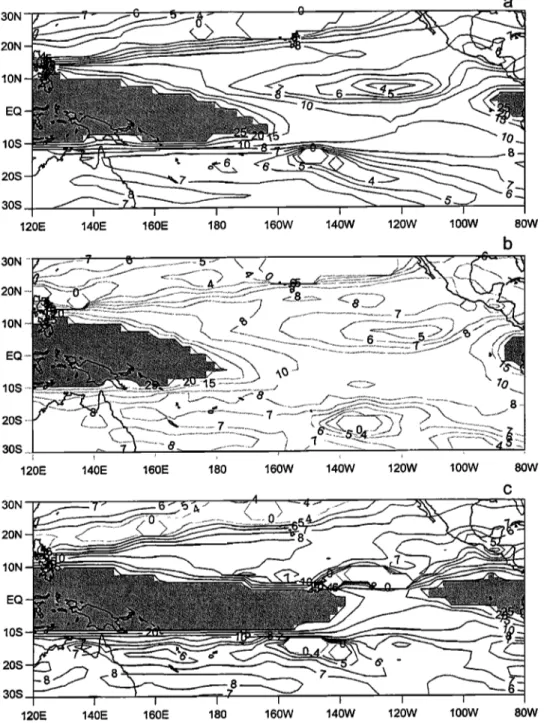
Figure 5. Mean fields for (a) February 1989 and (b) April
1983. The 200-hPa total stationary Rossby wave number is
contoured at zonal wave numbers 0, 5, 10, 15, 20, and 25, and contours greater than 25 are shaded. Also shown are the high-
frequency
shown is 125 m-(6-25
•7s•!
200-hPa
E-vectors.
The
largest
vector
this work we use the NCEP reanalysis data and bandpass filter
for 6- to 30-day transients.
Another useful diagnostic for representing the mean back- ground state in which the transients are embedded is the sta-
tionary Rossby wave number:
where
(2)
is the meridional gradient of absolute vorticity associated with the basic flow,/Y is the monthly mean 200 hPa zonal wind, and 13 - Of/Oy is the meridional gradient of planetary vorticity. Ks
is the total wave number at which a barotropic Rossby wave is
stationary at a particular location in a given background zonal
flow. Low values of the stationary Rossby wave number (below
about 10) indicate regions of strong eddy activity, and high values (above 15) indicate regions of weak eddy activity.
E-vectors and the stationary Rossby wave number were
computed for all months and plots of the minima UTH (April 1983), and maxima UTH (February 1989) months are shown in Figure 5. In the Northern Hemisphere, midlatitude interac- tions with the tropics are greatest in boreal winter and spring when transient Rossby wave activity with periods between 5 and 30 days is at a peak. During strong cold events, such as 1989 (Figure 56), tropical convection occurs only over the far
western Pacific Ocean since the western Pacific warm pool
b 20N
10N
-10
10S'
30S
i
I
120E 140E 160E 180 160W 140W 120W 100W 80W
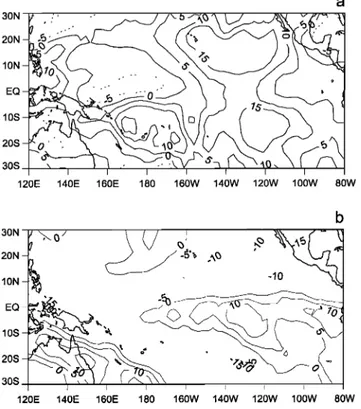
Figure 6. Monthly mean UTH anomaly fields for (a) Febru-
ary 1989 and (b) April 1983.
shrinks and moves to the west during cold events. In the trop-
ical upper troposphere near the equator, this creates strong westerly winds in the outflow from this convection over the
central and eastern Pacific. This allows the opening of a west-
erly duct in the eastern Pacific and supports propagation of Rossby waves deep into the subtropics [Webster and Holton, 1982]. This is evidenced in Figure 56 where values of stationary Rossby wave numbers less than 10 are found in the regions
between the dateline and the west coast of South America.
Large values of E-vectors pointing toward the equator near Hawaii are indicative of equatorially propagating Rossby
waves from the midlatitudes into the subtropics. As shown by
Kiladis [1998], the Rossby waves then propagate to the east and are associated with large plumes of moisture extending from
near Hawaii to the U.S. West Coast sometimes dubbed the "pineapple express."
Conversely, during the large warm event of 1982 (Figure 5b), deep convection extends far to the east in the equatorial Pacific Ocean. Upper tropospheric westerlies over the equator weaken dramatically or even reverse in the central and eastern
Pacific. This is confirmed by calculations of the stationary
Rossby wave number for these events. Large values of the stationary Rossby wave number are found over the eastern tropical Pacific, effectively shutting down the westerly duct. Virtually, no E-vectors pointing toward the equator are found in this month, indicating an almost complete absence of Rossby waves in the subtropical North Pacific. Figure 6 shows the UTH monthly mean anomaly fields for these two months. During February 1989 (Figure 66) we find large regions of
positive
UTH anomalies
exceeding
15% over the subtropical
eastern Pacific, and conversely, during April 1983 (Figure 6b) we find large negative anomalies. Thus there is strong evidence that the large variability of transient eddy activity in the sub-
32,278 BATES ET AL.: VARIABILITY OF UPPER TROPOSPHERIC HUMIDITY 30N 20N 10N EQ lOS 30S 120E 30N 20N t0N EQ lOS 20S 30S 120E T 140E 160E 180 160W 140W 120W 100W 80W b 180 160W 140W 120W 100W C 140E 160E 80W 30N ? .-' 20N • 10N EQ 10S 20S
L
30S <';•120E 140E 160E 180 160W 140W 120W 100W 80W
Figure 7. The 200-hPa total stationary Rossby wave number for boreal winter (a) mean, (b) UTH anomaly
months greater than 0.7%, and (c) UTH anomaly months less than -0.7%.
tropical North Pacific plays an important role in explaining the
tropic-wide extremes of UTH and clear-sky OLR interannual anomalies.
We examined the statistical characteristics of the relation-
ship between the UTH extremes and the Rossby wave activity
by computing the seasonal mean Rossby stationary wave num-
ber. We computed the mean of all months within the season
for only those months within the season with tropical average
UTH anomalies greater than 0.7% and UTH anomalies less
than -0.7%. For the boreal winter season (Figure 7) we find
that low values of the stationary Rossby wave number extend
farther west versus the mean along the equator when UTH
anomalies exceed 0.7% (Figure 7b) and are found farther east
when UTH anomalies are less than -0.7% (Figure 7c). The
situation is even more dramatic for the boreal spring season
(Figure 8). Thus the westerly duct is larger when UTH anom-
alies exceed 0.7% and is much smaller when UTH anomalies
are less than -0.7%.
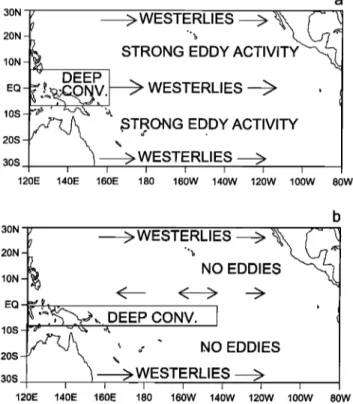
We have illustrated these two different basic state upper
tropospheric circulation regimes schematically in Figure 9.
When the westerly duct is open (Figure 9a), outflow from deep
convection in the equatorial west Pacific is strong, producing
strong westerly winds across the central and eastern equatorial
Pacific. This in turn creates a minimum of speed shear in the
mean zonal wind and allows Rossby waves to propagate from
midlatitudes deep into the subtropics (strong eddy activity).
Although we must still quantify the relative roles of vertical versus horizontal transient water vapor flux, it is easiest to
BATES ET AL.' VARIABILITY OF UPPER TROPOSPHERIC HUMIDITY 32,279 30N 20N 10N EQ 10S 20S 30S 120E 30N 140E 160E 180 160W 140W 120W 100W 80W 20N 10N EQ 10S 20S 30S 120E 140E 30N 20N 10N EQ 10S 20S 160E 180 160W 140W 120W 100W 80W 30S I
120E 140E 160E 180 160W 140W 120W 100W 80W
Figure 8. The 200-hPa
total stationary
Rossby
wave
number
for boreal
spring
(a) mean,
(b) UTH anomaly
months greater than 0.7%, and (c) UTH anomaly months less than -0.7%.
change the water vapor by vertical flux since the water vapor mixing ratio gradient is much larger in the vertical than the
horizontal. The westerly duct is the smallest when deep con-
vection extends far into the central and eastern equatorial
Pacific (Figure 9b). In this case there is only weak westerly
outflow in the far eastern Pacific and weak winds or even
easterlies in the central Pacific. This leads to strong shear of
the zonal winds in the subtropics and inhibits the propagation
of Rossby waves (no eddies).
Although we find a relationship between the extremes of tropic-wide UTH and the variability of the westerly duct in the tropical Pacific Ocean, our initial examination was driven by trying to explain the extremes in the UTH time series for the very large ENSO warm event of 1982-1983 and the cold event
of 1989. The UTH time series, however, is noisy, and there are
several more modest ENSO events in the time series. Is there
a general relationship between ENSO events and the UTH
time series? We find that UTH maximums occur most fre-
quently when SST anomalies in the Nifio-3 region are near
normal and UTH minimums occur when SST anomalies are
near normal or positive. Thus there does not appear to be a more general relationship between a simple ENSO index and
the UTH extremes.
5. Conclusions
The clear column radiance data set for HIRS channel 12 and for UTH have been updated and now extend from January
32,280 BATES ET AL.: VARIABILITY OF UPPER TROPOSPHERIC HUMIDITY 20N 10N - EQ- 10S - 20S - 30S 120E ß DEEP
•
STRONG
• WESTERLIESEDDY
ACTIVITY
•I I I I I I I 140E 160E 180 160W 140W 120W 100W a
• WESTERLIES
•
80W 30N 20N 10N ø ,•,, DEEP CONV. 1 os -ø - "-' '•. : : •O EDDIES 20S •, 2> WESTERLIES •120E 140E 160E 180 160W 140W 120W 100W
b
NO
EDDIES
'•
80W
Figure 9. Schematic of the basic state circulation features for
(a) the open westerly duct and (b) the closed westerly duct.
duct and greatly inhibited the propagation of transient eddies into the subtropics.
We find these results also apply more generally to the rela- tionship between the tropical basic state circulation during boreal winter and spring. When there are positive tropic-wide UTH anomalies exceeding 0.7%, the westerly duct is larger
than normal, and when UTH anomalies are less than -0.7%,
the westerly duct is smaller than normal.
Much work remains to be done to further explore this hy- pothesis. We are currently conducting a study of the water
budget to quantify the influence of the different components of
the moisture flux on the net water budget of the subtropics. We
are interested in both the stationary and the transient eddy
fluxes and the vertical and horizontal components. The influ-
ence of clouds cannot be ignored, and we would like to conduct
a more complete analysis of the net radiation budget with and
without clouds. Within the deep tropics, the organization of
convection over the Pacific is determined not by a simple SST
index but rather by the SST gradient field. Since the organiza- tion of convection is related to the tropical basic flow, and
hence the amount of eddy activity in the subtropics, accurate
prediction of the SST gradient field is a key parameter for both
improved modeling of seasonal to interannual variations and
climate change.
Acknowledgment. George Kiladis suggested we look at the con-
nection between Rossby wave action in the east Pacific and variability
in upper tropospheric humidity.
1979 to May 1998. Future updates will be produced from the HIRS level lb data set for all HIRS channels as part of the TOVS Radiance Pathfinder Project. The intersatellite calibra- tion, using the technique of empirical dynamic function anal- ysis, has been performed for the additional overlap periods of the NOAA-14/12 and NOAA-11/14 satellites. We have vali-
dated this empirical intersatellite calibration by computing the
intersatellite biases using first-principle physics based on a
sample of atmospheric profiles and the measured filter re-
sponse functions. This comparison suggests that for most of the
instruments the empirically derived biases are consistent with
those expected from physical changes in the instrument filter
response functions from instrument to instrument, the only exception being the overlap period for the NOAA-9 and
NOAA-10 instruments.
Strong tropical and midlatitude interactions occur preferen-
tially during northern winter and spring due to the presence of
upper tropospheric westerly winds in both the central and the
eastern equatorial Pacific and in the midlatitudes. Midlatitude
eddies, or Rossby waves, can propagate into the subtropics and
tropics under such circumstances. The vertical and horizontal
motions associated with these waves advect moisture both ver-
tically and horizontally, moistening the normally dry subtrop-
ics. This moistening is greatly enhanced during the ENSO cold
event of 1989-1990. During this time, convection was confined
to the far western equatorial Pacific producing a long fetch of
upper tropospheric westerlies in the central and eastern equa-
torial Pacific and thus enhancing the transient eddy activity in
the tropics. During the extreme ENSO warm event of 1982-
1983, convection occurred over the central and eastern equa-
torial Pacific greatly diminishing, or even reversing, the west-
erly winds in the upper troposphere. This closed the westerly
References
Bates, J. J., X. Wu, and D. L. Jackson, Interannual variability of
upper-tropospheric water vapor band brightness temperature, J. Clim., 9(2), 427-438, 1996.
Berk, A., L. S. Bernstein, and D.C. Robertson, MODTRAN.' A Mod- eraw Resolution Model for LOWTRAN 7, Spectral Sciences, Inc., Burlington, Mass., 1989.
Brest, C. L., W. B. Rossow, and M.D. Roiter, Update of radiance
calibrations for ISCCP, J. Atmos. Oceanic Technol., 14(5), 1019-
1109, 1997.
Chaboureau, J.P., A. Chedin, and N. A. Scott, Relationship between
sea surface temperature, vertical dynamics, and the vertical distri- bution of atmospheric water vapor inferred from TOVS observa- tions, J. Geophys. Res., 103, 23-34, 1998.
Christy, J. R., R. W. Spencer, and R. T. McNider, Reducing noise in the MSU daily lower-tropospheric global temperature data set, J. Clim., 8(4), 888-902, 1995.
Christy, J. R., R. W. Spencer, and E. S. Lobl, Analysis of the merging
procedure for the MSU daily temperature time series, J. Clim., 11,
2016-2041, 1998.
Ellingson, R. G., L. Hai-Tien, D. Yanuk, and A. Gruber, Validation of
a technique for estimating outgoing longwave radiation from HIRS radiance observations, J. Atmos. Oceanic Technol., ••(2), 357-365,
1994.
Eyre, J. R., A Fast Radiative Transfer Model for Satellite Sounding Systems, pp. 26, Eur. Cent. for Medium-Range Weather Forecasts, Reading, England, 1991.
Holland, J. Z., and E. M. Rasmusson, Measurements of the atmo-
spheric mass, energy, and momentum budgets over a 500 km square
of tropical ocean, Mon. Weather Rev., 101, 44-53, 1973.
Iskenderian, H., A 10-year climatology of Northern Hemisphere trop- ical cloud plumes and their composite flow patterns, J. Clim., 8,
1630-1637, 1995.
Jackson, D. L., and J. J. Bates, Upper tropospheric humidity algorithm
assessment, J. Geophys. Res., this issue.
Kalnay, E., The NCEP/NCAR 40-year reanalysis project, Bull. Am. Meteorol. Soc., 77(3), 437-448, 1996.
Kiladis, G. N., Observations of Rossby waves linked to convection over
the eastern tropical Pacific, J. Atmos. Sci., 55(3), 321-335, 1998.
BATES ET AL.: VARIABILITY OF UPPER TROPOSPHERIC HUMIDITY 32,281
sonality of large-scale circulations associated with submonthly trop-
ical convection, Mort. Weather Rev., 125(9), 1997-2008, 1997.
Kley, D., J. M. Russell III, and C. Phillips, SPARC Assessment of Upper
Tropospheric and Lower Stratospheric Water Vapour, pp. 305, Ge- neva, Stratospheric Process. and Their Role in Clim., Switzerland,
2000.
Matthews, A. J., and G. N. Kiladis, Interactions between ENSO, tran-
sient circulation, and tropical convection over the Pacific, J. Clim.,
12(10), 3062-3074, 1999.
McNally, A. P., and M. Vesperini, Variational analysis of humidity from the TOVS radiances, Q. J. R. Meteorol. Soc., 122, 1521-1544,
1996.
National Research Council (NRC), Reconciling Observations of Global
Temperature Change, pp. 85, Natl. Acad. of Sci., Washington, D.C.,
2000.
Peixoto, J.P., and A. H. Oort, Physics of Climate, 434 pp., Am. Inst. of
Phys., New York, 1992.
Pierrehumbert, R. T., Lateral mixing as a source of subtropical water vapor, Geophys. Res. Lett., 25, 151-154, 1998.
Pierrehumbert, R. T., and R. Roca, Evidence for control of Atlantic
subtropical humidity by large-scale advection, Geophys. Res. Lett.,
25(24), 4537-4540, 1998.
Reynolds, R. W. S., T. M. Smith, Improved sea surface temperature analysis using optimum interpolation, J. Clim., 7, 929-937, 1994. Salathe, E. P., and D. L. Hartmann, Subsidence and upper-
tropospheric drying along trajectories in a general circulation model,
J. Clim., 13, 257-263, 2000.
Sherwood, S.C., Maintenance of the free-tropospheric tropical water
distribution, part II, Simulation by large-scale advection, J. Clim., 9,
2919-2934, 1996.
Slingo, A., J. A. Pamment, and M. J. Webb, A 15-year simulation of the clear-sky greenhouse effect using the ECMWF reanalyses: fluxes
and comparisons with ERBE, J. Clim., ••(4), 690-706, 1998.
Soden, B. J., and F. P. Bretherton, Interpretation of TOVS water vapor radiances in terms of layer-average relative humidities:
Method and climatology for the upper, middle, and lower tropo- sphere, J. Geophys. Res., 101, 9333-9343, 1996.
Soden, B., et al., An intercomparison of radiation codes for retrieving upper tropospheric humidity in the 6.3 micron band: A report from
the 1st GVAP Workshop, Bull. Am. Meteorol. Soc., 81, 797-808,
2000.
Stephens, G. L., D. L. Jackson, and I. Wittmeyer, Global observations of upper-tropospheric water vapor derived from TOVS radiance
data, J. Clim., 9(2), 305-326, 1996.
Webster, P. J., and J. R. Holton, Cross-equatorial response to middle- latitude forcing in a zonally varying basic state, J. Atmos. Sci., 39(4),
722-733, 1982.
Wielicki, B. A., et al., Clouds and the Earth's Radiant Energy System (CERES): Algorithm overview, IEEE Trans. Geosci. Remote Sens., 36(4), 1127-1136, 1998.
Xie, P., and P. Arkin, Global precipitation: A 17-year monthly analysis based on gauge observations, satellite analysis, and numerical model
outputs, Bull. Am. Meteorol. Soc., 78(11), 2539-2558, 1997. Yulayeva, E., and J. M. Wallace, The signature of ENSO in global
temperature and precipitation fields derived from the Microwave Sounding Unit, J. Clim., 7(11), 1719-1730, 1994.
J. J. Bates, Environmental Technology Laboratory, NOAA, 325
Broadway, Boulder, CO 80305, USA. ([email protected]) Z. D. Bergen, F.-M. Br6on, and D. L. Jackson, Cooperative Institute
for Research in Environmental Sciences, NOAA, Mail Code R/ET7,
University of Colorado, Boulder, CO 80305-3328, USA.
(darre n.l.jackson @noaa.gov)
(Received January 9, 2001; revised August 9, 2001;