HAL Id: hal-01096293
https://hal.archives-ouvertes.fr/hal-01096293
Submitted on 27 Dec 2014
HAL is a multi-disciplinary open access
archive for the deposit and dissemination of
sci-entific research documents, whether they are
pub-lished or not. The documents may come from
teaching and research institutions in France or
abroad, or from public or private research centers.
L’archive ouverte pluridisciplinaire HAL, est
destinée au dépôt et à la diffusion de documents
scientifiques de niveau recherche, publiés ou non,
émanant des établissements d’enseignement et de
recherche français ou étrangers, des laboratoires
publics ou privés.
NAO-temperature signals in proxy records
M. Casado, P. Ortega, Valérie Masson-Delmotte, C. Risi, D. Swingedouw, V.
Daux, D. Genty, F. Maignan, O. Solomina, B. Vinther, et al.
To cite this version:
M. Casado, P. Ortega, Valérie Masson-Delmotte, C. Risi, D. Swingedouw, et al.. Impact of
precip-itation intermittency on NAO-temperature signals in proxy records. Climate of the Past, European
Geosciences Union (EGU), 2013, 9 (2), pp.871-886. �10.5194/cp-9-871-2013�. �hal-01096293�
Clim. Past, 9, 871–886, 2013 www.clim-past.net/9/871/2013/ doi:10.5194/cp-9-871-2013
© Author(s) 2013. CC Attribution 3.0 License.
EGU Journal Logos (RGB)
Advances in
Geosciences
Open Access
Natural Hazards
and Earth System
Sciences
Open AccessAnnales
Geophysicae
Open AccessNonlinear Processes
in Geophysics
Open AccessAtmospheric
Chemistry
and Physics
Open AccessAtmospheric
Chemistry
and Physics
Open Access DiscussionsAtmospheric
Measurement
Techniques
Open AccessAtmospheric
Measurement
Techniques
Open Access DiscussionsBiogeosciences
Open Access Open Access
Biogeosciences
Discussions
Climate
of the Past
Open Access Open Access
Climate
of the Past
Discussions
Earth System
Dynamics
Open Access Open Access
Earth System
Dynamics
DiscussionsGeoscientific
Instrumentation
Methods and
Data Systems
Open Access
Geoscientific
Instrumentation
Methods and
Data Systems
Open Access DiscussionsGeoscientific
Model Development
Open Access Open Access
Geoscientific
Model Development
DiscussionsHydrology and
Earth System
Sciences
Open AccessHydrology and
Earth System
Sciences
Open Access DiscussionsOcean Science
Open Access Open Access
Ocean Science
Discussions
Solid Earth
Open Access Open Access
Solid Earth
DiscussionsThe Cryosphere
Open Access Open Access
The Cryosphere
DiscussionsNatural Hazards
and Earth System
Sciences
Open Access
Discussions
Impact of precipitation intermittency on
NAO-temperature signals in proxy records
M. Casado1, P. Ortega1, V. Masson-Delmotte1, C. Risi2, D. Swingedouw1, V. Daux1, D. Genty1, F. Maignan1, O. Solomina3, B. Vinther4, N. Viovy1, and P. Yiou1
1Laboratoire des Sciences du Climat et de l’Environnement, UMR8212, CEA-CNRS-UVSQ/IPSL – CEA Saclay,
91 191 Gif-sur-Yvette C´edex, France
2Laboratoire de M´et´eorologie Dynamique, PMC-CNRS-ENS/IPSL, Paris, France 3Institute of Geography, Russian Academy of Sciences, Moscow, Russia
4Center for Ice and Climate, Niels Bohr Institute, University of Copenhagen, Copenhagen, Denmark
Correspondence to: M. Casado (mathieu.casado@gmail.com)
Received: 7 September 2012 – Published in Clim. Past Discuss.: 8 October 2012 Revised: 29 January 2013 – Accepted: 1 March 2013 – Published: 27 March 2013
Abstract. In mid and high latitudes, the stable isotope ratio
in precipitation is driven by changes in temperature, which control atmospheric distillation. This relationship forms the basis for many continental paleoclimatic reconstructions us-ing direct (e.g. ice cores) or indirect (e.g. tree rus-ing cellulose, speleothem calcite) archives of past precipitation. However, the archiving process is inherently biased by intermittency of precipitation. Here, we use two sets of atmospheric reanaly-ses (NCEP (National Centers for Environmental Prediction) and ERA-interim) to quantify this precipitation intermittency bias, by comparing seasonal (winter and summer) tempera-tures estimated with and without precipitation weighting. We show that this bias reaches up to 10◦C and has large interan-nual variability. We then assess the impact of precipitation intermittency on the strength and stability of temporal corre-lations between seasonal temperatures and the North Atlantic Oscillation (NAO). Precipitation weighting reduces the cor-relation between winter NAO and temperature in some areas (e.g. Qu´ebec, South-East USA, East Greenland, East Siberia, Mediterranean sector) but does not alter the main patterns of correlation. The correlations between NAO, δ18O in precip-itation, temperature and precipitation weighted temperature are investigated using outputs of an atmospheric general cir-culation model enabled with stable isotopes and nudged us-ing reanalyses (LMDZiso (Laboratoire de M´et´eorologie Dy-namique Zoom)). In winter, LMDZiso shows similar corre-lation values between the NAO and both the precipitation weighted temperature and δ18O in precipitation, thus
sug-gesting limited impacts of moisture origin. Correlations of comparable magnitude are obtained for the available obser-vational evidence (GNIP (Global Network of Isotopes in Pre-cipitation) and Greenland ice core data). Our findings support the use of archives of past δ18O for NAO reconstructions.
1 Introduction
The North Atlantic Oscillation (NAO) is known to have large impacts on mid to high latitudes climate, affecting daily to seasonal patterns of precipitation or temperature (Wanner et al., 2001; Hurrell et al., 2003). This is related to the asso-ciated shift in the storm track path leading to a quadrupole of surface temperature anomalies, consisting of a northern “seesaw” between northern Europe and North America, and a southern seesaw with nodes centered in the Mediterranean area and the southeastern United States (Pinto and Raible, 2012). While winter NAO has long been reported to af-fect Northern Hemisphere climate, the impacts of summer NAO have also been depicted in specific regions such as Europe and Greenland (Folland et al., 2009). Instrumental records document large interannual and decadal variations in the NAO index (Jones et al., 1997), usually defined as the pressure difference between the Azores high and the Ice-landic low (Hurrell, 1995). Obtaining longer records is cru-cial to assess the natural spectrum of NAO variability and its response to external forcings (such as changes in solar
and volcanic activity, or anthropogenic perturbations) and to evaluate the ability of climate models to capture the NAO variability (IPCC, 2007).
Over the last 15 yr, several studies have combined dif-ferent sets of documentary data and paleoclimate informa-tion in order to propose reconstrucinforma-tions of pre-instrumental NAO variability (Appenzeller et al., 1998; Glueck and Stock-ton, 2001; Cook et al., 2002; Casty et al., 2007; Trouet et al., 2012, 2009; K¨uttel et al., 2011; Pinto and Raible, 2012; Luterbacher et al., 1999, 2000, 2001, 2002). These studies have used information related to precipitation and/or temper-ature in seasonal to annually resolved archives, such as den-drochronological series or Greenland ice core accumulation. Some stalagmites possess annual laminae (visible and/or flu-orescent) which are used to construct precise chronologies of the past decades or centuries (Baker et al., 1993; Genty, 1993; Fleitmann et al., 2009). Thicknesses (from ∼ 0.01 to 1 mm yr−1) that are controlled by rainfall and temperature
have been used as proxy for high resolution climate recon-structions (Munoz et al., 2009; Tan et al., 2006). Among the rare examples that used stalagmite layer thickness, the one from the Uamh Cave system (North Scotland) showed signif-icant correlation between fluorescent laminae thickness and winter instrumental NAO index (Proctor et al., 2000; Baker et al., 2002; Baldini et al., 2006) and, combined with tree ring data from Morocco, was used to derive fluctuations of NAO during the last millennium (Trouet et al., 2009). The relia-bility of air temperature-sensitive and precipitation-sensitive proxies to reconstruct the NAO has been assessed and com-pared in a climate simulation for the last 490 yr (Zorita and Gonz´alez-Rouco, 2002), suggesting that the precipita-tion proxies lead to more robust reconstrucprecipita-tions. It should be noted, however, that proxy records dependent on hydrology are likely influenced both by dynamical and thermal changes (since specific humidity depends strongly on local temper-ature), as was shown for Maunder Minimum simulations (Yoshimori et al., 2006). Such proxy records cannot there-fore be interpreted exclusively in terms of past circulation changes.
All NAO reconstructions show large multidecadal vari-ability. However, prior to the 19th century, they show a lack of consistency (Pinto and Raible, 2012). This may be due to the influence of other modes of variability, which can af-fect North Atlantic climate such as the Atlantic Multidecadal Oscillation (Delworth and Mann, 2000), to variable telecon-nections (Raible et al., 2006), to the different source datasets (Zorita and Gonz´alez-Rouco, 2002) and methodologies em-ployed (Lehner et al., 2012). One way to reduce uncertainties is to expand the source data (type of proxies and spatial cov-erage) used for such reconstructions.
Recently, a significant imprint of NAO has been identi-fied in precipitation isotopic composition (δ18O) in Green-land ice core records (Barlow et al., 1993; Vinther et al., 2003a, 2010), both in monthly precipitation δ18O data from central Europe (Baldini et al., 2008) and in daily δ18O data
from Norway (Theakstone, 2011). Simulations conducted with general or regional atmospheric models equipped with the explicit representation of water stable isotopes have also depicted a clear signature of NAO in precipitation δ18O over Europe (Field, 2010; Langebroek et al., 2011), Greenland (Sjolte et al., 2011) and Svalbard (Divine et al., 2011). This imprint of the NAO is also observed in a growing number of tree ring cellulose isotope studies, from Europe (Treydte et al., 2007; Saurer et al., 2012; Hangartner et al., 2012) to Siberia (Sidorova et al., 2010). A recent study also describes a relationship between a high resolution record of Red Sea coral δ18O and the NAO (Felis and Rimbu, 2010). All these findings motivate the combined use of direct (ice cores) and indirect (e.g. tree ring cellulose, speleothem calcite or fluid inclusions, coral aragonite) archives of precipitation isotopic composition to reconstruct past NAO variability.
While precipitation δ18O is related to temperature, it is an integrated tracer of the water cycle (Jouzel, 2003). In mid and high latitudes, its variability is driven by atmospheric distil-lation, which is related to condensation temperature. Con-tinental recycling (van der Ent et al., 2010) can also affect the precipitation isotopic composition. Likewise, changes in air mass trajectories can strongly impact precipitation δ18O (Sodemann et al., 2008). Such effects can be evaluated us-ing second order tracers such as deuterium excess (Kurita, 2011) and 17O-excess (Landais et al., 2012), or quantified using isotopic models (Sturm et al., 2010). Here, we aim to quantify another source of uncertainty, related to precipita-tion intermittency. Indeed, precipitaprecipita-tion δ18O can only record climate information when precipitation occurs. Because tem-perature and precipitation can co-vary at daily, seasonal or interannual timescales, this precipitation intermittency bias may distort the original NAO-temperature signal in climate archives. This source of uncertainty was recently investigated for Greenland, using atmospheric reanalyses (Persson et al., 2011). It was shown that precipitation intermittency (frac-tion of summer/winter snowfall and its interannual variabil-ity) explained many aspects of NAO-isotope relationships in different Greenland ice core sites. A number of recent stud-ies have highlighted the importance of precipitation and tem-perature covariance at synoptic scales (Sime et al., 2008; Persson et al., 2011).
In order to assess the impact of precipitation intermittency bias on temperature–NAO relationships, we need to have ac-cess to daily, coherent and global precipitation and surface air temperature datasets. For this purpose, we used differ-ent sources of information: (i) two atmospheric reanalysis datasets and (ii) a simulation conducted with an atmospheric model equipped with water stable isotopes. The use of at-mospheric reanalyses ensures a physical and dynamical con-sistency between temperature and precipitation, and large-scale weather patterns. However, the precipitation amounts calculated by the reanalyses are prone to biases of the models they are based on, despite the assimilation of several obser-vational products. This motivates a comparison among the
M. Casado et al.: Impact of precipitation intermittency on NAO-temperature signals
Figures
873Figure 1. Climatologies of CRU-NCEP, ERA-interim, and LMDZ-iso fields of a) JJAS temperature
(ºC); b) DJFM temperature (ºC); c) JJAS precipitation (mm/season) and d) DJFM precipitation
(mm/season). The reference periods correspond to 1990-2010 in the atmospheric analyses and to
1979-2008 in LMDZiso. Note that all the regions with seasonal precipitation values lower than 5
mm/season have been masked out.
Fig. 1. Climatologies of CRU-NCEP, ERA-interim, and LMDZiso fields of (a) JJAS temperature (◦C); (b) DJFM temperature (◦C); (c) JJAS precipitation (mm season−1) and (d) DJFM precipitation (mm season−1). The reference periods correspond to 1990–2010 in the atmospheric analyses and to 1979–2008 in LMDZiso. Note that all the regions with seasonal precipitation values lower than 5 mm season−1have been masked out.
different reanalysis datasets (see Fig. 1) and with observa-tional data from meteorological stations (see Supplement, Sect. A). The use of an isotope-enabled model (LMDZiso (Laboratoire de M´et´eorologie Dynamique Zoom)), nudged to 3-dimensional wind patterns reanalyses from ERA40, then allows us to quantify the relationships between precipitation-weighted temperature and precipitation isotopic composi-tion, and to compare directly the simulated NAO-isotope relationships with observations.
After a description of the databases, simulations and meth-ods (Sect. 2), the bias induced by precipitation intermittency is quantified at different timescales, for winter and summer (Sect. 3). This focus on December–March (DJFM) and June– September (JJAS) is motivated by the reported impacts of NAO on seasonal climate variables, and by the ability of some proxy records to resolve seasonal variations (e.g. ice cores). We then analyse the impact of precipitation inter-mittency on correlations between temperature and NAO and compare our results with observations. Finally, key conclu-sions and perspectives are presented in Sect. 4. Additional information is available in the Supplement.
2 Databases, simulations and methods
2.1 Atmospheric reanalyses datasets
Two reanalysis datasets are used in this study: (i) NCEP data (Kalnay et al., 1996), modified for consistency with CRU TS.3.1 (Climate Research Unit Time Series) temper-ature data (Maignan et al., 2011); and (ii) ERA-interim data (Dee et al., 2011).
The first dataset, CRU-NCEP, is based on a combination of the NCEP (National Centers for Environmental Prediction) reanalysis (Kalnay et al., 1996), covering the period 1948 to 2010 with a 6-hourly 2.5 × 2.5◦ spatial resolution, and the CRU TS 3.1 dataset from the University of East Anglia (Mitchell and Jones, 2005), which provides monthly climate variables (temperature, precipitation, cloudiness and relative humidity) from 1901 to 2010 with 0.5 × 0.5◦ spatial reso-lution for both latitudes and longitudes on land areas. The daily NCEP fields are interpolated to the finer 0.5 × 0.5◦ spa-tial grid, and their climatology is corrected for biases with the monthly fields from CRU TS 3.1 (for further details see http://dods.extra.cea.fr/data/p529viov/cruncep/). The objec-tive of CRU-NCEP is double: first, to correct for biases in the NCEP dataset because fields such as precipitation or solar
radiation are produced by the atmospheric model and can show significant biases; second, to improve the resolution of the dataset and better account for the effect of orography, tak-ing advantage of the higher CRU dataset resolution. Thus, this final mixed CRU-NCEP dataset provides a fine resolu-tion both in time (6-hourly) and space (0.5◦).
In order to assess the robustness of our results, the analy-sis will be also extended to the ERA-Interim reanalyanaly-sis (Dee et al., 2011), with a resolution of 0.72 × 0.72◦for the period from 1990 to 2010. Comparisons between different reanal-yses products (see Sect. 2.4) and observations have stressed the good performance of the ERA-interim spatial and tem-poral distribution of precipitation (Bosilovich et al., 2008; Ma et al., 2009; Chen et al., 2011). The performance of the reanalyses depends on the assimilation of humidity observa-tions (Andersson et al., 2007; Janowiak et al., 2010) and the physical parameterization of the models, especially regard-ing atmospheric convection (Jung et al., 2010). Caveats in the representation of soil moisture in the NCEP reanalyses have been related to an overestimation of summer land pre-cipitation, due to excessive convective precipitation (Serreze and Hurst, 2000). At the monthly scale, these studies system-atically report better performance for winter than for summer precipitation.
The robustness of the results obtained using products of atmospheric reanalyses has been assessed by comparing the difference between precipitation weighted temperature and seasonal mean temperature (see Sect. 2.5) from these datasets, with the same calculations performed using the ECA&D (European Climate Assessment and Dataset, http: //eca.knmi.nl) daily station data (See Supplement, Sect. A, Fig. S1).
2.2 LMDZiso simulation
To compare the correlations between NAO and precipitation weighted temperature with those related to changes in pre-cipitation isotopic composition, a simulation for the period 1979–2008 with the isotopic model LDMZiso (Risi et al., 2010) was employed (Fig. 1). The simulation was nudged with the 3-dimensional horizontal winds of ERA-40 (Uppala et al., 2005) during the period 1979–2002, and from ECMWF (European Centre for Medium-Range Weather Forecasts) op-erational analyses thereafter. In both cases, the horizontal winds were interpolated from a regular 1.125 × 1.125◦grid to the resolution of LMDZiso before the nudging was ap-plied. No noticeable discontinuity due to the change in the nudging data was observed (Risi et al., 2010). Nudging with the reanalyses allows for a better representation of the syn-optic and interannual variability of both δ18O and temper-ature at mid and high latitudes. The LMDZiso simulation reproduces reasonably well the spatial and seasonal varia-tions of δ18O (Risi et al., 2010). However, its simulated win-ter precipitation δ18O is overestimated over central Green-land, associated to a warm temperature bias (2.6 and 6.4◦C
as compared respectively to CRU-NCEP and ERA-Interim; see Fig. 1b), also observed in other isotopic general circu-lation models (Steen-Larsen et al., 2011). Note that indeed the model resolution is relatively coarse (i.e. 2.5 × 3.75◦and 19 vertical levels) compared to the two reanalysis datasets, which are thereby expected to better represent small-scale climatic features, especially those related to complex orogra-phy. As for the two reanalyses, both the temperature biases due to precipitation intermittency and the spatial features of the associated NAO fingerprint will be also analysed in the LMDZiso outputs.
2.3 Precipitation isotopic composition datasets
Monthly precipitation δ18O data are available from the Global Network of Isotopes in Precipitation (GNIP) stations (Rozanski et al., 1993) and can be used to assess the robust-ness of the LMDZiso results. A key limitation arises from the brevity and discontinuities of most GNIP station records, with multidecadal information being mostly provided by a few central European stations (Baldini et al., 2008). Our anal-ysis will therefore focus on stations located north of 20◦N, where the main centres of action of the NAO are located. A subset of GNIP stations, for which summer and winter measurements are available for at least 10 yr, was selected to assess the link to the NAO variability. This 10-yr threshold yields a reasonable spatial coverage and allows for statisti-cal analysis. The data have been combined and re-gridded on a 1 × 1◦grid, resolving the high station density over cen-tral Europe. When more than one station is available in a grid point, only the station with the longest record is em-ployed. Under these conditions, 60 stations are finally se-lected. The selected locations are summarised in the Supple-ment (Sect. B, Tables S1 and S2) and their actual locations are shown in Fig. 8 (right column).
Greenland ice core data are also used as an independent source of information, but most records are available only prior to e.g. 1970, limiting the comparison with the most re-cent and reliable part of the reanalyses and with LMDZiso datasets (Sodemann et al., 2008; Sjolte et al., 2011). In this analysis, we used a compilation of winter and summer ice core data (Vinther et al., 2010) complemented by the new data from the NEEM (North Eemian) ice core (Steen-Larsen et al., 2011). Specific details on the ice core data are given in Supplement Table S3.
2.4 Climatologies
Figure 1 displays the climatologies of CRU-NCEP (1990– 2010), ERA-Interim (1990–2010) and LMDZiso (1979– 2008) for summer (JJAS) and winter (DJFM). Summer tem-peratures (Fig. 1a) show a general good agreement among the 3 datasets. As compared to the reanalyses, LMDZiso ex-hibits a cold bias, most obvious in regions of steep orogra-phy such as the Tibetan Plateau, and also at high latitudes
M. Casado et al.: Impact of precipitation intermittency on NAO-temperature signals 875
(e.g. northern Russia, Alaska and Nunavut). For winter tem-perature (Fig. 1b), the different datasets are also very coher-ent. An opposite bias is observed for LMDZiso with respect to the reanalyses, with comparatively higher temperatures around Greenland and Northern Yakutia. In these areas, sig-nificant discrepancies are found between ERA-interim and CRU-NCEP.
The climatologies of precipitation (Fig. 1c, d) reveal larger differences among the three datasets. Despite the large dif-ferences in resolution, the largest degree of agreement, both for summer and winter, occurs between LMDZiso and ERA-Interim. This points to a secondary role of orography as com-pared to the representation of large-scale dynamics, which is forced to be consistent through the nudging technique. The three datasets share common robust features, such as the distribution of summer precipitation across the Mediter-ranean Basin, northern Europe, southern and central Asia, the United States and southern Greenland, as well as the rep-resentation of winter precipitation in the coastal areas of Eu-rope, North America (at midlatitudes) and South-East Green-land. The largest discrepancies again appear at high latitudes, in regions such as western Russia and northern Greenland.
2.5 Calculation of precipitation-weighted temperature
The biases associated with precipitation intermittency are ex-pected to differ from one season to the next, for instance due to different radiative impacts of cloudiness. For each given year, we have therefore calculated seasonal (December– March, DJFM and June–September, JJAS) temperature and precipitation-weighted temperature averages.
The precipitation weighting was tested at three tempo-ral resolutions: the 6-h step dataset, and both the daily and monthly averages of temperature and precipitation. It is cal-culated with the simplest approach:
Tp,t(year, season, lat, lon) =
P
tT2 m(t,lat, lon) × p(t, lat, lon)
P
tp(t,lat, lon)
,
where t represents the different temporal resolution (6-hourly, daily or monthly means); lat and lon are the latitude and longitude, respectively; T2 m is the 2 m air temperature
and p the precipitation amount (which is the sum of rain-fall and snowrain-fall amounts). Differences between the 6-hourly and daily precipitation-weighted temperature may arise from differences in the diurnal cycle of precipitation and tempera-ture; differences between the daily and monthly precipitation weighted temperature are expected to be caused by the co-variance of temperature and precipitation at synoptic scales.
This calculation is performed for all CRU-NCEP, ERA-interim and LMDZiso datasets, and the respective results are compared and discussed in Sect. 3. Precipitation weighted temperature is not computed in grid points where annual pre-cipitation is less than 5 mm. This threshold allows avoiding artefacts associated with very rare precipitation events in
ar-Figure 2: Monthly NAO indices from 1960 to 2010 defined as normalized pressures differences between Gibraltar and Reykjavik. The lower panels depict individual time series: instrumental data (black), CRU-NCEP (red) and ERA (green) analyses, and LMDZiso simulation (blue). An 11 month binomial filter was applied on monthly data to stress annual minima and maxima. Upper panel: 25 month running correlation coefficient between the reference instrumental time series and ERA (green), CRU-NCEP (red) and LMDZiso (blue) outputs.
Fig. 2. Monthly NAO indices from 1960 to 2010 defined as nor-malized pressures differences between Gibraltar and Reykjavik. The lower panels depict individual time series: instrumental data (black), CRU-NCEP (red) and ERA-interim (green) analyses, and LMDZiso simulation (blue). An 11-month binomial filter was ap-plied on monthly data to stress annual minima and maxima. Up-per panel: 25 month running correlation coefficient between the reference instrumental time series and ERA-interim (green), CRU-NCEP (red) and LMDZiso (blue) outputs.
eas such as the Sahara; it does not affect NAO-influenced areas. The temperature biases associated to each weighting resolution are compared for CRU-NCEP in the Supplement (Sect. C). For the rest of the analysis we will exclusively fo-cus on the precipitation intermittency bias calculated from daily values.
2.6 North Atlantic Oscillation index
Our reference NAO time series is the instrumental index defined by Jones et al. (1997) and expanded by Vinther et al. (2003b), calculated as the normalised sea level pressure difference between Gibraltar/Cadiz and Reykjavik. Follow-ing this definition, NAO indices were computed from CRU-NCEP, ERA-interim and LMDZiso datasets. All these time series correlate well with the instrumental data, as indicated by correlation coefficients above 0.8 and around 0.9 for CRU-NCEP (Fig. 2). Small differences may be caused by the resolution of atmospheric models and the choice of indi-vidual atmospheric model grid points. This coherency justi-fies the use of the reanalyses and LMDZiso for investigating NAO–climate relationships in a realistic framework. How-ever, the small differences require that, for a given dataset, we use the NAO index most consistent with the dataset (e.g. LMDZiso surface climate parameters will be correlated with LMDZiso NAO index; GNIP data with the instrumental NAO index, and so forth).
The choice of an index based on pressure differences is questionable due to the shifting positions of the NAO pres-sure centers of action, both at the seasonal (Folland et al., 2009) and decadal scales (Raible et al., 2006; Pinto and Raible, 2012). An alternative definition of the NAO index is based on the first principal component of the sea level pres-sure field. Although during the summer both the variance ex-plained and the amplitude of the NAO diminishes substan-tially relative to winter (Hurrell et al., 2003), this pattern is still captured as the leading mode of SLP (sea level pres-sure) in the North Atlantic, both in the reanalyses and most climate model simulations (Blad´e et al., 2012). Note that the dipole structure is displaced towards the northeast dur-ing summer, with maximum positive anomalies in Scandi-navia, and negative ones over the Arctic Ocean (Supplement, Sect. D, Figs. S3, S4 and S5). This shift might introduce dif-ferences with respect to the station-based NAO index.
Hereafter, “NAO index” refers to this original station-based definition.
2.7 Statistical analyses
We focus on interannual relationships at the seasonal scale (December–March, DJFM and June–September, JJAS). For each grid point, the interannual relationships between DJFM or JJAS temperature, precipitation, precipitation-weighted temperature (using daily precipitation and temperature data) and the NAO index was quantified using the Pearson cor-relation coefficient, using the CDAT (Climate Data Anal-ysis Tools) 3.3 toolbox (http://www2-pcmdi.llnl.gov/cdat). The significance of linear correlations was assessed with a Student’s t test, which takes into account the series auto-correlation to calculate the actual degrees of freedom. Note that correlations were investigated for different time periods, depending on the dataset (e.g. 1979–2008 with LMDZiso, 1990–2010 for ERA-interim). We have used the NCEP dataset to assess the stability of correlations over different time periods (1950–1970, 1970–1990 and 1990–2010; see Sect. 3.5). This allowed a systematic comparison of the re-sults obtained from NCEP and ERA-interim over the time period 1990–2010. Correlations with the GNIP observation were calculated for different time periods when data were available for at least 10 yr.
3 Results and discussion
In this section, we describe the calculated mean precipitation intermittency biases (defined as Tp-T ) and also its influence on the NAO–temperature relationship for each season (JJAS and DJFM).
3.1 JJAS temperature biases
In summer, precipitation intermittency produces limited bi-ases (in terms of spatial extent and in terms of magnitude)
at mid and high latitudes (Fig. 3a). While NCEP suggests a small positive bias for high latitude lands, this result is nei-ther supported by ERA-Interim (positive bias only for Green-land), nor by LMDZiso (no bias). By contrast, all datasets depict a cold bias on western North America and around the Mediterranean Sea, albeit with different magnitudes (smaller for NCEP and larger for LMDZiso). Such a cold bias is sim-ulated in areas characterized by low mean summer precip-itation (Fig. 1a) and may be linked with the albedo effect of clouds, or the impact of evaporation on land temperature (Hirschi et al., 2011).
By computing its interannual standard deviation (Fig. 3c), we identify regions where the temperature bias is more vari-able, and therefore where precipitation weighting is more sensitive to internal climate variability. During summer, the regions with the largest standard deviations are confined to the Pacific Coast of the United States, the Mediterranean Basin and central Asia. This is observed in the three datasets, although with higher values in LMDZiso. Less coherent re-sults are obtained for the winter season, when the areas with largest standard deviations vary from one dataset to another. Despite these discrepancies, large standard deviations are found for northern North America (including Greenland), and northern Asia, as well as North Africa – India (for ERA-Interim and LMDZiso). LMDZiso also produces large standard deviations near Baffin Island.
3.2 Impact of precipitation intermittency on JJAS NAO–temperature relationships
The correlation patterns between the NAO and the fields of JJAS precipitation, temperature, precipitation weighted tem-perature and δ18O are displayed in Fig. 4 for the reanalyses and LMDZiso.
Correlations are generally patchy and weak for pre-cipitation (Fig. 4a), with significant negative correlations depicted by reanalyses for Western Europe and north-ern Siberia; LMDZiso does not capture the strength of these relationships. Larger areas are detected for NAO– temperature relationships (Fig. 4b), mostly in northern North America, Greenland (especially South Greenland) and NE Siberia. LMDZiso displays a particularly strong correlation in southern Greenland. For precipitation-weighted tempera-ture (Fig. 4c), correlations are weaker and more patchy, with significant negative correlation represented in some of the datasets for NW North America, some areas of Greenland, and, in reanalyses, NE Siberia.
In LMDZiso, strong negative correlations are simulated between JJAS NAO and δ18O (Fig. 4d) for NW North Amer-ica, NE North AmerAmer-ica, Greenland, and E Siberia. The fact that these correlations are stronger than for weighted temper-ature suggests that summer NAO also affects isotopic com-position due to air mass origins; this has not yet been ex-plored from specific trajectory calculations. The results ob-tained with LMDZiso must be taken with caution, due to the
M. Casado et al.: Impact of precipitation intermittency on NAO-temperature signals 877
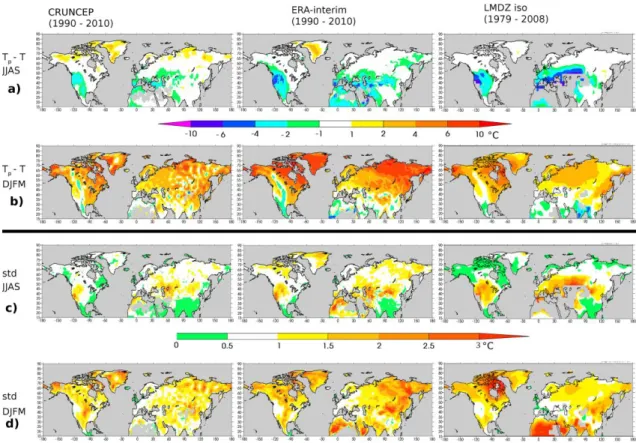
Figure 3: a) Mean precipitation intermittency bias for JJAS (in ºC), defined as the difference
between the daily precipitation weighted temperature (T
p) and the mean seasonal temperature
(T) in CRU-NCEP, ERA-interim and LMDZiso; b) The same but for DJFM; c,d) The same as
in the upper panels but showing the inter-annual standard deviation (std) of the biases in
JJAS and DJFM, respectively.
Fig. 3. (a) Mean precipitation intermittency bias for JJAS (in◦C), defined as the difference between the daily precipitation weighted temper-ature (Tp) and the mean seasonal temperature (T ) in CRU-NCEP, ERA-interim and LMDZiso; (b) The same but for DJFM; (c, d) The same as in the upper panels but showing the interannual standard deviation (std) of the biases in JJAS and DJFM, respectively.
fact that the simulated correlations are stronger than observed (Table S3, Fig. 8a).
The seasonal shift in the position of the centers of action of the NAO, which are displaced to the northeast during sum-mer (Fig. S3), can have an influence in the correlation pat-terns. This sensitivity to the position of the centers of ac-tion is assessed in Figs. S4 and S5, showing the correspond-ing correlation patterns for the NAO indices defined as the leading PC (principle components) of SLP in LMDZiso. In summer (Fig. S4), this alternative NAO index produces sig-nificant correlations in northern Europe not previously ob-served, and weaker values over Greenland. All these changes are consistent with the new position of the SLP dipole.
While small, the precipitation intermittency bias compli-cates the signal detection. From these investigations, we can-not rule out the possibility of estimating past changes in JJAS NAO based on isotopic proxies, from selected areas (NW, NE North America, E Siberia, Greenland) where T , Tpand δ18O are related to NAO.
3.3 DJFM bias
Over most Northern Hemisphere land areas, wet days are warmer than the average winter days, and this bias reaches up to 6◦C in Arctic areas such as Greenland, Alaska or
Siberia (Fig. 3b). This warm bias is consistent with the radiative impacts of water vapour and cloudiness on sur-face temperature. The spatial patterns of the DJFM bias are similar in CRU-NCEP, ERA-interim and LMDZiso, with a few regional differences in central Greenland and Eastern Siberia, possibly due to differences in simulated precipita-tion amounts (Fig. 1d). We note a specific band along the Rocky Mountains where precipitation weighting induces a cold bias, which could be related to an albedo effect of clouds and/or snow. The magnitude of the precipitation intermit-tency bias is much larger in ERA-interim at high latitudes (Fig. 3b). Surprisingly, LMDZiso produces a precipitation intermittency bias that is more similar to the magnitude de-rived from NCEP data, while its mean climate is closer to that of ERA-Interim. This might indicate that the nudging in LMDZiso is not strong enough to reproduce the timing and/or location of precipitation as in the original reanalysis, or that the results are dominated by the large temperature biases of LMDZiso at high latitudes (Fig. 1b). Altogether, robust features of the spatial pattern of precipitation inter-mittency bias emerge from the three datasets investigated here, with a large bias found in several areas where climate is affected by the NAO (with the exception of Europe).
Figure 4: Linear correlation coefficients between the respective JJAS NAO indices and the
fields of a) precipitation (p), b) temperature (T) and c) precipitation-weighted temperature
(T
p) in the CRU-NCEP (left), ERA-interim (middle) and LMDZiso (right) datasets. Significant
correlations are highlighted using a Student t-test (p<0.05) (thin black line). The correlation
coefficients with the summer fields of
18O are shown for the LMDZiso simulation in d).
Fig. 4. Linear correlation coefficients between the respective JJAS NAO indices and the fields of (a) precipitation (p), (b) temperature (T ) and (c) precipitation-weighted temperature (Tp) in the CRU-NCEP (left), ERA-interim (middle) and LMDZiso (right) datasets. Significant correlations are highlighted using a Student t test (p < 0.05) (thin black line). The correlation coefficients with the summer fields of δ18O are shown for the LMDZiso simulation in (d).
The interannual standard deviation of the precipitation in-termittency bias is represented on Fig. 3d, reaching 2◦C in several areas. NCEP and ERA-interim produce large interan-nual variability of the winter bias in northern North America, Greenland, and Siberia, while LMDZiso produces the largest variability in NE North America and has a significantly lower standard deviation in Siberia. The magnitude of high lati-tude precipitation intermittency bias and its variability has a potential to distort the fingerprint of NAO in precipitation archives, which is investigated in the next subsection.
3.4 Impact of precipitation intermittency on DJFM NAO–temperature relationships
Figure 5 shows the comparison of the correlation coeffi-cients between DJFM NAO and precipitation, temperature, and precipitation-weighted temperature (Tp) as calculated
for CRU-NCEP, and ERA-interim from 1990–2010 and for LMDZiso from 1979 to 2008.
Winter precipitation is positively correlated with the NAO in northern Europe (Fig. 5a), and areas of Russia in all datasets; LMDZiso seems to produce stronger correlations for Northern Europe than reanalyses. Negative correlations are also systematically produced for areas of NW North America (from Quebec to Ellesmere Island), western or South Greenland, Eastern Siberia and the Mediterranean area, where the strongest negative correlations are depicted in both reanalysis datasets.
The spatial correlation patterns of NAO with temperature (Fig. 5b) are different from the pattern previously described for precipitation. The results appear more coherent at a con-tinental scale, with positive correlations for SE North Amer-ica, western to northern Europe, Russia and central Siberia, and negative correlations for NW North America, Green-land, the southern Mediterranean land areas and Eastern
M. Casado et al.: Impact of precipitation intermittency on NAO-temperature signals 879
Figure 5: The same as in Figure 4 but for DJFM.
Fig. 5. The same as in Fig. 4 but for DJFM.Siberia. While stronger negative correlations are observed in ERA-interim, especially over Greenland where the strongest negative correlation is depicted (R < −0.75 for ERA), the strongest positive correlations are consistently obtained in north-western Europe (R > 0.75) for the three datasets. Over-all, LMDZiso shows correlations of smaller amplitude (both positive and negative) than the reanalyses, only capturing the centers of action over Greenland and Eurasia.
The main patterns of NAO–temperature correlation are preserved when considering precipitation-weighed tempera-ture (Fig. 5c), with the exception of East Greenland and East Mediterranean/Middle East areas. For LMDZiso, similar pat-terns of correlation are obtained for T and Tp, with even a stronger signal in a large central Europe area (R > 0.75) and a shift in the strongest negative correlation coefficient from southern to eastern Greenland. In the reanalyses, corre-lations seem to be sensitive to local conditions, such as orog-raphy. As a result, in CRU-NCEP correlations appear gen-erally reduced in Siberia/Russia, North America and Green-land. Likewise, for ERA-interim, the most remarkable
differ-ences are a general reduction of correlation in Greenland and South-western Russia, but enhanced correlation coefficients to the South-East of Finland and over the Central Siberian Plateau. The difference between the different datasets seems closely related to differences in the winter precipitation cli-matologies (Fig. 1d). The overall spatial features described herein remain robust for the other alternative NAO definition, i.e. the leading PC of SLP anomalies in the North Atlantic (Fig. S5).
3.5 Temporal stability of correlation
In the previous sections, analyses were focused on the most recent period (1990–2010), where there is an overlap be-tween our different datasets, and during which the reanal-ysis systems are most strongly constrained by assimilated observations. We are aware that this time interval is char-acterised by high DJFM NAO levels in the early 1990s. Figures 6 and 7 investigate, respectively, the stability of summer and winter NAO–climate (temperature, precipita-tion, and precipitation-weighted temperature) relationships
Figure 6: The same as Figure 4 but focused on the JJAS NAO correlations for three different time
intervals in CRU-NCEP: 1950-1970, 1970-1990 and 1990-2010.
Fig. 6. The same as Fig. 4 but focused on the JJAS NAO correlations for three different time intervals in CRU-NCEP: 1950–1970, 1970–1990 and 1990–2010.
Figure 7: The same as Figure 6 but for the winter (DJFM).
Fig. 7. The same as Fig. 6 but for the winter (DJFM).M. Casado et al.: Impact of precipitation intermittency on NAO-temperature signals 881
throughout different time periods. Three bi-decadal inter-vals have been compared: 1990–2010 (previously chosen for comparison with ERA-interim), and the new periods 1970– 1990 and 1950–1970. This latter period is characterised by a weak negative NAO mean state, while the other two show strong positive mean NAO values.
The summer is characterised by small and unstable NAO– climate relationships, as illustrated in Fig. 6 and also found by Vinther et al. (2010). Both the location and sign of corre-lation coefficients appear to vary through our three time inter-vals, despite being associated with rather similar mean sum-mer NAO values. This difficulty to identify robust features in the three periods points to shifts in the location of the sum-mer NAO centers of action, associated to reported changes in the North Atlantic summer mean circulation (Hurrell and Folland, 2002).
In winter, the correlation patterns with the NAO are clearly more robust (Fig. 7), although still subject to some spatial changes. For precipitation (Fig. 7a), only the negative cor-relations in the western Mediterranean region remain stable, while positive values over Scandinavia and western Russia appear for the last two periods, both characterised by a pos-itive mean NAO state. The correlation patterns for tempera-ture (Fig. 7b) show most robust featempera-tures through time, with persistent positive values in eastern North America, northern Europe and negative ones around the Labrador Sea, North Africa and the Middle East. Note again that, some correla-tions become insignificant only during the first time interval, in this case over eastern Greenland and Siberia. Finally, a similar picture holds for the precipitation-weighted tempera-tures (Fig. 7c), the main difference being that the magnitudes of correlation are generally smaller than for temperature, and also more affected by local conditions, which is normal given the weighting effect of precipitation.
We note that the quality of the reanalysis might be weaker for the first period (1950–1970), prior to the satellite data as-similation. It is also possible that, during this period, the neg-ative NAO-pattern has an influence over the NAO–climate relationship that would make it differ from the most recent periods, characterised by a positive NAO-pattern.
3.6 Comparison between DJFM NAO–Tpcorrelation
and NAO–δ18O correlation
As stated in the introduction, water stable isotopes are inte-grated tracers of the water cycle, and the isotopic composi-tion of precipitacomposi-tion itself is related not only to local con-densation temperature, but also to all phase changes occur-ring from evaporation to condensation. Second order param-eters (deuterium excess or17O excess) may provide evidence for changes in evaporation conditions. However, the observa-tional records (precipitation monitoring) are too short to be used to analyse correlations between these parameters and the NAO, and therefore the relationships between the NAO and changes in moisture origin. For Greenland, where ice
core records of past precipitation are available, numerous seasonally resolved δ18O records are available (Vinther et al., 2010), while only a few datasets of deuterium excess (Sodemann et al., 2008; Steen-Larsen et al., 2011) or17O excess (Landais et al., 2012), which require higher accuracy, are available. The most robust results have been produced for combined δ18O from several shallow ice cores. So far, based on observations, it has not been possible to quantify the impact of NAO on moisture sources and therefore the pos-sible biases introduced in local climate-δ18O relationships. Yet, through the computation of moisture back-trajectories for Greenland precipitation, Sodemann et al. (2008) has iden-tified SST (sea surface temperature) changes of up to 5◦C related to positive versus negative NAO winter conditions, thus suggesting that processes other than condensation tem-perature are likely to impact the NAO – δ18O relationship. We are therefore fully aware that relationships between NAO and δ18O can involve processes other than condensation tem-perature. To quantify these processes, we compare the pattern and strength of the correlation between NAO and Tp, with the pattern and strength of the correlation between NAO and precipitation δ18O from LMDZiso (Figs. 5c and 8b).
First, the LMDZiso model results are described (Fig. 5). Overall, the spatial features of the correlation patterns be-tween the winter NAO and both Tpand δ18O are rather co-herent (Fig. 5c, d), with negative correlation values over parts of Greenland and NW North America (Labrador area), and positive values in northern Eurasia. However, there are clear differences regarding the actual locations for the significant values (> 0.35) over Greenland, as they occur near the east-ern coast for Tpand more in the western side for δ18O, which is more consistent with the correlation pattern for precipita-tion. In Eurasia, the extent and the strength of the significant correlations are smaller in δ18O than in Tp, suggesting that other processes (e.g. changes in moisture sources, changes between condensation and surface temperature) act to reduce the imprint of NAO in δ18O. This supports the idea that the investigation of the NAO–Tprelationships provides an ideal test bed for investigating NAO–δ18O relationships.
The LMDZiso NAO–δ18O and the NCEP and ERA-interim NAO–Tpcorrelations are now compared to observa-tions of NAO–δ18O correlations, using instrumental records of precipitation isotopic composition and Greenland ice cores. This comparison is strongly limited by the lack of consistency of the time frame where these observations are available (Supplement, Sect. B, Tables S1 and S2).
The GNIP data (Fig. 8; right column) confirm the simu-lated structure of winter NAO–δ18O relationships (Baldini et al., 2008), with positive correlations encountered in Western Europe, North America and Russia, and small, negative cor-relations over Iceland and Svalbard. No data are available to test the simulated negative NAO–Tp correlation depicted by NCEP and ERA-interim for the extreme east of Siberia and for the Qu´ebec/Baffin Bay/Ellesmere Island area. The strongest correlation coefficients are obtained for Western
Figure 8: Linear correlation coefficient between the respective a) JJAS and b) DJFM NAO
indices and
18O from GNIP and Greenland ice core data (right; see text and Suppl. Material,
Section C for details) and for LMDZiso (left); zoomed on the areas where observations are
available. Note that a different color scale is used compared to Figure 4 and 5, which allows
to show the sign of weak but significant correlations (light green and light yellow, with
absolute correlation coefficients between 0.15 and 0.35). White areas indicate small (non
significant) correlation coefficients.
Fig. 8. Linear correlation coefficient between the respective (a) JJAS and (b) DJFM NAO indices and δ18O from GNIP and Greenland ice core data (right; see text and Supplement, Sect. C for details) and for LMDZiso (left); zoomed on the areas where observations are available. Note that a different colour scale is used compared to Figs. 4 and 5, which shows the signs of weak but significant correlations (light green and light yellow, with absolute correlation coefficients between 0.15 and 0.35). White areas indicate small (non significant) correlation coefficients.
and central Europe, with R values up to 0.75, and there-fore comparable with the strength of the correlations pro-duced in this area for Tp and δ18O by NCEP, ERA-interim and LMDZiso. These strong correlations were also reported in several observational (Baldini et al., 2008) and modelling (Field, 2010; Langebroek et al., 2011; Sjolte et al., 2011) studies, which, however, often explored the anomalies be-tween specific positive and negative NAO situations, rather than linear correlations, preventing us from making quantita-tive comparisons.
Winter signals extracted from southern and central Green-land ice cores (Vinther et al., 2010) systematically depict a negative correlation coefficient with NAO, varying between −0.13 and −0.42 for the time intervals where raw data are available (Fig. 8b, Table S3). The comparison between the ice core signals and our results is also delicate because of the different time periods available, as most of the ice core records are only available prior to the 1970s. In NW Green-land, the new NEEM ice core shows no correlation between winter δ18O (one shallow ice core) and NAO for the last decades (Steen-Larsen et al., 2011). This ice core lies on an area of sharp gradients in atmospheric datasets (Figs. 5 and 8) where all datasets (CRU-NCEP, ERA-interim and LMDZiso) show large variations from significant negative correlation with local Tpand δ18O to zero correlation. The stronger win-ter NAO correlation depicted by reanalyses and LMDZiso compared to the NEEM data could be explained by two pos-sibilities: either all atmospheric models poorly capture the NW Greenland weather patterns and precipitation intermit-tency (in the Greenland area where annual precipitation is dominated by summer snowfall), or the NAO signal present in local temperature is masked in δ18O due to changes in
moisture source, while at the same time LMDZiso fails to capture these effects. The latter option cannot be excluded, as in situ, summer surface water vapour isotopic composition shows large subseasonal deuterium excess variations associ-ated with different air mass origins, which further cannot be captured by LMDZiso (Steen-Larsen et al., 2013).
4 Conclusions and perspectives
The precipitation intermittency biases and their implications for correlations with the North Atlantic Oscillation have been explored, using two atmospheric analyses and one atmo-spheric model equipped with water stable isotopes.
Summer NAO appears to leave a discernable imprint on temperature and isotopes in very specific areas (NE and NW North America, Greenland, E Siberia), but precipita-tion intermittency reduces the spatial extent and the magni-tude of the correlation with temperature. From existing iso-topic datasets, LMDZiso seems to overestimate the strength of the summer NAO imprint on Greenland water stable iso-topes, although it might be just an artefact of the particu-lar choice for the NAO index. Indeed, the alternative defi-nition as the leading PC for North Atlantic SLP (Fig. S3), which is more faithful to the actual position of the centers of action during the summer, shows a drastic decrease in the amplitude of these Greenland correlations. We therefore re-main extremely cautious about reconstructions of summer NAO using precipitation-sensitive archives. Further investi-gations should be performed using daily meteorological and water vapour isotopic data combined with back trajectories, because of the uncertainties on daily precipitation amounts in atmospheric models.
M. Casado et al.: Impact of precipitation intermittency on NAO-temperature signals 883
More robust conclusions can be achieved for winter NAO. For that season, precipitation intermittency only weakly af-fects the strong imprint of NAO on surface air tempera-ture, and NAO–climate relationships further appear stable throughout the investigated datasets and time periods. The correlations between winter NAO and Tplikely capture cor-rectly the actual signs and patterns of NAO–δ18O correlation. However, other factors do affect δ18O and may alter the re-lationship observed for Tp. The NAO signal in central Euro-pean δ18O appears as a robust feature, observed from the long GNIP data and captured in all atmospheric simulations with the right location and strength. The same conclusion applies to the negative correlation between NAO and Greenland win-ter δ18O. Other areas depict a strong simulated NAO imprint which cannot be compared to direct observations (e.g. North America, Russia). Overall, the consistency of several of our findings between NCEP, ERA-interim and LMDZiso, and with daily station data, suggest that they are robust. We have also shown that they are not affected by a different definition of NAO accounting for changes in action centers.
Our study shows the potential of using direct (ice cores) or indirect archives of winter precipitation δ18O for recon-structing past changes in the winter NAO index. Many pub-lished reconstructions referenced in Sect. 1 rely on precip-itation or temperature sensitive proxies. The winter NAO– precipitation relationship does not have large-scale character-istics that are robust over different atmospheric models and time periods, apart from its negative imprint in SW Green-land and Mediterranean area, and positive imprint in northern Europe. The NCEP data shows robust features in the winter NAO–Tp relation for three different time periods of 20 yr, all highlighting four main influence regions characterised by negative correlations from Labrador to the Baffin Bay and also in the North of Africa and the Middle East, and with positive values in the North of Europe and Russia, as well as in eastern North America. However, the extent and strength of these correlations change with time, probably as a result of the spatial variability in the centers of action of the NAO. We suggest that the Tpvariable (from in situ meteorological data, or from analyses) may present some advantages as a tar-get for calibrating δ18O proxy records, rather than the mean winter temperature, because of the magnitude and variability of the precipitation intermittency bias (Fig. 3). Of course, ob-taining pure winter δ18O records from natural archives other than ice cores is extremely difficult. However, deposition and archiving processes may propagate and preserve the winter NAO imprint in precipitation δ18O into summer or annual mean signals. This could be the case for tree ring cellulose, for instance if soil moisture is refilled by snow melt in moun-tainous or high elevation areas. Such processes could explain why, despite the influence of summer climate on tree growth, a link with the winter NAO is found in tree ring cellulose δ18O from Siberia, where data from Yakoutia appear in anti-phase with those from Taimyr, and in anti-phase with the variabil-ity depicted in Greenland ice cores (Sidorova et al., 2010).
Annually resolved speleothems may also preserve a winter precipitation δ18O signal, despite the complexity of infiltra-tion and calcificainfiltra-tion processes.
Compiling records of past precipitation δ18O interannual variability derived from different natural archives is the next step required for using them towards NAO reconstructions. The present study enables us to identify the regions where precipitation weighted temperature and δ18O exhibit the maximum correlation or negative correlation with the NAO over the recent instrumental era. The combination of records from the Mediterranean area (where winter precipitation is important), with records from central and northern Europe, Qu´ebec, Greenland and Russia/Siberia/Yakoutia has the po-tential to allow new, more robust reconstructions of the NAO. This could be achieved using precipitation δ18O estimated using lake sediments, speleothems, ice cores and tree ring cellulose, albeit with the difficulties related to the seasonal-ity and complexseasonal-ity of each archiving process. Multicenten-nial simulations conducted with coupled ocean–atmosphere models equipped with water stable isotopes could also be used to assess the stability of the NAO–δ18O relationships through time, in response to different forcings and under dif-ferent states of e.g. the Atlantic Multidecadal Oscillation. Al-though restricted to the last decades, our study suggests sys-tematically combining at least data from Europe and from Greenland in order to capture the structure of NAO imprints.
Supplementary material related to this article is
available online at: http://www.clim-past.net/9/871/2013/ cp-9-871-2013-supplement.pdf.
Acknowledgements. This study has been funded by the French Agence Nationale de la Recherche ANR CEPS GREENLAND project. We thank the three anonymous reviewers and also the par-ticipants to the ESF conference “Modes of variability in the climate system” for constructive comments and feedbacks on this work. The support of Jean-Yves Peterschmitt for figure processing is also ac-knowledged as well as Ralph Beeby for his careful read-through. This is a LSCE publication 4579.
Edited by: J. Luterbacher
The publication of this article is financed by CNRS-INSU.
References
Andersson, E., Holm, E., Bauer, P., Bejaars, A., Kelly, G. A., Mc-Nally, A. P., Simmons, A. J., Thepaut, J. N., and Tompkins, A. M.: Analysis and forecast impact of the main humidity ob-serving systems, Q. J. Roy. Meteorol. Soc., 133, 1473–1485, doi:10.1002/qj.112, 2007.
Appenzeller, C., Stocker, T. F., and Anklin, M.: North atlantic os-cillation dynamics recorded in greenland ice cores, Science, 282, 446–449, 1998.
Baker, A., Smart, P. L., Edwards, R. L., and Richards, D. A.: Annual growth in a cave stalagmite, Nature, 364, 518–520, doi:10.1038/364518a0, 1993.
Baker, A., Proctor, C. J., and Barnes, W. L.: Stalagmite lamina dou-blets: A 1000 year proxy record of severe winters in northwest scotland?, Int. J. Climatol., 22, 1339–1345, doi:10.1002/joc.800, 2002.
Baldini, L. M., McDermott, F., and Baldini, J. U. L.: De-tecting nao-mode variability in high-resolution speleothem isotope records, Geochim. Cosmochim. Ac., 70, A31–A31, doi:10.1016/j.gca.2006.06.170, 2006.
Baldini, L. M., McDermott, F., Foley, A. M., and Baldini, J. U. L.: Spatial variability in the european winter precipitation δ18O nao relationship: Implications for reconstructing nao-mode climate variability in the holocene, Geophys. Res. Lett., 35, L04709, doi:10.1029/2007GL032027, 2008.
Barlow, L. K., White, J. W. C., Barry, R. G., Rogers, J. C., and Grootes, P. M.: The north atlantic oscillation signature in deu-terium and deudeu-terium excess signals in the greenland ice sheet project 2 ice core, 1840–1970, Geophys. Res. Lett., 20, 2901– 2904, 1993.
Blad´e, I., Fortuny, D., van Oldenborgh, G. J., and Liebmann, B.: The summer north atlantic oscillation in cmip3 models and related uncertainties in projected summer drying in europe, J. Geophys. Res.-Atmos., 117, D16104, doi:10.1029/2012jd017816, 2012. Bosilovich, M. G., Chen, J. Y., Robertson, F. R., and Adler, R. F.:
Evaluation of global precipitation in reanalyses, J. Appl. Me-teorol. Climatol., 47, 2279–2299, doi:10.1175/2008jamc1921.1, 2008.
Casty, C., Raible, C., Stocker, T., Wanner, H., and Luterbacher, J.: A european pattern climatology 1766–2000, Clim. Dynam., 29, 791–805, doi:10.1007/s00382-007-0257-6, 2007.
Chen, L. L., Johannessen, O. M., Wang, H. J., and Ohmura, A.: Ac-cumulation over the greenland ice sheet as represented in reanal-ysis data, Adv. Atmos. Sci., 28, 1030–1038, doi:10.1007/s00376-010-0150-9, 2011.
Cook, E. R., D’Arrigo, R. D., and Mann, M. E.: A well-verified, multiproxy reconstruction of the winter north atlantic oscillation index since ad 1400, J. Climate, 15, 1754–1764, 2002.
Dee, D. P., Uppala, S. M., Simmons, A. J., Berrisford, P., Poli, P., Kobayashi, S., Andrae, U., Balmaseda, M. A., Balsamo, G., Bauer, P., Bechtold, P., Beljaars, A. C. M., van de Berg, L., Bid-lot, J., Bormann, N., Delsol, C., Dragani, R., Fuentes, M., Geer, A. J., Haimberger, L., Healy, S. B., Hersbach, H., Holm, E. V., Isaksen, L., Kallberg, P., Kohler, M., Matricardi, M., McNally, A. P., Monge-Sanz, B. M., Morcrette, J. J., Park, B. K., Peubey, C., de Rosnay, P., Tavolato, C., Thepaut, J. N., and Vitart, F.: The era-interim reanalysis: Configuration and performance of the data assimilation system, Q. J. Roy. Meteorol. Soc., 137, 553–597, doi:10.1002/qj.828, 2011.
Delworth, T. L. and Mann, M. E.: Observed and simulated multi-decadal variability in the northern hemisphere, Clim. Dynam., 16, 661–676, doi:10.1007/s003820000075, 2000.
Divine, D. V., Sjolte, J., Isaksson, E., Meijer, H. A. J., van de Wal, R. S. W., Martma, T., Pohjola, V., Sturm, C., and Godtliebsen, F.: Modelling the regional climate and isotopic composition of svalbard precipitation using remoiso: A comparison with avail-able gnip and ice core data, Hydrol. Process., 25, 3748–3759, doi:10.1002/hyp.8100, 2011.
Felis, T. and Rimbu, N.: Mediterranean climate variability doc-umented in oxygen isotope records from northern red sea corals – a review, Global and Planet. Change, 71, 232–241, doi:10.1016/j.gloplacha.2009.10.006, 2010.
Field, R. D.: Observed and modeled controls on precipitation delta o-18 over europe: From local temperature to the north-ern annular mode, J. Geophys. Res.-Atmos., 115, D12101, doi:10.1029/2009jd013370, 2010.
Fleitmann, D., Cheng, H., Badertscher, S., Edwards, R. L., Mudelsee, M., G¨okt¨urk, O. M., Fankhauser, A., Pickering, R., Raible, C. C., Matter, A., Kramers, J., and T¨uys¨uz, O.: Timing and climatic impact of greenland interstadials recorded in sta-lagmites from northern turkey, Geophys. Res. Lett., 36, L19707, doi:10.1029/2009gl040050, 2009.
Folland, C. K., Knight, J., Linderholm, H., Fereday, D., Ineson, S., and Hurrell, J. W.: The summer north atlantic oscillation: Past, present and future, J. Climate, 22, 1082–1103, 2009.
Genty, D.: Seasonal alternations in the internal structure of stalag-mites; importance for the reconstitution of continental paleoen-vironments, CR. Acad. Sci. II, 317, 1229–1236, 1993.
Glueck, M. F. and Stockton, C. W.: Reconstruction of the north at-lantic oscillation, 1429–1983, Int. J. Climatol., 21, 1453–1465, 2001.
Hangartner, S., Kress, A., Saurer, M., Frank, D., and Leuenberger, M.: Methods to merge overlapping tree-ring isotope series to generate multi-centennial chronologies, Chem. Geol., 294–295, 127–134, doi:10.1016/j.chemgeo.2011.11.032, 2012.
Hirschi, M., Seneviratne, S. I., Alexandrov, V., Boberg, F., Boroneant, C., Christensen, O. B., Formayer, H., Orlowsky, B., and Stepanek, P.: Observational evidence for soil-moisture im-pact on hot extremes in southeastern europe, Nat. Geosci., 4, 17– 21, doi:10.1038/ngeo1032, 2011.
Hurrell, J. W.: Decadal trends in the north atlantic oscillation: Re-gional temperatures and precipitation, Science, 269, 676–679, 1995.
Hurrell, J. W. and Folland, C. K.: A change in the summer atmo-spheric circulation over the north atlantic, CLIVAR Exchanges, 25, 52–54, 2002.
Hurrell, J. W., Kushnir, Y., Ottersen, G., and Visbeck, L.: An overview of the north atlantic oscillation, in: The north at-lantic oscillation: Climate significance and environmental im-pact, edited by: Hurrell, Y., Kushnir, Y., Ottersen, G., and Vis-beck, M., Geophysical Monoghraph Series, 1–35, 2003. IPCC: Climate Change 2007 – the physical science basis, Fourth
assessment report, Cambridge University Press, Cambridge, 1009 pp., 2007.
Janowiak, J. E., Bauer, P., Wang, W. Q., Arkin, P. A., and Gottschalck, J.: An evaluation of precipitation forecasts from operational models and reanalyses including precipitation vari-ations associated with mjo activity, Mon. Weather Rev., 138,
M. Casado et al.: Impact of precipitation intermittency on NAO-temperature signals 885
4542–4560, doi:10.1175/2010mwr3436.1, 2010.
Jones, P. D., Jonsson, T., and Wheeler, D.: Extension to the north at-lantic oscillation using early instrumental pressure observations from gibraltar and south-west iceland, Int. J. Climatol., 17, 1433– 1450, 10.1002/(sici)1097-0088(19971115)17:13¡1433::aid-joc203¿3.0.co;2-p, 1997.
Jouzel, J.: Water stable isotopes: Atmospheric composition and ap-plications in polar ice core studies, in: Treatise on geochemistry, edited by: Keeling, R. F., Elsevier, 213–243, 2003.
Jung, T., Balsamo, G., Bechtold, P., Beljaars, A. C. M., Kohler, M., Miller, M. J., Morcrette, J. J., Orr, A., Rodwell, M. J., and Tomp-kins, A. M.: The ecmwf model climate: Recent progress through improved physical parametrizations, Q. J. Roy. Meteorol. Soc., 136, 1145–1160, doi:10.1002/qj.634, 2010.
Kalnay, E., Kanamitsu, M., and Kistler, R., Collins, W., Deaven, D., Gandin, L., Iredell, M., Saha, S., White, G., Woollen, J., Zhu, Y., Chelliah, M., Ebisuzaki, W., Higgins, W., Janowiak, J., Mo, K. C., Ropelewski, C., Wang, J., Leetmaa, A., Reynolds, R., Jenne, R., and Joseph, D.: The ncep/ncar 40-year reanalyses project, B. Am. Meteorol. Soc., 77, 437–431, 1996.
K¨uttel, M., Luterbacher, J., and Wanner, H.: Multidecadal changes in winter circulation-climate relationship in europe: Frequency variations, within-type modifications, and long-term trends, Clim. Dynam., 36, 957–972, doi:10.1007/s00382-009-0737-y, 2011.
Kurita, N.: Origin of arctic water vapor during the ice-growth season, Geophys. Res. Lett., 38, L02709, doi:10.1029/2010gl046064, 2011.
Landais, A., Steen-Larsen, H. C., Guillevic, M., Masson-Delmotte, V., Vinther, B., and Winkler, R.: Triple isotopic composition of oxygen in surface snow and water vapor at neem (greenland), Geochim. Cosmochim. Ac., 77, 304–316, doi:10.1016/j.gca.2011.11.022, 2012.
Langebroek, P. M., Werner, M., and Lohmann, G.: Climate in-formation imprinted in oxygen-isotopic composition of pre-cipitation in Europe, Earth Planet. Sci. Lett., 311, 144–154, doi:10.1016/j.epsl.2011.08.049, 2011.
Lehner, F., Raible, C. C., and Stocker, T. F.: Testing the ro-bustness of a precipitation proxy-based north atlantic os-cillation reconstruction, Quaternary Sci. Rev., 45, 85–94, doi:10.1016/j.quascirev.2012.04.025, 2012.
Luterbacher, J., Schmutz, C., Gyalistras, D., Xoplaki, E., and Wan-ner, H.: Reconstruction of monthly nao and eu indices back to ad 1675, Geophys. Res. Lett., 26, 2745–2748, 1999.
Luterbacher, J., Rickli, R., Tinguely, C., Xoplaki, E., Sch¨upach, E., Dietriche, D., H¨usler, J., Amb¨uhl, M., Pfister, C., Beeli, P., Diet-riche, U., Danneckler, A., Davies, T. D., P. D. Jones, Slonosky, V., Ogilvie, A. E. J., Maheras, P., Kolyva-Machera, F., Martin-Vide, J., Barriendos, M., Alcoforado, M. J., Nunes, M. F., J´onsson, T., Glaser, R., Jacobeit, J., Beck, C., Philipp, A., Beyer, U., Kaas, E., Schmith, T., B¨arring, L., J¨onsson, P., R´acz, L., and Wanner, H.: Monthly mean pressure reconstruction for the late maunder min-imum period (ad 1675–1715), Int. J. Climatol., 20, 1049–1066, 2000.
Luterbacher, J., Xoplaki, E., Dietrich, D., Jones, P. D., Davies, T. D., Portis, D., Gonzalez-Rouco, J. F., von Storch, H., Gyalistras, D., Casty, C., and Wanner, H.: Extending north atlantic oscilla-tion reconstrucoscilla-tions back to 1500, Atmos. Sci. Lett., 2, 114–124, doi:10.1006/asle.2002.0047, 2001.
Luterbacher, J., Xoplaki, E., Dietrich, D., Rickli, R., Jacobeit, J., Beck, C., Gyalistras, D., Schmutz, C., and Wanner, H.: Recon-struction of sea level pressure fields over the eastern north altan-tic and europe back to 1500, Clim. Dynam., 18, 545–561, 2002. Ma, L. J., Zhang, T., Frauenfeld, O. W., Ye, B. S., Yang, D. Q., and
Qin, D. H.: Evaluation of precipitation from the era-40, ncep-1, and ncep-2 reanalyses and cmap-ncep-1, cmap-2, and gpcp-2 with ground-based measurements in china, J. Geophys. Res.-Atmos., 114, D09105, doi:10.1029/2008jd011178, 2009.
Maignan, F., Br´eon, F.-M., Chevallier, F., Viovy, N., Ciais, P., Gar-rec, C., Trules, J., and Mancip, M.: Evaluation of a Global Veg-etation Model using time series of satellite vegVeg-etation indices, Geosci. Model Dev., 4, 1103–1114, doi:10.5194/gmd-4-1103-2011, 2011.
Mitchell, T. D. and Jones, P. D.: An improved method of construct-ing a database of monthly climate observations and associated high-resolution grids, Int. J. Climatol., 25, 693–712, 2005. Munoz, A., Sen, A. K., Sancho, C., and Genty, D.: Wavelet
anal-ysis of late holocene stalagmite records from ortigosa caves in northern spain, J. Cave Karst Stud., 71, 63–72, 2009.
Persson, A., Langen, P. L., Ditlevsen, P., and Vinther, B. M.: The influence of precipitation weighting on interannual variability of stable water isotopes in greenland, J. Geophys. Res.-Atmos., 116, D20120, doi:10.1029/2010jd015517, 2011.
Pinto, J. G. and Raible, C. C.: Past and recent changes in the north atlantic oscillation, Wiley Interdisciplinary Reviews: Cli-mate Change, 3, 79–90, doi:10.1002/wcc.150, 2012.
Proctor, C. J., Baker, A., Barnes, W. L., and Gilmour, R. A.: A thousand year speleothem proxy record of north at-lantic climate from scotland, Clim. Dynam., 16, 815–820, doi:10.1007/s003820000077, 2000.
Raible, C., Casty, C., Luterbacher, J., Pauling, A., Esper, J., Frank, D., B¨untgen, U., Roesch, A., Tschuck, P., Wild, M., Vidale, P.-L., Sch¨ar, C., and Wanner, H.: Climate variability-observations, reconstructions, and model simulations for the atlantic-european and alpine region from 1500-2100 ad, Climatic Change, 79, 9– 29, doi:10.1007/s10584-006-9061-2, 2006.
Risi, C., Bony, S., Vimeux, F., and Jouzel, J.: Water-stable isotopes in the lmdz4 general circulation model: Model evaluation for present-day and past climates and applications to climatic inter-pretations of tropical isotopic records, J. Geophys. Res.-Atmos., 115, D12118, doi:10.1029/2009jd013255, 2010.
Rozanski, K., Araguas-Araguas, L., and Gonfiantini, R.: Isotopic patterns in modern global precipitation, in: Climate change in continental isotopic records, edited by: P. K. Swart, K. L. L., McKenzie, J., and Savin, S., AGU Geophys. Monogr., 1–37, 1993.
Saurer, M., Kress, A., Leuenberger, M., Rinne, K. T., Treydte, K. S., and Siegwolf, R. T. W.: Influence of atmospheric cir-culation patterns on the oxygen isotope ratio of tree rings in the alpine region, J. Geophys. Res.-Atmos., 117, D05118, doi:10.1029/2011jd016861, 2012.
Serreze, M. C. and Hurst, C. M.: Representation of mean arctic pre-cipitation from ncep-ncar and era reanalyses, J. Climate, 13, 182– 201, doi:10.1175/1520-0442(2000)013¡0182:romapf¿2.0.co;2, 2000.
Sidorova, O. V., Siegwolf, R. T. W., Saurer, M., Naurzbaev, M. M., Shashkin, A. V., and Vaganov, E. A.: Spatial patterns of climatic changes in the eurasian north reflected in siberian larch tree-ring