Development of One-Step Single-Cell RT-PCR
for the Massively Parallel Detection of Gene Expression
by Yuan Gong
M.S. Chemical Engineering Practice Massachusetts Institute of Technology, 2009
B.S. Chemical Engineering and Applied and Computational Mathematics California Institute of Technology, 2007
SUBMITTED TO THE DEPARTMENT OF CHEMICAL ENGINEERING IN PARTIAL FULLFILLMENT OF THE REQUIREMENTS FOR THE DEGREE OF
DOCTOR OF PHILOSOPHY IN CHEMICAL ENGINEERING AT THE
MASSACHUSETTS INSTITUTE OF TECHNOLOGY JUNE 2014
© 2014 Massachusetts Institute of Technology. All rights reserved.
Signature of Author: ___________________________________________________________ Yuan Gong Department of Chemical Engineering May 21, 2014 Certified by: __________________________________________________________________ J. Christopher Love Associate Professor of Chemical Engineering Thesis Supervisor Accepted by: _________________________________________________________________ Patrick S. Doyle Professor of Chemical Engineering Chairman, Committee for Graduate Students
3
Development of One-Step Single-Cell RT-PCR
for the Massively Parallel Detection of Gene Expression
by Yuan Gong
Submitted to the Department of Chemical Engineering on May 21, 2014 in Partial Fulfillment of the
Requirements for the degree of Doctor of Philosophy (Ph.D.) in Chemical Engineering
ABSTRACT
The United Nations estimates that over 35 million people are afflicted with HIV/AIDS in the world. Highly active antiretroviral treatments (HAART) that use a combination of drugs that target the virus at different stages of its life cycle are effective at reducing the HIV plasma levels below levels detectable by the most sensitive assays. However, upon termination of HAART, HIV RNA transcripts are measurable in the blood after 2-3 weeks. This relapse is attributed to the presence of a reservoir of latently infected cells, such as resting CD4+ T-cells. The latent reservoir in resting memory CD4+ T-cells has been estimated to decay with a half-life of as long as 44 months, thus hindering the eradication of HIV. Current knowledge of latent reservoirs came from the isolation of possible reservoir populations by cell surface markers and querying each population for the presence of HIV RNA. These measurements do not have single cell resolution so the exact frequencies of latently infected cells are not known.
In this thesis, we developed and optimized a method to detect cellular transcripts of single cells in an array of nanowells. The limit of detection of the assay was approximately 1.4 copies of DNA in a 125 pL well (18.6 fM) with a false positive rate as low as 4.6x10⁻⁵. Combining this assay along with image-based cytometry and microengraving, we generated a multivariate dataset on single cells to understand the relationships between cell phenotype, transcribed genes, and secreted products. We showed that gene expression could not be a surrogate measure for antibody secretion. We were also able to detect rare cells in a population at a frequency as low as 1 in 10,000. We then applied the technology to samples from a patient on HAART for more than 1.5 years. We were able to detect an infection rate of 1:3000 cells that had low levels of HIV RNA in bulk.
Thesis supervisor: J. Christopher Love Title: Associate Professor
5
Acknowledgments
I would like to thank my advisor, Professor J. Christopher Love, for accepting me in his group. He provided me with enjoyable problems to solve and a lot of guidance and creative ideas on new directions to overcome the many challenges in this work. I also greatly appreciate the advice he gave me during Practice School on how to manage and direct a team of co-workers towards a common goal. I hope I was as good a student to him as he was a mentor to me!
I would like to thank my thesis committee members, Professor K. Dane Wittrup, Professor Darrell Irvine, and Professor Bruce Walker, for all the feedback and advice they gave me to improve this thesis. I also want to thank my collaborators, Dr. Xu Yu and Dr. Maria J. Buzon, for sharing their knowledge and expertise on HIV latency with me. They also patiently waited for me as I optimized the technology to detect HIV in single cells. I am extremely grateful to Aaron Gawlik and Alan Stockdale for designing and building the RT-PCR machine.
It has been a great pleasure to work with all current and past members of the Love Lab: Dr. Adebola Ogunniyi, Dr. Qing Han, Dr. Jonghoon Choi, Dr. Yvonne Yamanaka, Dr. Todd Gierahn, Dr. Rita Lucia Contento, Timothy Politano, Denis Loginov, Dr. Ayca Yalcin Ozkumur, Dr. Qing Song, Dr. Eliseo Papa, Dr. Kerry Love, Vasiliki Panagiotou, Dr. Navin Varadarajan, Dr. Bin Jia, Dr. Sangram Bagh, Dr. Alexis Torres, Viktor Adalsteinsson, Brittany Thomas, Lionel Lam, Abby Hill, Sarah Schrier, Kimberly Ohn, Thomas Douce, Rachel Barry, Dr. Joe Couto, Dr. Konstantinos Tsioris, Dr. Lilun Ho, Dr. Kartik Shah, Dr. John Ballew, Nicholas Mozdzierz, Narmin Tahirova, Ross Zimnisky, John Clark, and Rachel Leeson. Thank you for all of your helpful suggestions and ideas to my project and for creating a fun and enjoyable lab environment!
Finally, I would like to thank my family and friends for supporting me for the past seven years. Your encouragement and love have kept me going throughout my graduate school experience.
7
Table of Contents
List of Figures ... 9
List of Tables ... 11
Introduction ... 13
1.1. Human immunodeficiency virus ... 13
1.2. Existing tools to detect HIV-infected cells ... 14
1.3. Amplification and detection techniques ... 16
1.4. Objectives and outline of thesis ... 18
Chapter 2. Materials and Methods ... 19
2.1. Cell line culture ... 19
2.2. Fabrication of array of nanowells... 20
2.3. Cytometry and imaging ... 21
2.4. One-step reverse transcription polymerase chain reaction (RT-PCR) ... 22
2.4.1. Primer and TaqMan probe selection ... 22
2.4.2. Imaging end-point RT-PCR signal ... 23
2.4.3. Quantitative TaqMan RT-PCR ... 25
2.4.4. Digital PCR in nanowells ... 25
2.5. Microengraving ... 25
2.6. Surface capture of transcripts ... 26
2.7. Hybridization chain reaction ... 27
2.8. Data Analysis ... 28
Chapter 3. Establishing one-step RT-PCR in nanowells ... 31
3.1. Optimization of cell lysis ... 31
3.2. Optimization of RT-PCR in nanowells ... 38
3.3. Optimization of pre-treatment of cells ... 39
3.4. Optimization of thermocycling ... 41
3.4. Discussion ... 46
3.4.1. Limit of detection of transcripts ... 46
3.4.2. Evaporation ... 48
3.4.3. Limitations ... 50
Chapter 4. Characterization of RT-PCR in nanowells ... 53
8
4.2. Integration with microengraving ... 57
Chapter 5. Identification of target cells in large populations ... 59
5.1. Cytometry ... 59
5.2. Activation of cells ... 62
5.3. Limit of detection of cells ... 66
5.4. HIV-positive patient sample... 67
5.5. Discussion ... 69
Chapter 6. Other methods to detect transcript ... 73
6.1. Surface capture of transcripts ... 73
6.2. Hybridization chain reaction ... 78
6.3. Discussion ... 81
Chapter 7. Conclusions ... 83
9
List of Figures
Figure 3.1. TaqMan probe mechanism ... 31
Figure 3.2. Determining the RT-qPCR kit ... 32
Figure 3.3. Comparison between 1-step Fast qScript with ROX and MGB ... 35
Figure 3.4. The effect of Tween-20 on the RT-qPCR reaction on 100 cells ... 35
Figure 3.5. The effect of NP-40 on the RT-qPCR reaction on 100 cells ... 36
Figure 3.6. Direct comparison between Tween-20 and NP-40 ... 36
Figure 3.7. Efficiency of RT-qPCR with the addition of 0.05% NP-40 or 0.5% Tween-20 ... 37
Figure 3.8. Effect of SDS on RT-qPCR on 100 cells ... 37
Figure 3.9. Temperature model for an increase in temperature from 60 °C to 95 °C after 5 seconds ... 39
Figure 3.10. Removal of false positives by RNase, DNase-free treatment ... 40
Figure 3.11. Sample images of digital PCR on a serial dilution of HIVgag DNA ... 44
Figure 3.12. Limit of detection for PCR ... 44
Figure 3.13. Various cycle numbers for PCR on HIVgag DNA ... 45
Figure 3.14. Detection of B2M mRNA transcripts on beads from bulk cellular mRNA extraction ... 47
Figure 3.15. Detection on B2M mRNA from bulk cellular mRNA extraction ... 47
Figure 3.16. Effect of cell lysate on RT-PCR ... 48
Figure 4.1. Schematic of method for parallel single-cell RT-PCR reactions in nanowells ... 55
Figure 4.2. Detection of mRNA transcripts of constitutively expressed genes in 4D20 cells ... 56
Figure 4.3. Integrated single-cell analysis of gene expression and secreted antibodies from human B cell hybridomas ... 57
Figure 5.1. Histograms of surface marker fluorescence on PBMCs ... 61
Figure 5.2. Comparison between flow cytometry and microscopy for T-cell classification ... 61
Figure 5.3. Effect of 10x activation conditions on HIVgag and cell viability in ACH2 cells ... 62
10
Figure 5.5. Comparison of 1x TNFa and 10x TNFa activations on ACH2 in nanowells ... 65
Figure 5.6. Effect of activation time on ACH2 in nanowells ... 65
Figure 5.7. RT-qPCR on bulk cells from HIV-positive sample ... 69
Figure 6.1. Schematic of mRNA capture on a glass surface ... 74
Figure 6.2. Sample scans of B2M cDNA (FAM, left) and KanR cDNA (HEX, right) ... 75
Figure 6.3. Images of swapping dyes in two sets of probes ... 77
Figure 6.4. Captured cDNA on glass from unlabeled mutPGK1 ... 77
Figure 6.5. Comparison of HCR with direct detection in 4D20 cells ... 79
Figure 6.6. Combination of two sets of HCR to detect single nucleotide polymorphism ... 79
11
List of Tables
Table 2.1 Primer and probe design for RT-PCR... 22
Table 2.2 Sequences of initiator and hairpin for HCR. ... 28
Table 3.1 List of tested RT-PCR lysis conditions. ... 41
Table 5.1 Surface markers for PBMC classification ... 59
Table 5.2 Effect of activation conditions on ACH2 cell detection by RT-PCR in nanowells ... 64
Table 5.3 Detection of serial dilutions of ACH2 cells in nanowells ... 66
13
Introduction
1.1. Human immunodeficiency virus
The United Nations estimates that over 35 million people are afflicted with HIV/AIDS in the world and almost 1% of the world’s supposedly healthy population (ages 15-49) is infected1. With the availability of drugs and more awareness on the transmission of the disease, the number of deaths caused by HIV and the number of new infections have dropped over the past decade1. Highly active antiretroviral treatments (HAART) that use a combination of drugs to target the virus at different stages of its life cycle are effective at reducing the HIV plasma levels below levels detectable by the most sensitive clinical assays available (limit of detection of 50 copies/mL) in 3-4 weeks. While HAART is very effective, it is expensive and has known side effects2, 3. The virus is also known to develop resistance if HAART regimen is not strictly followed4. However, upon termination of HAART, HIV RNA transcripts are measurable in the blood after 2-3 weeks5-8, demonstrating that HAART is not curative. This relapse is attributed to the presence of a reservoir of latently infected cells, such as resting CD4+ T-cells9, 10, monocytes and dendritic cells11, that are not responsive to HAART. Typically, activated CD4+ T-cells that are infected will undergo apoptosis, but in latently infected cells, the life cycle of the virus is interrupted by cellular factors, such as the histone deacetylation and methylation of HIV long terminal repeat (LTR)12. The latent reservoir in resting memory CD4+ T-cells has been estimated to decay with a half-life of as long as 44 months13, thus maintaining a long-lived latently infected population and hindering the eradication of HIV14. Therefore, research on the identification and eradication of these latent reservoirs has been pursued as a strategy in HIV treatment. Gene
14
therapy using Tre recombinase, which is an evolved Cre recombinase, has been shown to excise proviral DNA from the integrated host genome15. Its effect on latently infected cells have not been tested yet16. Recently, the discovery of a population of replication competent proviruses that were not induced by potent reactivation conditions in vitro further complicates the eradication of latently positive cells17.
The gold standard for studying latency is the extraction of resting CD4+ T-cells from a person on HAART. However, the frequency of these latently infected cells are 1 in a million18, so deep mechanistic studies would not be feasible on only these cells. Latently infected primary CD4+ T-cells can be made in a variety of methods19, 20, but these cells often require a long time to culture19, 20. Latently infected cell lines such as ACH2 do exist and are commonly used to model the phenomenon21. While cell lines are convenient to work with, some biologically relevant limitations to their use exist, such as the cell line is a clonal population with the same integration site, the integration sites are often in transcriptionally inactive regions of the genome22 while the integration sites in resting CD4+ T-cells were in actively transcribed regions23-25, and the cell line grows very quickly whereas latently infected T-cells are resting in vivo18.
1.2. Existing tools to detect HIV-infected cells
The standard method to measure the size of the latent reservoir is a viral outgrowth assay26, 27. Latent infections are identified using a population of highly purified resting T-cells28. These cells are often taken from patients on HAART since HIV levels in their blood are below the level of detection. The purification process removes, by flow cytometry, cells with markers of various stages of activation such as CD69, CD25, and HLA-DR. To demonstrate that latent
15
infections exist in the population, the purified cells are stimulated with phytohemagglutinin (PHA)29, gamma-irradiated virus-free PBMCs29, or cross-linking anti-CD3 antibodies and the newly produced virions can be detected5. Since activation of all T-cells is highly toxic30, 31, some recent reactivation agents that have been investigated are more specific to the reactivation of latent proviruses. These small molecules include histone deacetylase inhibitors (HDACi) such as valproic acid, vorinostat, givinostat, belinostat, and panobinostat32-34, disulfiram35, prostratin36-38, and bryostatin39. Valproic acid has had inconsistent results on the reduction of latent reservoirs in vivo40, 41.
To verify that the population contains cells with integrated HIV genome, several assays digest the host genomic DNA with a specific restriction enzyme. Then, the digests are diluted so that intramolecular ligation is dominant. In Alu polymerase chain reaction (PCR), one primer binding Alu repeat elements, which are interspersed throughout the genome, and another primer specific for HIV are used to amplify the integrated DNA18. Common integration sites can be sequenced by using inverse PCR where the region flanking the HIV genome is amplified42, 43. While these digestion assays only detect integrated HIV proviral DNA, they have varying efficiencies because the viral DNA integrates at different locations, so the lengths of the amplified sequences vary.
Although the presence of integrated HIV genome is necessary for identifying latency, it is not sufficient. Not all integrated HIV genomes produce replication-competent virus after activation. Deleterious mutations in the reverse transcription and integration into silenced regions of the host genome may result in the lack of competent virus production42. Identifying integrated HIV genome and producing competent HIV virions following stimulation cannot, however, be
16
both applied to the same population. Stimulated cells will produce virus that can infect and integrate into uninfected cells so it is unclear if the integrated HIV was from previously infected or newly infected cells, and the process of detecting integrated HIV genome requires killing the cell, which would prevent their stimulation.
Monie et al. devised a method that can partially bypass the conflicting tests44. Resting T-cells were cultured in the presence of drugs that block the reverse transcription (RT) of HIV mRNA to DNA and the integration of HIV DNA into the host genome. After stimulation, the newly produced virions that bud from latently infected cells can infect other cells, but the drugs prevent the integration of virus genome into the host. Finally, to avoid the varying transcript length of Alu PCR, HIV RNA from the media can be analyzed by RT-PCR primers specific to HIV mRNA. While this assay can detect latently infected population of cells, no assay that can detect latency in single cells exists.
1.3. Amplification and detection techniques
The detection of transcribed genes often uses reverse transcription (RT) polymerase chain reaction (PCR) to convert mRNA into many copies of cDNA. This reaction can amplify many specific transcripts from single cells—usually sorted into microtiter plates by flow cytometry or micromanipulation—to recover particular genes of interest or to quantify the amount of mRNA present45. Traditional assays for studying genetic and proteomic responses to applied external stimuli typically require more than 1000 cells for each analysis46, 47. The resulting average measures, however, obscure variations that may exist among individual cells, especially rare cells, and can lead to misinterpretations of the biology48, 49. Using conventional plates is also labor-intensive and costly for analyzing a statistically robust numbers of single cells.
17
Miniaturized systems have been developed that use actuated microfluidic systems50, microdroplets of water-in-oil emulsions51-54, and arrays of microwells55-58 to define individual PCR reactions requiring only femtoliters to nanoliters of reagents to reduce cost. These approaches can also increase the efficiency of amplifying limited numbers of templates. On-chip RT-PCR reactions have been demonstrated for amplifying isolated mRNA59, 60 or small numbers of individual cells61, 62. Other techniques to amplify and detect weak signals also exist for targets such as proteins, microRNA, mRNA, and DNA. They include fluorescent in situ hybridization
63-65
, hybridization chain reaction66-70, and other isothermal catalytic amplification71-75. These assays have very good limit of detection (as low as 1 fM), but are generally still performed on a bulk sample of cells or tissue.
To establish a single-cell methodology for detecting latent infection, RT-PCR must be efficient in picoliter volumes. It has been demonstrated that 72 parallel PCR reactions in 450 pL volumes on a microfluidic chip was possible50 and this number has expanded to 96 single cell samples by the Fluidigm Dynamic Array76. Real time RT-PCR has also been done in 1241 oil droplets with volume 70 pL containing viral RNA77. Using a modified PCR reaction, the 454 sequencing in 75 pL silicon wells has sequenced about one million transcripts on beads55, 78. Digital PCR reactions have been shown to amplify single copies of DNA in volumes as small as 36 femtoliters using PDMS58. It has also been used as a more sensitive alternative to qPCR for detecting HIV DNA in a bulk population54. Finally, RT-PCR has been performed directly from single cells without purifying the mRNA in 20 microliter volumes79. No technology, however, combines all of these techniques into one-step, high-throughput, single-cell RT-PCR in picoliter volumes.
18
1.4. Objectives and outline of thesis
The objectives of this thesis were to establish a RT-PCR technique to detect the presence of target genes in single cells using the array of nanowells as individual containers. By using these nanowells, we would be able to identify which single cells were infected with HIV-1 and interrogate its surface markers to determine its cellular lineage. Since the assay was developed in nanowells, we could also use other processes such as microengraving to link more information on a single cell. With this knowledge, we would be able to identify better cellular targets for possible eradication of the disease. The specific aims of my doctoral thesis were the following:
1. Develop a new technique for the detection of mRNA transcripts from single cells using RT-PCR reactions in nanowells for high-throughput screening.
2. Develop and optimize a multiplexed assay for detecting multiple DNA transcripts produced by single cells.
3. Detect the production of virus in infected cells and determine the frequency and identity of those cells.
Chapter 2 of the dissertation discusses the materials and methods used to develop and validate the assay for detecting genetic transcripts in cells. Chapter 3 focuses on the optimization of RT-PCR in nanowells. Chapter 4 uses the methods developed in Chapter 3 on single cells to determine sensitivity and specificity and demonstrate the integration with other nanowell assays. Chapter 5 uses RT-PCR to detect HIV in a cell line and HIV-positive patient. Chapter 6 discusses other methods that were considered for detecting rare transcripts. Finally, Chapter 7 contains a summary of the results and potential future directions for this work.
19
Chapter 2. Materials and Methods
2.1. Cell line culture
Epstein-Barr virus transformed human hybridoma 4D20 was a generous gift from James Crowe (Vanderbilt University). The 4D20 cell line produces an IgG1 antibody against the 1918 H1N1 influenza virus. Cells were cultured as a suspension in R15 medium composed of RPMI 1640 (Mediatech) supplemented with 15% fetal bovine serum (PAA Laboratories), 2 mM L-glutamine (Mediatech), and 1x Penicillin-Streptomycin (Mediatech). The cell line was maintained in 25 mm2 canted-neck flasks (BD Falcon) in 5% CO2 at 37 °C and was split twice a
week to 2.5x10⁵ cells/mL.
The ACH2 cell line, a T-cell clone with one integrated copy of HIV-1, was obtained through the NIH AIDS Reagent Program, Division of AIDS, NIAID, NIH from Dr. Thomas Folks. These cells were cultured as a suspension in the same manner as the 4D20 cell line. ACH2 cells were split twice a week to 1x10⁶ cells/mL.
The mutant phosphoglycerate kinase 1 (PGK1) cell line was purchased from the Coriell Institute (GM14889). These cells were an Epstein-Barr virus transformed B-lymphocyte that contains a nucleoside base change of A491 (normal) to T491 (mutant) at position 491 in the PGK1 gene and produces the amino acid substitution D163V. These cells were cultured as a suspension in the same manner as the 4D20 cell line and were split twice a week to a ratio of 1:3.
20
2.2. Fabrication of array of nanowells
Silicon masters for 50 x 50 x 50 μm3 wells were produced by photolithography (Stanford Microfluidics Foundry or Georgia Institute of Technology). Each chip fits on a standard glass slide (75 x 25 mm2, Corning) occupying approximately the center 60 x 22 mm2. Several types of designs were used: the normal field of view (NFOV) array has 72 x 24 blocks of 7 x 7 wells and the large field of view (LFOV) array has 43 x 14 blocks of 11 x 11 or 12 x 12 wells. A channel was included to facilitate liquid removal by aspiration from the device and to act as a liquid reservoir as water is lost into the polydimethylsiloxane (PDMS) during thermocycling. For the NFOV, every 4 x 4 block was surrounded by channels, and for the LFOV, every block was surrounded by channels. PDMS (Sylgard 184 Silicone Elastomer Kit, Dow Corning) or RTV615 (Momentive) was vigorously mixed at a mass ratio of 10:1 elastomer base to curing agent and deaerated for 20 min under vacuum for Sylgard 184 or at least 1 hr for RTV615. Before the first use, the injection mold and the silicon master were placed under vacuum with a glass vial containing a few drops of trichloro(1H,1H,2H,2H-perfluorooctyl)silane (Sigma), and baked the next day at 80 °C for 2 hr. Approximately 5 mL of PDMS was slowly injected into the mold so that the final device has a thickness of 1 mm and was attached to a pre-cleaned standard glass slide. The injection mold was then cured for 2 hr at 80 °C. The arrays were removed from the mold while hot, and scotch tape (Staples) was applied to seal the wells so that dust did not fall into the wells. The arrays continued to cure in this manner at room temperature until they were used (usually more than a week). The glass backs of the arrays were further cleaned with ethanol, hexane, or acetone before use.
21
2.3. Cytometry and imaging
For cell surface marker staining, peripheral blood mononucleated cells (PBMCs) were thawed from -196 °C in 37 °C R15. PBMCs were then washed twice with R15, counted with a hemacytometer, and rested in the 37 °C incubator for at least one hour. After resting, the cells were labeled with a set of surface marker antibodies (1:1000 dilution for each antibody) for either CD3+ or CD3– cells with a cell viability marker (1 nM calcein violet AM, Life Technologies). The CD3+ panel contained CD4 Alexa Fluor 568 (Biolegend), CCR7 PE/Cy7 (Biolegend), CD45RA Alexa Fluor 647 (Biolegend), CD122 PerCP-eFluor 710 (eBioscience), and CD95 Alexa Fluor 488 (Biolegend). The CD3– panel contained CD4 Alexa Fluor 568, HLA-DR PE/Cy7 (Biolegend), CD14 Alexa Fluor 647 (Biolegend), and CD11c Alexa Fluor 488 (Biolegend). For only staining cell viability, the cells (e.g., 4D20 and ACH2) were washed once with PBS and stained with 1 nM calcein violet AM or 1 nM CellTracker Violet (Life Technologies). After labeling for 30 min at 37 °C, the cells were washed once with PBS, loaded into nanowells, and imaged on an epifluorescent microscope (Observer.Z1, Carl Zeiss GmbH) at 10x magnification (Objective EC “Plan-Neofluar” 10x/0.3, Carl Zeiss GmbH). A broad spectrum light source was produced by a xenon lamp in a Lambda DG-4 (Sutter Instrument) and passed through a “Pinkel” quad-band filter set (Semrock) for specific excitation bandwidths. Emissions were filtered by a specific emission filters (Semrock) in a filter wheel (Lambda 10-3, Sutter Instrument) just before image collection by an EM-CCD camera (C9100-13, Hamamatsu Photonics). The entire system was controlled using the software AxioVision version 4.7 (Carl Zeiss GmbH). The time settings were 100 ms exposure for each fluorescent channel at 100 EMCCD gain.
22
2.4. One-step reverse transcription polymerase chain reaction (RT-PCR)
2.4.1. Primer and TaqMan probe selection
Primers and dual-labeled TaqMan probes for housekeeping genes were designed using the online software RealTimeDesign (Biosearch Technologies). Some of the design criteria were intron spanning primers and probes to eliminate genomic DNA amplification, 55 °C melting temperature for primers and 60 °C for probes, probes did not start with 5’ G because of quenching, amplicon length of 90-200 base pairs, and 3’ end with G or C. The primer and probe
Table 2.1 Primer and probe design for RT-PCR.
Name Sequence (5'->3') Tm (°C)
B2M forward TCCAGCGTACTCCAAAGATTCAG 56.7
B2M reverse GAAACCCAGACACATAGCAATTCAG 56.1
B2M probe FAM-CTCACGTCATCCAGCAGAGAATGGA-BHQ1 60.3
GAPDH forward TTGCCCTCAACGACCACTTTG 58.1
GAPDH reverse GAGGTCCACCACCCTGTT 57.0
GAPDH probe FAM-TCCTGGTATGACAACGAATTTGGCTACA-BHQ1 59.8
ACTB forward GATGCAGAAGGAGATCACTGC 55.6
ACTB reverse GCCGATCCACACGGAGTA 56.9
ACTB probe FAM-CAAGATCATTGCTCCTCCTGAGCGC-BHQ1 61.7
4D20 Heavy Chain for. GGTCCTGTGCTGGTGAAAC 56.3
4D20 Heavy Chain rev. GCTCACACCCATTCTATCATTG 53.7
4D20 Heavy Chain probe Q670-CACAGAGACCCTCACGGTGACCT-BHQ2 62.4
HIVgag forward CATGTTTTCAGCATTATCAGAAGGA 53.6
HIVgag reverse TGCTTGATGTCCCCCCACT 59.0
HIVgag Q670 probe Q670-CCACCCCACAAGATTTAAACACCATGCTAA-BHQ2 60.7
HIVgag FAM probe FAM-CCACCCCACAAGATTTAAACACCATGCTAA-BHQ1 60.7
HIV 1LTR forward TTAAGCCTCAATAAAGCTTGCC 53.6
HIV 1LTR reverse GTTCGGGCGCCACTGCTAGA 62.4
HIV 1LTR probe Q670-CCAGAGTCACACAACAGAGGGGCA-BHQ2 62.8
HIV 2LTR forward CTAACTAGGGAACCCACTGCT 56.1
HIV 2LTR reverse GTAGTTCTGCCAATCAGGGAAG 55.4
23
sequences (Biosearch Technologies) are shown in Table 2.1. All HIV primer and probe sequences were given to us by our collaborators from the Xu lab in the Ragon Institute. We used 6-carboxyfluorescein (FAM) and Quasar® 670 (Q670) with their respective quenchers, Black Hole Quencher™ 1 (BHQ1) and BHQ2, as the two channels for the probes. The primers and probes were reconstituted in 1x TE buffer (10 mM Tris, pH 8.0, 1 mM EDTA) to a stock concentration of 100 μM. Probes for short-term use were further diluted to 2 μM in water. To minimize the number of freeze-thaw cycles, each aliquot of short-term use probe and 4x master mix were for a total reaction mix of four 80 μL reactions. All primers, probes, and 4x master mix solutions were stored at -20 °C.
2.4.2. Imaging end-point RT-PCR signal
Cells were split the day before their use in experiments. For cell labeling, the cells were first washed once with phosphate buffered saline (PBS, Mediatech), then resuspended in 1 mL PBS with 1 μL of the labeling dye (CellTracker Violet BMQC or calcein violet AM, Life Technologies) according to the manufacturer’s recommended concentration. Labeling was carried out at 37 °C for 30 min. Cells with high-viability were isolated with Ficoll-Paque Plus (GE Healthcare Biosciences) and then treated with 30 μg/mL bovine pancreatic RNase A (Sigma-Aldrich) at 37 °C for 30 min. The cells were then washed three times with 10% FBS in RPMI and once with PBS before they were resuspended in 5 mL PBS. After these steps, more than 98% of the cells remained viable as determined by the cellular exclusion of trypan blue (Life Technologies). Each array of nanowells was cleaned by a 30 s plasma treatment (Plasma Cleaner PDC-32G, Harrick Plasma) and blocked in 0.5% BSA in PBS for 30 min at room
24
temperature before loaded with cells by gravity such that about 50% of the wells had cells in them.
The reaction mix used the qScript One-Step Fast qRT-PCR kit with ROX (Quanta Biosciences). It contained 1x One-Step Fast Master Mix with ROX, 1 μM of each primer, 200 nM of each probe, 1x qScript One-Step Fast RT, 80 U of SUPERase-In RNase Inhibitor (Life Technologies), and 0.05% NP-40 (Tergitol, Sigma) in a total volume of 40-80 μL per array. The final NP-40 concentration was later increased to 0.5% to lyse the cells more effectively. Before adding the reaction mix, the array was washed with 1x Tris-buffered solution (TBS, 20 mM Tris, pH 7.5, 150 mM NaCl) and quickly rinsed with 0.5x TBS or water. The reaction mix was applied to the nanowells and spread using a pipet tip before the device was sealed onto another glass slide. Excess reaction mixture was removed along the sides and the entire device was placed on an Eppendorf Mastercycler Gradient (Eppendorf) with a glass slide adaptor (in situ Adapter, Eppendorf). Mineral oil (Sigma) was added to improve the heat conductivity between the adaptor and the device. The thermocycle profile was initially 40 min at 50 °C, 2 min at 95 °C, 12 cycles of 40 s at 95 °C and 1 min at 65 °C, and 38 cycles of 40 s at 95 °C and 1 min at 60 °C, with the lid maintained at 50 °C. It was common to observe dried wells and warped wells (pincushion distortion) around the perimeter of the array. The array also became cloudy from the penetration of water into the PDMS. The use of RTV615 instead of Sylgard 184 as the silicone reduced the number of dried wells almost completely (>98% usable array) and the thermocycles were later reduced to 15 min at 50 °C, 2 min at 95 °C, 35 cycles of 40 s at 95 °C and 1 min at 60 °C.
25
2.4.3. Quantitative TaqMan RT-PCR
Quantitative TaqMan RT-PCR (RT-qPCR) was run on LightCycler 480 (Roche). The same thermocycles were used in RT-qPCR as in the nanowell RT-PCR. Each reaction had a final volume of 20 μL in a clear, LightCycler-specific, 96-well plate (Roche). The cycle numbers that exceeded the threshold intensity (Ct) were calculated with the built-in analysis module. The final
PCR products were also imaged on 2% agarose gel with ethidium bromide to verify amplicon length. The desired DNA band was cut from the gel and purified with a QIAquick gel purification kit (Qiagen) for digital PCR in nanowells. The purified DNA concentration was measured by forming a column with 1.5 μL of DNA on a NanoDrop 1000 spectrometer (NanoDrop).
2.4.4. Digital PCR in nanowells
Serial dilutions of purified DNA (e.g., HIVgag PCR product) were made and 1 μL of each dilution was added to 80 μL of reaction mix. The reaction mix contained the primer and probe set for the desired DNA template as well as the primer and probe set for a negative gene (e.g., ACTB) in a separate channel as a negative control. The nanowell arrays were treated as normal (e.g., plasma cleaning and blocking) and rinsed in water for the final step before adding the reaction mix.
2.5. Microengraving
Detailed procedures for microengraving can be found in Ogunniyi et al. Nature Protocols (2009) vol. 4 (5) pp. 767-82. Briefly, cells were labeled for cell viability (CellTracker violet), loaded into the nanowells, and imaged. The nanowells were then sealed with a glass slide that
26
was functionalized with anti-IgG1 antibodies at 37 °C. After 2 hr, the glass slide was separated from the nanowells and the captured IgG1 was detected following the application of a secondary, goat anti-human IgG1 antibody conjugated with Alexa Fluor 647 (Life Technologies).
Data from the microscopy, microengraving, and RT-PCR were collected and filtered. Only wells that contained a single live cell initially, and had a single cell after RT-PCR (detected by non-specific staining with the reference dye, ROX) were tabulated. Spots on the microarray generated by microengraving that had a signal-to-noise ratio greater than 2 for more than 55% of its pixels and a coefficient of variation less than 80 were considered positive for IgG1 secretion.
2.6. Surface capture of transcripts
One method to capture transcripts on glass slides was to use amine-epoxy linkage. Glass slides were cleaned with 2.5 M sodium hydroxide (NaOH) in 60% ethanol (EtOH) for 2 hours and reacted in a 0.1% (3-glycidoxypropyl)trimethoxysilane in 100% EtOH supplemented with traces of glacial acetic acid as an acid catalyst for 2 hours at 40 °C. The slides were washed twice with 100% EtOH and baked at 120 °C overnight to remove residual water. One surface of the epoxy slides was then reacted with the primer mix conjugated with a 5’ amine-C9 group in 0.15
M NaOH at 80 °C for 2 hours. The free epoxy groups were washed and blocked with 0.2 M Tris and 0.1% sodium dodecyl sulfate (SDS) at 50 °C for 4 hours before the primer-conjugated glass were ready.
Another method to attach transcripts to surfaces (e.g., PDMS or glass slide) was to use oligonucleotides with a 5’ amine group linked to amine groups on the surface by p-phenylene diisothiocyanate (PDITC)80. To functionalize the PDMS with amine groups, the array of nanowells was plasma treated for 5 minutes and then placed in a 10%
(3-27
aminopropyl)triethoxysilane (APTES) in water and rocked for 1 hr at room temperature in a 4-well polystyrene dish (Nunc). After two 30 s, manual water washes, the array was dried at 80 °C, overnight. The next day, the dried array was soaked in acetone for 3 min to rewet the well surfaces, and washed in dimethylformamide (DMF) before reacting in 0.2% (w/v) PDITC in 10% (v/v) pyridine/DMF for 3 hr at room temperature. Excess PDITC was removed by two DMF washes, one methanol wash, and one 100 mM sodium bicarbonate, pH 9.0 wash. The desired amine-conjugated oligonucleotide that was reconstituted in water was diluted to 25 μM in 50 mM sodium borate, pH 8.5. This solution was reacted with the PDITC-conjugated array under a lifterslip in a humidified box. The next day, the reaction was quenched with 1x TBS for 10 min, and blocked with 0.5% BSA in PBS for 1 hr at 80 °C. After three PBS washes, the array was loaded with cells for downstream processing. Cells were loaded and lysed in MES lysis buffer (20 mM MES pH 6.0, 500 mM NaCl, 10 mM EDTA, 0.01% NP-40, 10 mM DTT).
2.7. Hybridization chain reaction
The hairpin pairs and initiator sequences for hybridization chain reaction (HCR) were modified from the sequences A, H1 and H2 from literature67. The modifications include moving blocks of bases, using the complementary sequences, and adding 9 adenosines at the end of the initiators where the oligonucleotide was attached to either an antibody (through a 3’ thio-C3 linker on the initiator) to detect a target protein or another oligonucleotide to detect a target gene. The four sets of initiator (An) and hairpins (H2n-1 and H2n) sequences (5’ to 3’) were ordered from
Integrated DNA Technologies and purified by high performance liquid chromatography (Table 2.2).
28
All HCR oligonucleotides were reconstituted to 100 μM in 1x SPSC (0.1 M sodium phosphate, 1 M sodium chloride). Each initiator and hairpin were denatured to 95 °C for 2 min, immediately placed on ice for 1 min, and kept at room temperature until used. To test the specificity of the hairpins to their initiators, each of the four initiators were diluted to 2 μM in 1x TBE buffer (90 mM Tris-borate, 2 mM EDTA, pH 8.3) and 1 μL was spotted onto a poly-L-lysine coated glass slide at different locations. A mixture of the four sets of hairpins (20 μM each) was dispensed onto the slide under a lifter slip (Electron Microscopy Sciences) for 2 hr at room temperature. The slide was washed with PBS/0.05% Tween-20 and PBS, and scanned using a Genepix 4200AL (Molecular Devices). The commercial software package Genepix Pro 6.1 was used to extract the fluorescence for each spot in each of the four channels.
2.8. Data Analysis
Images generated by automated microscopy were analyzed using custom software (Enumerator, mabanalyze, and CellProfiler). The location, the number of cells, and the
Table 2.2 Sequences of initiator and hairpin for HCR. ID Sequence (5'->3')
A1 GCA CGT CCA CGG TGT CGC TTG AAT AAA AAA AAA
H1 FAM-ATT CAA GCG ACA CCG TGG ACG TGC ACC CAC GCA CGT CCA CGG TGT CGC ACC
H2 FAM-GTT GCA CGT CCA CGG TGT CGC TTG AAT GCG ACA CCG TGG ACG TGC GTG GGT
A2 GCA GCC GTA GAC TAG TGC GCG AAT AAA AAA AAA
H3 TYE563-ATT CGC GCA CTA GTC TAC GGC TGC ACG ACC GCA GCC GTA GAC TAG TGC CAC
H4 TYE563-GTT GCA GCC GTA GAC TAG TGC GCG AAT GCA CTA GTC TAC GGC TGC GGT CGT
A3 CGT CGG CAT CTG ATC ACG CGC TTA AAA AAA AAA
H5 TYE665-TAA GCG CGT GAT CAG ATG CCG ACG TGC TGG CGT CGG CAT CTG ATC ACG GTG
H6 TYE665-CAA CGT CGG CAT CTG ATC ACG CGC TTA CGT GAT CAG ATG CCG ACG CCA GCA
A4 CGT GCA GGT GCC ACA GCG AAC TTA AAA AAA AAA
H7 TEX615-TAA GTT CGC TGT GGC ACC TGC ACG TGG GTG CGT GCA GGT GCC ACA GCG CTG
29
fluorescence intensity of each channel were tabulated in a text file. This information was filtered and plotted using MATLAB (MathWorks). The data were filtered to remove wells with more than four cells because too many cells gave inaccurate measures of the well intensity. Wells with large variation in the reference channel (greater than two standard deviations from the mean reference signal) were also removed to eliminate wells with no liquid and wells with a high degree of covariance in fluorescence. This filter was important because dividing by a low reference signal would give a relative intensity that was too high and artificially positive. This artificial positive signal was especially problematic for the FAM channel. For each block of wells, the mean gene-specific fluorescence intensity of empty wells (Iempty) was calculated and
used to determine the relative fluorescence of every well (Iwell/Iempty). A histogram was plotted to
bin the relative fluorescence intensities. The histogram peak for Iwell/Iempty of empty wells was fit
to a Gaussian curve to compute estimated values for the mean and standard deviation of negative reactions. The threshold value on the relative fluorescence for positive reactions was set to be three standard deviations above the mean. From this value (e.g., Iwell/Iempty = 1.4), the sensitivity,
specificity, and positive predictive value were determined for each gene. For the analysis of Q670 fluorescence data from HIV-infected cells, a threshold of 1.5 times the mean empty fluorescence, which corresponded to approximately 8-12 standard deviations from the mean, was used. Such a high cutoff was possible because the signal intensity from the Q670 dye was much brighter than that of the FAM dye.
31
Chapter 3. Establishing one-step RT-PCR in nanowells
3.1. Optimization of cell lysis
To test the RT-PCR efficiency in the nanowells, we used beta-2-microglobulin (B2M) as the target gene because B2M is constitutively expressed in the 4D20 cell line. B2M primers and TaqMan probes were designed to reverse transcribe bases 122 to 211 from the mature mRNA (GENBANK NM_004048). No additional steps or reagents were used to remove genomic DNA from the reaction. The signal we used to determine a positive reaction came from the digestion of a quenched TaqMan probe. If the target gene were present, the intact probe would bind to the
Figure 3.1. TaqMan probe mechanism. When the probe is intact, the emitted light by FAM is quenched by the BHQ-1. As the Taq polymerase extends the primer, its exonuclease will cut the probe, thus freeing FAM. FAM is no longer within the proper distance from BHQ-1 for quenching, so it can be detected.
32
desired gene by complementary base pairing. As the PCR progressed, the Taq enzyme would cleave the probe because it has 5’ to 3’ exonuclease capabilities (Figure 3.1). Thus, the fluorophore (e.g., FAM or Quasar 670) would no longer be at a fixed distance from the quencher and the detection of its fluorescence would be possible by epifluorescence microscopy.
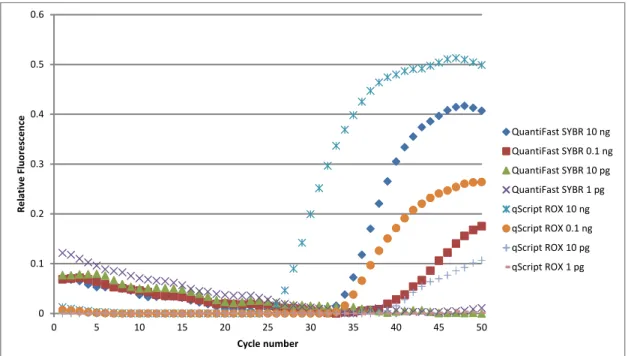
Several commercial kits were tested in tubes to identify the kit with the best efficiency for use in subsequent RT-PCR reactions. Two of kits were the qScript 1-Step Fast RT-PCR with ROX (Quanta Biosciences) and QuantiFast SYBR Green RT-PCR (Qiagen). We found that using a template HeLa mRNA, the qScript 1-Step Fast RT-PCR with ROX had the lower Ct
value (a measurement of reaction effectiveness), so it was the best at the reverse transcription of mRNA from single cells (Figure 3.2). In fact, the fluorescence profile of the 10 pg of mRNA
0 0.1 0.2 0.3 0.4 0.5 0.6 0 5 10 15 20 25 30 35 40 45 50 Rel at iv e F lu or es cen ce Cycle number QuantiFast SYBR 10 ng QuantiFast SYBR 0.1 ng QuantiFast SYBR 10 pg QuantiFast SYBR 1 pg qScript ROX 10 ng qScript ROX 0.1 ng qScript ROX 10 pg qScript ROX 1 pg
Figure 3.2. Determining the RT-qPCR kit. The 1-step Fast qScript with ROX kit was significantly better than the QuantiFast SYBR Green kit. The Ct value for qScript at 10 pg mRNA was approximately the same as the Ct value for the 0.1 ng mRNA for QuantiFast.
33
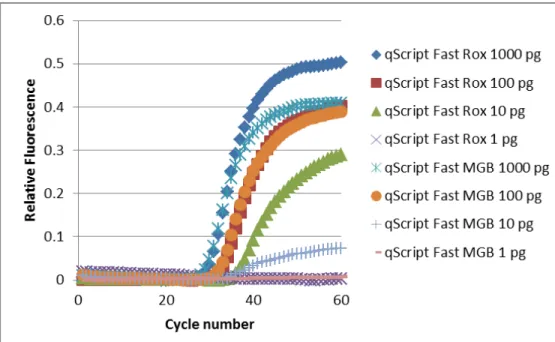
with qScript was similar to that of the 100 pg of mRNA with QuantiFast, which suggested that qScript was about 10 times more sensitive to mRNA than QuantiFast. We also tested two types of kits from Quanta Biosciences (qScript with ROX and qScript MGB). From serial dilutions of mRNA, we observed that both kits were similarly sensitive, but the qScript kit with ROX had a higher relative fluorescence than the MGB kit for the 10 pg mRNA sample (Figure 3.3). Since our target genes will be rare cellular mRNA, we chose the more sensitive detection and higher relative fluorescence kit, 1-step Fast qScript with ROX, for all future studies.
To adapt a typical multistep RT-qPCR in a PCR tube to a one-step reaction in nanowells, we added a detergent to help lyse the cells. We chose to test two non-ionic detergents, Tergitol type NP-40 (NP-40) and Tween-20, and one ionic detergent, sodium dodecyl sulfate (SDS), for their ability to help lyse cells during RT-PCR55. These detergents were commonly added in the RT-PCR kits to help stabilize the enzymes in the reaction mix. It was also important to ensure that the addition of even more detergents did not significantly hinder the reaction itself.
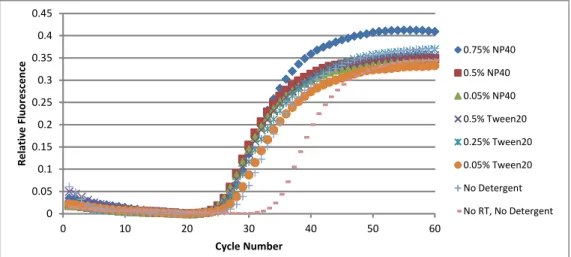
We tested an initial range of final concentrations (0.75%, 0.5%, 0.25%, 0.1%, 0.05%, 0.005% and 0%) for Tween-20 and NP-40 on reactions with 100 4D20 cells and observed that the optimal concentration for Tween-20 was 0.5% (Figure 3.4) while the optimal NP-40 concentration was approximately 0.75% (Figure 3.5). The NP-40 concentration was less clear because the two no detergent controls were not consistent. A direct comparison of 0.5%, 0.25%, and 0.05% Tween-20 to 0.75%, 0.5% and 0.05% NP-40 showed that 0.5% and 0.05% NP-40 and 0.5% Tween-20 were the best conditions (Figure 3.6). At cycle 30, 0.5% NP-40 was slightly better than the other conditions, but 0.05% NP-40 was chosen for initial tests to minimize the interference with the kit. To determine the efficiency of the RT-qPCR reaction, the logarithm
34
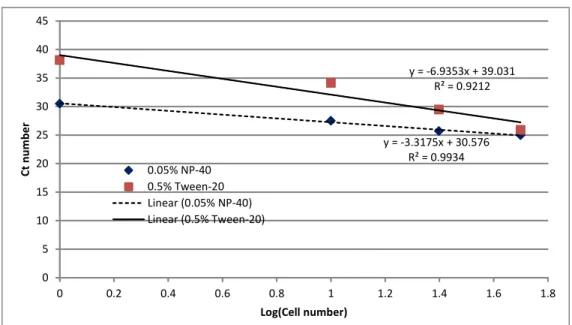
(base 10) of the cell number was plotted against the Ct value at that cell number and regressed to a linear line to determine the slope. The efficiency of the reaction, which is (10-1/slope – 1), was approximately 1.00 for 0.05% NP-40 and 0.39 for 0.5% Tween-20 (Figure 3.7). This result suggested that Tween-20 was interfering with the RT-qPCR reaction, so subsequent reactions only used NP-40 as the detergent.
These serial dilutions of detergent also revealed that amplification of genomic DNA did occur in bulk reactions (no RT controls) despite using intron-spanning primers and probes, but it required 10 more PCR cycles than the amplification of cDNA (Figure 3.6). This result further suggested that the removal of genomic DNA was unnecessary given an appropriate number of cycles.
RT-qPCR experiments with the ionic detergent SDS showed strong inhibition of the reaction at SDS concentrations greater than 0.01% (Figure 3.8). At concentrations of 0.01% and 0.005%, the SDS had a Ct value that was lower than 0.05% NP-40. These results were expected since SDS is often used to denature proteins in SDS-PAGE, so in addition to breaking up the cell more effectively than NP-40, SDS could also be denaturing the RT and Taq enzymes, thus inhibiting the reaction completely.
35
Figure 3.3. Comparison between 1-step Fast qScript with ROX and MGB. Both kits performed equally for sensitivity to mRNA. The ROX kit had a higher relative fluorescence than the MGB kit.
0 0.1 0.2 0.3 0.4 0.5 0.6 0 10 20 30 40 50 60 Rel at iv e F lu or es cen ce Cycle Number 0.75% Tween20 0.5% Tween20 0.25% Tween20 0.1% Tween20 0.05% Tween20 0.005% Tween20 0% Tween20 0% Tween20
Figure 3.4. The effect of Tween-20 on the RT-qPCR reaction on 100 cells. The optimal concentration of Tween-20 was 0.5%.
36
Figure 3.5. The effect of NP-40 on the RT-qPCR reaction on 100 cells. The optimal concentration for NP-40 was approximately 0.75%, but it was not clearly determined since the no detergent controls were not consistent.
0 0.05 0.1 0.15 0.2 0.25 0.3 0.35 0.4 0.45 0 10 20 30 40 50 60 Rel at iv e F lu or es cen ce Cycle Number 0.75% NP40 0.5% NP40 0.05% NP40 0.5% Tween20 0.25% Tween20 0.05% Tween20 No Detergent No RT, No Detergent
Figure 3.6. Direct comparison between Tween-20 and NP-40. Both 0.5% and 0.05% NP-40 were similar to 0.5% Tween-20.
37 y = -3.3175x + 30.576 R² = 0.9934 y = -6.9353x + 39.031 R² = 0.9212 0 5 10 15 20 25 30 35 40 45 0 0.2 0.4 0.6 0.8 1 1.2 1.4 1.6 1.8 Ct n umb er Log(Cell number) 0.05% NP-40 0.5% Tween-20 Linear (0.05% NP-40) Linear (0.5% Tween-20)
Figure 3.7. Efficiency of RT-qPCR with the addition of 0.05% NP-40 or 0.5% Tween-20. RT-qPCR efficiency was 1.00 for NP-40 and 0.39 for Tween-20.
0 0.1 0.2 0.3 0.4 0.5 0.6 0.7 0.8 0.9 0 10 20 30 40 50 60 Re la ti ve F luo re sc enc e Cycle Number 100, 0.005% SDS 100, 0.01% SDS 100, 0.05% SDS 100, 0.1% SDS 100, 0.5% SDS 100, 1% SDS Ct Threshold
Figure 3.8. Effect of SDS on RT-qPCR on 100 cells. SDS strongly inhibited the reaction at concentrations greater than 0.01%.
38
3.2. Optimization of RT-PCR in nanowells
When translating the reaction from a typical 20 µL tube to an array of 125 pL reactors, several additional design considerations were addressed. One extra consideration was heat conduction. The PCR machine was designed for PCR tubes with 0.2 mm thickness that fit perfectly in each well. This fit allowed direct contact of the wall of the tube with the metal heat conductor. For RT-PCR in nanowells, a metal adaptor for glass slides was fitted to the 96-well format. Also, the glass slide was approximately 1 mm thick, compared to the 0.19 mm thickness of the PCR tube. To ensure good thermal contact, 20-30 µL of mineral oil was added between the glass and the metal adaptor. The thermal conductivity of water, glass, mineral oil, and PDMS are on the order of 0.1 to 1 W/mK. A COMSOL Multiphysics model for heat conduction through the glass slide from 60 °C to 95 °C showed that by 5 s, the glass slide and liquid in the nanowells would reach the desired temperature (Figure 3.9). To be more conservative, an additional 10 seconds were added to every step of the thermocycle to allow the temperature to equilibrate. Although the kit could be run at “fast” cycling profile with shorter denaturing and extension steps, we opted for the normal length.
Another concern for the RT-PCR in nanowells was that the size of the wells would increase the concentration of cellular RNase as well as the total surface of the array. Due to the small reactor volume, RNase concentrations increased dramatically compared to large tube reactions, so SUPERase In, an RNase inhibitor, was added to the reaction mix. To reduce the non-specific adhesion of enzymes to the walls of the nanowells, the PDMS and the glass slide were blocked with bovine serum albumin (BSA). Initial tests also included 0.5% BSA in the reaction mixture to further reduce non-specific binding, but this additive was not necessary.
39
3.3. Optimization of pre-treatment of cells
Methanol, water and thermal treatments were tested for the most efficient method to lyse cells in nanowells. Methanol was chosen as a protocol to fix the cells and help reduce the activity of RNase and DNase. Water was effective at lysing cells since it is hypotonic compared to the cellular cytoplasm. Initial data showed that treating cells with pre-cooled methanol (-20 °C) for 10 min after the cells were loaded, quickly using water as a hypotonic lysis before adding the reaction mixture, and adding a heat lysis step at 50 °C for 30 min with reverse transcription resulted in 80% positive reactions (Table 3.1). However, 40% of empty wells were also bright. These false positives were postulated to be from mRNA contamination from the supernatant of
Figure 3.9. Temperature model for an increase in temperature from 60 °C to 95 °C after 5 seconds. This model showed that in 5 seconds, the temperature profile of the glass slide and thin water (e.g., liquid in the nanowells) had raised to 94 °C.
40
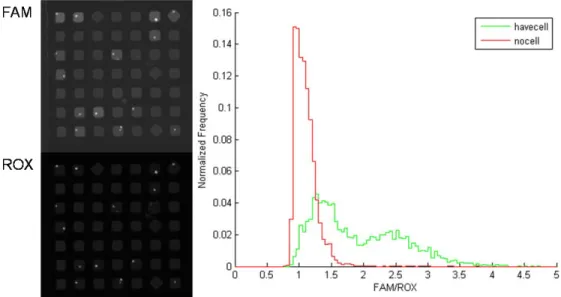
the cell suspension. To test this hypothesis, the cell suspension was treated with RNase A for 30 min at 37 °C and washed 3 times to remove the RNase A before the cells were loaded onto the array. Using RNase A that was DNase-free, we saw near complete elimination of the false positive signal (Figure 3.10). Therefore, all future reactions had a pretreatment step for the cell suspension to digest any free mRNA in the supernatant. Interestingly, using RNase that was not
labeled as DNase-free had a FAM/ROX ratio of approximately 3 in every well (data not shown). This minor difference showed that DNase was not inhibited during the reaction and that the maximum signal from FAM was approximately 3. Adding DNase to the master mix also verified these results. Other pretreatment steps that were required were the quick wash with water before applying the reaction mixture to help burst the cells open. The methanol treatment of the cells, however, did not improve the percent of true positives in wells with cells.
Figure 3.10. Removal of false positives by RNase, DNase-free treatment. The histogram on the right show that most wells with no cells had a FAM/ROX less than 2 (cutoff for positive signal), while wells with cells did have specific positive signal.
41 Table 3.1 List of tested RT-PCR lysis conditions.
Lysis conditions Fraction of bright wells
Parameter Methanol Detergent Water lysis RT # of cycles Empty Occupied
Base case
Yes Yes Yes Yes 50 0.3853 0.8131
Yes No Yes Yes 50 0.3832 0.8098
Yes Yes Yes No 50 0.0123 0.0492
Yes No Yes No 50 0.0102 0.0375
Positive control Yes Yes Yes Yes 50 0.4536 0.8194
No detergent Yes No Yes Yes 50 0.4062 0.6758
No probe Yes Yes Yes Yes 50 0.0001 0
No primer Yes Yes Yes Yes 50 0.0003 0.0008
40 Cycle
Yes Yes Yes Yes 40 0.1509 0.421
Yes No Yes Yes 40 0.1188 0.3899
Yes Yes Yes No 40 0.0077 0.0335
Yes No Yes No 40 0.0103 0.037
No methanol
No Yes Yes Yes 40 0.4355 0.7955
No No Yes Yes 40 0.5229 0.8088
No Yes Yes No 40 0.0043 0.0745
No No Yes No 40 0.0253 0.1876
Quick water rinse
Yes Yes Yes Yes 50 0.4724 0.7876
Yes No Yes Yes 50 0.2811 0.5679
Yes Yes No Yes 50 0.0001 0
42
3.4. Optimization of thermocycling
One of the concerns with running too many thermocycles was that the bulk RT-qPCR on cells showed positive fluorescence at 10 cycles later in the sample with no reverse transcriptase added than in samples with the RT enzyme. This result indicated that genomic DNA would be amplified given enough cycles. To determine how many cycles were needed, we first ran digital PCR with HIVgag PCR product as the template on the array and started with 50 or 70 cycles. These experiments used a serial dilution of the HIVgag DNA ranging from an average input number of DNA of 8 copies/well to 0.125 copies/well (Figure 3.11). Even though 70 cycles were run, the fluorescence intensity did not increase significantly compared to the 50 cycles. This lack of increase in the signal further showed that we could attain a maximum signal in the nanowells at an optimal cycle number. The variability in the positive signal did not disappear with more cycles, so it suggested that the variability was innate to the system. One cause for the fluctuation in positive signal could be the distribution of probe in each well.
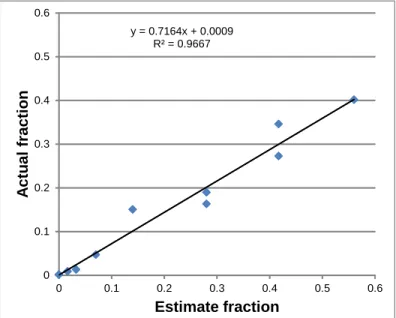
Several assumptions were made to estimate the fraction of wells that should be positive. Considering that the nanowells were initially filled with water and assuming that the limit of detection for DNA was 1 copy per well, the estimated fraction of bright wells in the array was diluted by a factor of approximately 0.14 or a positive fraction of 1.12 (i.e., 1) to 0.0175. Plotting this estimated fraction with the actual fraction of bright wells, the limit of detection was determined to be approximately 1.4 copies instead of 1 copy per well (Figure 3.12). This number of transcripts in a 125 pL volume corresponded to a concentration of 18.6 fM.
To determine the optimal cycle number, we added enough HIVgag DNA (100 fold more than 0.4 estimated fraction) to the array so that every well would be bright. We also included the
43
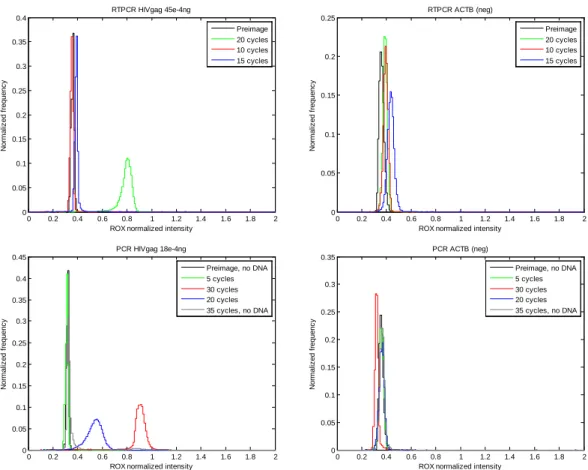
ACTB or GAPDH primers and probe as a negative control. Plotting the histogram of the relative intensities showed that at 15 cycles, the fluorescence was just barely above the negative peak. By cycle 20, the fluorescence was twice the negative peak, and by 30 cycles, the fluorescence was approximately 3 times the negative peak (Figure 3.13). Interestingly, the no DNA control at 35 cycles had a small positive peak, but the mean of this peak was not higher than that of the 30 cycles. This false positive showed that there was some HIVgag contamination in the negative control and that 30 cycles were enough for a maximum fluorescence signal of 3 times the negative peak. Note that theoretical calculations on the perfectly efficient amplification of 1 molecule of DNA showed that 24 cycles were needed to exceed the concentration of 200 nM probe. Since we added enough DNA for approximately 40-80 copies per well, the 30 cycles would correspond to about 35-37 cycles for the detection of single copy of DNA. Therefore, all future experiments used 35 cycles.
44
Figure 3.11. Sample images of digital PCR on a serial dilution of HIVgag DNA. From the top to bottom, then left to right, the average input DNA number per well was 8, 4, 2, 1, 0.5, and 0 copies. These input values corresponded to a fraction of bright wells of 1.12 (i.e., 1), 0.56, 0.28, 0.14, 0.07, and 0. y = 0.7164x + 0.0009 R² = 0.9667 0 0.1 0.2 0.3 0.4 0.5 0.6 0 0.1 0.2 0.3 0.4 0.5 0.6 A c tu al f ra c ti o n Estimate fraction
Figure 3.12. Limit of detection for PCR. The limit of detection was 1/slope or approximately 1.4 copies of DNA.
45 0 0.2 0.4 0.6 0.8 1 1.2 1.4 1.6 1.8 2 0 0.05 0.1 0.15 0.2 0.25 0.3 0.35 0.4 RTPCR HIVgag 45e-4ng
ROX normalized intensity
N or m al iz ed f requenc y Preimage 20 cycles 10 cycles 15 cycles 0 0.2 0.4 0.6 0.8 1 1.2 1.4 1.6 1.8 2 0 0.05 0.1 0.15 0.2 0.25 RTPCR ACTB (neg)
ROX normalized intensity
N or m al iz ed f requenc y Preimage 20 cycles 10 cycles 15 cycles 0 0.2 0.4 0.6 0.8 1 1.2 1.4 1.6 1.8 2 0 0.05 0.1 0.15 0.2 0.25 0.3 0.35 0.4 0.45 PCR HIVgag 18e-4ng
ROX normalized intensity
N or m al iz ed f requenc y Preimage, no DNA 5 cycles 30 cycles 20 cycles 35 cycles, no DNA 0 0.2 0.4 0.6 0.8 1 1.2 1.4 1.6 1.8 2 0 0.05 0.1 0.15 0.2 0.25 0.3 0.35 PCR ACTB (neg)
ROX normalized intensity
N or m al iz ed f requenc y Preimage, no DNA 5 cycles 30 cycles 20 cycles 35 cycles, no DNA
Figure 3.13. Various cycle numbers for PCR on HIVgag DNA. The progression of signal can be seen over the number of cycles. After 20 cycles, the fluorescence
intensity was approximately twice that of the preimage (0 cycle), and after 30 cycles, it was approximately 3 times that of the preimage. Note that 35 cycles, no DNA had some contaminating DNA in it, but its fluorescence was not greater than that of the 30 cycles.
46
3.4. Discussion
3.4.1. Limit of detection of transcripts
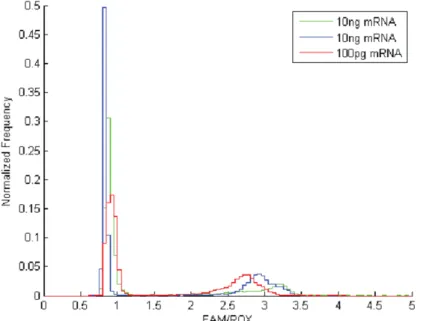
Although we had shown that the assay could detect a few copies of DNA, it was not clear what the limit of detection of mRNA was. In a control experiment with diluted standards of cell-free mRNA bound to oligo-dT beads, we were able to detect positive reactions from the beads (Figure 3.14). However, the number of copies of the mRNA on the beads and in bulk could not be measured accurately. Similar to digital PCR, mRNA could be detected in nanowells (Figure 3.15), but the exact number of B2M mRNA could not be determined. Although this result cannot be compared directly to conditions in which residual components of the lysed cell remain, it would suggest that nanowell-based RT-PCR allows for detection of small quantities of mRNA.
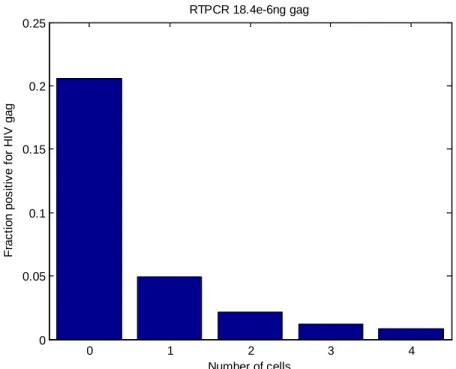
To more accurately determine the limit of detection, cells were added to the digital PCR. This addition simulated the effect of cellular lysate on the detection of DNA in nanowells. RT-PCR mixture was spiked with HIVgag DNA to have approximately 20% positive wells, and 4D20 cells (HIV negative) were loaded in the nanowells at high density so that the cell occupancy was from 0 to 4 or more cells (Figure 3.16). Wells with no cells had the expected 20% of bright wells, but if a well had cells, the fraction of bright wells dropped. From 0 to 1 cell, the drop was 4-fold, with another 4-fold decrease from 1 cell to 4 or more cells. Since the DNA was randomly distributed onto the array, the expectation was that the fraction of bright nanowells would be equal no matter how many cells were in them. The drop in the fraction of bright nanowells showed that the cell lysate was interfering with the PCR, making the reaction less sensitive to small number of DNA copies. The limit of
47
detection of DNA with cell lysate in the nanowell would be 6 to 23 copies of DNA.
Figure 3.14. Detection of B2M mRNA transcripts on beads from bulk cellular mRNA extraction. 4D20 mRNA was extracted with oligo-dT beads. The beads were settled into nanowells and RT-PCR was run. A positive fluorescence signal for reactions with RT enzyme was present around 3 and was absent in the no RT enzyme control.
Figure 3.15. Detection on B2M mRNA from bulk cellular mRNA extraction. 10 ng or 100 pg of bulk cellular mRNA was added to the reaction mix and applied to the array. The exact number of mRNA copies in each well was unknown.
48
3.4.2. Evaporation
Evaporation caused by detachment of the array from the sealing glass slide and permeation of water from the nanowells into the PDMS were observed after the thermocycles81. The loss of water also caused the nanowells to pucker and shrink into a pincushion distortion. In case of extreme loss of water, the entire nanowells would detach from the glass slide and had no fluorescence signal in them. This evaporation was especially prevalent in the few rows and columns of entire blocks bordering the edges of the array. Also, wells that bordered evaporated blocks had brighter signal in all fluorescence channels. The increased fluorescence often required additional wells to be removed, thus reducing the percentage of usable wells in the array.
0 1 2 3 4 0 0.05 0.1 0.15 0.2 0.25 Number of cells F rac ti on pos it iv e f or H IV gag RTPCR 18.4e-6ng gag
Figure 3.16. Effect of cell lysate on RT-PCR. HIVgag DNA was spiked into an RT-PCR reaction with 4D20 cells. Having just one cell in a nanowell reduced the fraction of positive fluorescence by 4-fold from that of wells with no cells.
49
Changing the PDMS from Sylgard 184 to RTV615 significantly decreased the number of evaporation events to less than 10% of the array and often to less than 5%. One explanation is that the RTV615 was softer than Sylgard 184, so it could more easily mold to a flat glass slide if there were surface unevenness on the array. The RTV615 was also more stuck to the glass slide than Sylgard 184 as more force was needed to pry the glass slide off the array after thermocycling.
Another important feature of the array was the presence of microfluidic channels. To maximize the loading of cells in wells, arrays without channels were often used. However, for RT-PCR, arrays with no channels had evaporation in greater than 20% of the array. This result suggested that the channels acted as a liquid reservoir in the array. The importance of a reservoir had been observed to prevent evaporation in femtoliter digital PCR in PDMS58. To increase the reservoir volume further, we added channels between every block of nanowells, up from the original design of every four blocks. In the original four block format, wells bordering a channel were removed because they had brighter fluorescence than the wells that did not border channels. Interestingly, if there were channels between every block, the outer wells did not have a significantly brighter fluorescence. This phenomenon was observed in the array of 12 x 12 nanowells as well as the 11 x 11 design, where the wells were closer to the channels, so it was not proximity to the channel that caused the brighter fluorescence. One possible explanation could be that while the overall loss of liquid could be the same, the fraction lost in all the channels dropped since the size of the reservoir increased by 4-fold.
Finally, dropping the total number of thermocycles from 50 to 35 further alleviated the loss of water issues to just the bordering few rows and columns of the outer blocks. Not only did the reduction in thermocycles increase the percentage of usable wells in the array, it also
50
separated the positive and negative fluorescence signal. While cycles more than 35 did not increase the mean positive fluorescence signal, they did increase the mean negative fluorescence signal.
3.4.3. Limitations
One of the limitations of this method is that it was not quantitative. Unlike RT-qPCR in tubes, RT-PCR in nanowells was an endpoint measurement of the fluorescence from TaqMan probes, so only a presence or absence of a target gene could be obtained. The fluorescence was not measured after every cycle. Questions such as how much transcript was in the cell could not be answered by this platform. While we could detect the fluorescence increase in 5 cycle increments, as shown in the thermocycle optimization experiments, this required a different array for each cycle that was measured. When the same array was reimaged multiple times, the entire array was photo-bleached and lost all fluorescence signals after 3 to 4 reimages. In fact, a drop of ROX signal was observed in the last quarter of the array even before the entire array was imaged for the first time. These observations could be attributed to the high transmittance of light of PDMS82. As one block of nanowells was imaged, some of the light also hit other blocks, so when the last block of the array was imaged, some light could have already hit the last block more than 600 times.
A second limitation to this assay was that it could not consistently detect nuclear transcripts such as 1LTR circles in HIV-infected cells. In bulk RT-qPCR experiments, the no RT control still had a positive fluorescence profile, but at a later cycle number than the sample with RT enzyme. Bulk qPCR of ACH2 cell lysates showed detectable levels of 1LTR DNA circles and these circles were exclusively located in the nucleus83. However, when RT-PCR was run on
51
ACH2 cells, the 1LTR signal was not consistent: most wells with ACH2 cells were not positive for 1LTR. Since the limit of detection for PCR was approximately 10 copies of DNA, this lack of signal showed that the nucleus was not fully lysed by the reaction mixture.
53
Chapter 4. Characterization of RT-PCR in nanowells
4.1. Sensitivity and specificity
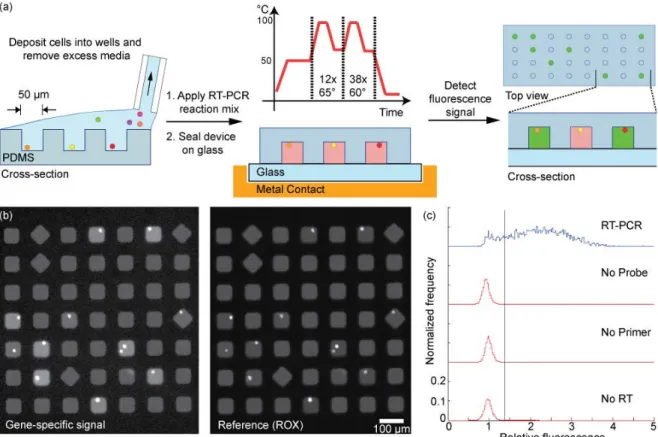
To establish the feasibility for in situ lysis and detection of an expressed gene of interest in wells containing cells, we used a human B cell hybridoma (4D20) that produces an antibody (IgG1) against the 1918 influenza virus84. Lysis of the cells and subsequent reverse transcription of a constitutively expressed gene (beta-2-microglobulin, B2M) was achieved in the closed reactors at 50 °C for 40 min. Then, the array was subjected to 50 rounds of thermocycling to amplify the transcribed cDNA and hydrolyze the quenched fluorophore from the labeled probes (Figure 4.1a). The array was imaged to detect the fluorescent signals evolved from the digested probes (Figure 4.1b). The images were analyzed using a custom program to determine the location of each well, the number of cells per well, and the fluorescence intensities of both the released probe and reference dye. These data were then filtered to discard wells with more than four cells and wells with a large coefficient of variation in the soluble reference signal (ROX). To normalize for regional variations of the measured intensities, we calculated the relative fluorescence as the ratio of the gene-specific signal (Iwell) to the mean of the gene-specific signal
of nearby empty wells (Iempty) (Figure 4.1c, top).
To determine the threshold value for a positive RT-PCR reaction, we fit the relative fluorescence of the wells containing no cells to a single Gaussian distribution to obtain estimates for the mean and standard deviation of the peak representing negative reactions (0.96±0.12). We defined positive reactions as those wells containing cells with a ratio greater than three standard deviations above the mean ratio determined for empty wells. The percentage of positive events
54
scored in control experiments in which either the primers, probe, or reverse transcriptase were excluded was less than 0.01% (Figure 4.1c). The lack of positive events scored upon omission of reverse transcriptase from the reaction indicates that the genomic DNA was not amplified, and implies that it is not necessary to remove residual genomic DNA from the reaction when using intron-spanning primers. Digestion of the gene-specific probe with DNase I in the reaction mixture prior to application to an array without cells yielded a measured ratio of 2.65±0.08 (data not shown). This experiment, in combination with the cell-based experiments, suggested that the maximum relative fluorescence for a positive reaction is about 2.7, and that 50 rounds of thermocycling were sufficient to obtain this endpoint.
55
Next, we determined the sensitivity and specificity of the method using three genes that are commonly employed as standards for RT-qPCR (B2M, glyceraldehyde 3-phosphate dehydrogenase (GAPDH), beta-actin (ACTB)), as well as the heavy chain of the antibody produced by the 4D20 hybridomas (HC) (Figure 4.2). The threshold values for positive reactions were determined for all four genes. Based on the maximum threshold of 1.4, the sensitivity and specificity of the assay were greater than 84% and 98%, respectively. The positive predictive
Figure 4.1 (a) Schematic of method for parallel single-cell RT-PCR reactions in nanowells. Cells are deposited in nanowells, filled with a solution of components for RT-PCR, and then sealed to a glass slide. The thermal lysis, first strand synthesis, and amplification of cDNA are conducted on a thermocycler. The fluorescence intensity of cleaved probes is detected by epifluorescent microscopy. (b) Fluorescent micrographs of gene-specific (B2M) and a reference signal (ROX) confined in individual, sealed nanowells. (c) Histogram of the relative fluorescence of wells that contain cells. Positive reactions have a relative fluorescence greater than 1.4.