Analysis, Modeling and Control of the Airport Departure Process
by
Ioannis Simaiakis
Eng. Dipl., National Technical University of Athens (2006) S.M., Massachusetts Institute of Technology (2009) Submitted to the Department of Aeronautics and Astronautics
in partial fulfillment of the requirements for the degree of Doctor of Philosophy in Aeronautics and Astronautics
at the
MASSACHUSETTS INSTITUTE OF TECHNOLOGY February 2013
c
Massachusetts Institute of Technology 2013. All rights reserved.
Author . . . . Department of Aeronautics and Astronautics
September 14, 2012 Certified by . . . . Hamsa Balakrishnan Associate Professor of Aeronautics and Astronautics Thesis Supervisor Certified by . . . . Eric M. Feron Professor of Aerospace Engineering, Georgia Institute of Technology Committee Member Certified by . . . . R. John Hansman Professor of Aeronautics and Astronautics Committee Member Certified by . . . . Amedeo R. Odoni Professor of Aeronautics and Astronautics Committee Member Accepted by . . . .
Eytan Modiano Professor of Aeronautics and Astronautics Chair, Committee on Graduate Students
Analysis, Modeling and Control of the Airport Departure Process by
Ioannis Simaiakis
Submitted to the Department of Aeronautics and Astronautics on September 14, 2012, in partial fulfillment of the
requirements for the degree of
Doctor of Philosophy in Aeronautics and Astronautics
Abstract
Increased air traffic demand over the past two decades has resulted in significant increases in surface congestion at major airports in the United States. The overall objective of this thesis is to mitigate the adverse effects of airport surface congestion, including increased taxi-out times, fuel burn, and emissions. The thesis tackles this objective in three steps: The first part deals with the analysis of departure operations and the characterization of airport capacity; the second part develops a new model of the departure process; and the third part of the thesis proposes and tests, both on the field and in simulations, algorithms for the control of the departure process.
The characterization and estimation of airport capacity is essential for the successful manage-ment of congestion. This thesis proposes a new parametric method for estimating the departure capacity of a runway system, the most constrained element of most airports. The insights gained from the proposed technique are demonstrated through a case study of Boston Logan International Airport (BOS). Subsequently, the methodology is generalized to the study of interactions among the three main airports of the New York Metroplex, namely, John F. Kennedy International Air-port (JFK), Newark Liberty International AirAir-port (EWR) and LaGuardia AirAir-port (LGA). The individual capacities of the three airports are estimated, dependencies between their operations are identified, and the capacity of the Metroplex as a whole is characterized. The thesis also identifies opportunities for improving the operational capacity of the Metroplex without significant redesign of the airspace. The proposed methodology is finally used to assess the relationship between route availability during convective weather and the capacity of LGA.
The second part of the thesis develops a novel analytical model of the departure process. The modeling procedure includes the estimation of unimpeded taxi-out time distributions, and the development of a stochastic and dynamic queuing model of the departure runway(s), based on the transient analysis of D(t)/Ek(t)/1 queuing systems. The parameters of the runway service process
are estimated using operational data. Using the aircraft pushback schedule as input, the model predicts the expected runway schedule and the takeoff times. It also estimates the expected queuing delay and its variance for each flight, along with the congestion level of the airport, sizes of the departure queues, and the departure throughput. The model is trained using data from EWR in 2011, and is subsequently used to predict taxi-out times at EWR in 2007 and 2010.
The final part of this thesis proposes dynamic programming algorithms for controlling the departure process, given the current operating environment. These algorithms, called Pushback Rate Control protocols, predict the departure throughput of the airport, and recommend a rate at which to release pushbacks from the gate in order to control congestion. The thesis describes the design and field-testing of a variant of Pushback Rate Control at BOS in 2011, and the development of a decision-support tool for its implementation. The analysis shows that during 8 four-hour test periods, fuel use was reduced by an estimated 9 US tons (2,650 US gallons), and taxi-out times
were reduced by an average of 5.3 min for the 144 flights that were held at the gate. The thesis concludes with simulations of the Pushback Rate Control protocol at Philadelphia International Airport (PHL), one of the most congested airports in the US, and a discussion of the potential benefits and implementation challenges.
Thesis Supervisor: Hamsa Balakrishnan
Acknowledgments
First and foremost, I would like to thank my advisor, Hamsa Balakrishnan, for her vision, su-pervision and support during the last five years. I would like to thank Hamsa not only for her guidance in the work presented in this thesis, but also for the opportunity to work closely with her in very exciting research projects and be treated as an equal. Her drive, patience and persistence in combination with her kindness, openness, and friendliness make her a great role model for me. I am especially grateful to Hamsa for all the time she has devoted to make me a better academic writer and presenter.
I also had the unique opportunity to work closely with John Hansman. It was a great pleasure meeting and brainstorming with him. I learned a lot from his out-of-the-box thinking and his insistence on clear and simple ideas. I would like to thank Amedeo Odoni for all the conversations we have had and the continuous mentoring he has offered me since I came to MIT. Furthermore, I would like to thank Eric Feron for his insights, and comments in the later stages of my research. Finally, I would like to thank Richard Jordan and Robert Shumsky for their careful reading of the thesis and thorough comments. I am also grateful to Richard for his feedback during our meetings in the last 5 years.
I feel immense gratitude towards the FAA for funding my research under the PARTNER Center of Excellence, and giving me the opportunity to implement parts of the research in the field. I would also like to acknowledge the cooperation and support of all the individuals who made the field trials at Boston Logan International Airport possible: Brendan Reilly, Deborah James, Pat Hennessy, John Ingaharro, John Melecio, Michael Nelson, Chris Quigley and all the air traffic controllers at the BOS Air Traffic Control Tower Facility; Vincent Cardillo, Flavio Leo, and Robert Lynch at Massport; George Ingram and other airline representatives at the ATA. I am grateful to Tom Reynolds, Masha Ishutkina, James Kuchar, Jim Eggert, Daniel Herring, Rich DeLaura, and Ngaire Underhill of MIT Lincoln Laboratory for their support and help with the ASDE-X and RAPT data. I would also like to thank Alex Nakahara, who provided assistance in computing the fuel burn savings from the field trials, and Regina Clewlow, Alexander Donaldson and Diana Michalek Pfeil, who helped with tower observations before and during the trials. Last but not least, many thanks to Harshad Khadilkar for his great contribution on planning, executing and analyzing the field trials.
papers with many fellow students. The conference papers with Harshad Khadilkar, Hanbong Lee, Nikolas Pyrgiotis, Alexander Donaldson, Regina Clewlow, Lanie Sandberg and the working paper with Alexandre Jacquillat proved to be valuable foundations for the material presented in this thesis. I am really thankful to you guys; it was a real pleasure working with you and learning from you. Thanks also to Claire Cizaire, Lishuai Li, and Diana Michalek Pfeil for all the advice, research and life discussions. Finally, a special thank-you note goes to my statistics and optimization mentor, Varun Ramanujam.
Spending the last five years in graduate school was a truly amazing experience thanks to the company of truly exciting people. In particular, I would like to thank Gerasimos Skaltsas, Nikolas Pyrgiotis, Kostas Bimpikis and Ruben Lobel for the great times we spent in Cambridge and the magnificent traveling experiences we shared in many parts of the world. A special thanks goes to Anurupa Ganguly, for her patience and her empathy in my long and winding road towards the PhD completion.
Finally, I would like to express my deepest appreciation to my parents, Panagiota and Kostas, for their support they have given me while at MIT and their life-long commitment to providing me with the best educational opportunities available. I am also very grateful to my sister, Vasiliki, for her uplifting visits in Cambridge.
Contents
1 Introduction 29
1.1 Motivation . . . 29
1.2 Background and literature review . . . 32
1.2.1 Characterization of airport capacity . . . 32
1.2.2 Modeling of departure operations . . . 34
1.2.3 Optimization of the departure process . . . 37
1.2.4 Control of departure processes . . . 41
1.3 Main contributions of this thesis . . . 44
1.4 Organization of the thesis . . . 47
2 Characterization and Estimation of Airport Capacity 49 2.1 Average departure throughput . . . 49
2.2 Departure throughput as a function of departure demand and arrival throughput . . 53
2.2.1 Variance of departure throughput . . . 55
2.3 Operational throughput envelope . . . 56
2.3.1 Data filtering . . . 56
2.3.2 Estimation method . . . 59
2.4 Parametrization of the operational throughput envelope . . . 60
2.4.1 Role of ATC in allocating capacity . . . 60
2.4.2 Multi-variable statistical models of departure capacity . . . 61
2.4.3 Operational throughput parametrized by fleet mix . . . 64
2.4.4 Comparison to empirical capacity envelopes . . . 69
2.5 Predictive ability of proposed methods . . . 70
2.6.1 Interactions between jet and prop departures . . . 73
2.6.2 Saturation plot for jet departures . . . 75
2.6.3 Estimation of the saturation point . . . 76
2.6.4 Jet departure throughput as a function of arrival throughput and fleet mix . 76 2.7 Conclusions . . . 77
3 Case Study: Capacity Analysis of the New York Metroplex 79 3.1 Operational throughput of EWR . . . 80
3.1.1 Estimation of operational throughput for configuration (VMC; 4R | 4L) . . . 80
3.1.2 Analysis of South flow configurations . . . 88
3.1.3 Predictive capabilities of EWR models . . . 91
3.1.4 Correlation between Heavy departures and Heavy arrivals . . . 93
3.1.5 Concluding remarks on EWR analysis . . . 95
3.2 Capacity of the New York Metroplex . . . 96
3.2.1 Interactions between JFK and EWR . . . 97
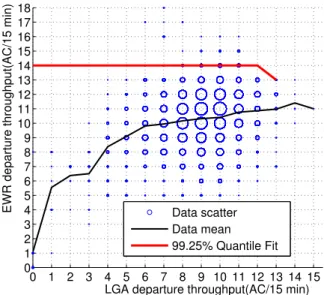
3.2.2 Interactions between LGA and EWR . . . 100
3.2.3 Operational throughputs of JFK and LGA . . . 102
3.2.4 Local regression for Metroplex . . . 103
3.2.5 Metroplex operational throughput . . . 105
3.3 Leveraging route availability information for operational throughput estimation . . . 108
3.3.1 Route Availability Planning Tool (RAPT) . . . 108
3.3.2 Analysis of LGA with RAPT data . . . 109
3.3.3 Predictive ability of proposed method . . . 112
3.4 Conclusions . . . 114
4 Queuing Model of the Departure Process 115 4.1 Model inputs and outputs . . . 116
4.2 Model structure . . . 117
4.2.1 Data sources . . . 118
4.3 Travel time estimation (Module 1) . . . 118
4.3.1 Unimpeded taxi-out time . . . 119
4.3.2 Ramp and taxiway interactions . . . 124
4.4 Queuing delay estimation (Module 2) . . . 127
4.4.1 Runway queuing model . . . 127
4.4.2 Queuing delay calculations . . . 133
4.4.3 Estimation of the departure capacity distributions . . . 136
4.4.4 Service time distributions . . . 139
4.4.5 Module 2 outputs . . . 150
4.5 Model results for EWR . . . 151
4.5.1 Comparison to a deterministic model . . . 153
4.5.2 Comparison to Monte Carlo simulations . . . 156
4.6 Predictive ability of the proposed model . . . 160
4.6.1 Predictions for EWR in year 2010 . . . 160
4.6.2 Predictions of delays on individual days . . . 161
4.6.3 Predictions for EWR in year 2007 . . . 165
4.6.4 Predictions of taxi-out times of individual flights . . . 167
4.6.5 Airport performance in 2007 . . . 169
4.6.6 Predictions for runway configuration 4R | 4L . . . 169
4.7 Conclusions . . . 170
5 Dynamic Control of Airport Departures 173 5.1 Introduction . . . 173
5.2 Design of the control strategy . . . 173
5.2.1 Data sources . . . 174
5.3 Departure process model . . . 175
5.3.1 State variables . . . 175
5.3.2 Selection of time period . . . 176
5.3.3 Pushback process . . . 177
5.3.4 Runway service process . . . 177
5.3.5 System dynamics . . . 180
5.3.6 Choice of cost function . . . 181
5.4 Dynamic programing formulation . . . 181
5.5 Application of PRC at BOS . . . 183
5.5.2 Estimation of runway service process parameters . . . 184
5.5.3 Maximum pushback rate and cost function . . . 185
5.5.4 Calculation of optimal policies . . . 185
5.5.5 Conditional throughput forecasts . . . 188
5.5.6 Rounding of optimal policies . . . 189
5.6 Design of a Decision Support Tool . . . 190
5.6.1 Inputs . . . 191
5.6.2 Outputs . . . 191
5.6.3 Tablet deployment . . . 193
5.7 Field trials evaluation . . . 193
5.7.1 Congestion control . . . 194
5.7.2 Translating gate-hold times to taxi-out time reductions . . . 196
5.7.3 Departure throughput prediction . . . 199
5.7.4 Evaluation of the Decision Support Tool . . . 202
5.7.5 Qualitative observations . . . 203
5.8 An alternate model for the runway service process . . . 205
5.8.1 Motivation . . . 205
5.8.2 The (M (t)|R0)/Ds/1 model . . . 205
5.8.3 Comparison of the two models . . . 208
5.8.4 Parametric analysis . . . 210
5.8.5 Simulation of PRC at PHL . . . 213
5.9 Conclusions . . . 222
6 Summary and Next Steps 223 6.1 Summary of results . . . 223
6.2 Future research directions . . . 224
A Airport Diagrams 227 A.1 John F. Kennedy International Airport(JFK) . . . 228
A.2 Newark Liberty International Airport (EWR) . . . 229
A.3 La Guardia Airport(LGA) . . . 230
A.4 Philadelphia International Airport (PHL) . . . 231
A.6 Charlotte Douglas International Aiprort(CLT) . . . 233
A.7 Dallas/Fort Worth International Airport (DFW) . . . 234
B New York Metroplex Airspace and Airfields 235 C Operational Throughput Envelopes 237 C.1 John F. Kennedy International Airport(JFK) . . . 238
C.2 La Guardia Airport(LGA) . . . 239
C.3 Philadelphia International Airport (PHL) . . . 240
D Analysis of Single Runway Operational Performance: Examples from DFW and PHL 241 D.1 Introduction . . . 241
D.2 Departure capacity of Runway 17R of DFW . . . 241
D.2.1 Operations at DFW . . . 242
D.2.2 Departure throughput as a function of the departure queue . . . 243
D.2.3 The service time as a function of the queue length . . . 245
D.2.4 A linear regression model for the inter-departure time prediction . . . 246
D.2.5 Operational throughput envelope of Runway 17R . . . 254
D.2.6 Estimation of DFW capacity . . . 258
D.3 Departure capacity of Runway 27L of PHL . . . 259
D.3.1 Comparison of ASPM and ASDE-X data . . . 259
D.3.2 Use of RAPT for estimating the operational throughput envelope of PHL . . 260
D.3.3 Operational throughput envelope parametrized by Heavy aircraft departures 261 E Unimpeded Taxi-out Time Estimation Results 265 F Model Predictions for EWR Runway Configuration 4R | 4L 269 F.1 Model development . . . 269
F.2 Predictions for year 2010 . . . 272
F.3 Predictions for year 2007 . . . 274
F.4 Individual flights taxi-out times predictions . . . 276
G Model Predictions for PHL Runway Configuration 26, 27R, 35 | 27L, 35 277 G.1 Saturation plot . . . 277
G.2 Estimation of the departure capacity distributions . . . 278
G.3 Unimpeded taxi-out estimation . . . 280
G.4 Results . . . 282
H Assessment of the Impacts of the New Runway at Charlotte International Air-port 287 H.1 Operational throughput envelopes at CLT before and after the new runway . . . 287
H.2 Estimation of added capacity at CLT . . . 291
H.3 Taxi times at CLT . . . 293
H.4 Impact of added capacity on taxi-out times . . . 293
H.4.1 North flow configuration . . . 294
H.4.2 South flow configuration . . . 301
List of Figures
1-1 Departure queue of Runway 27L at PHL [102]. . . 30 1-2 Average number of pushbacks, average number of takeoffs and departure capacity
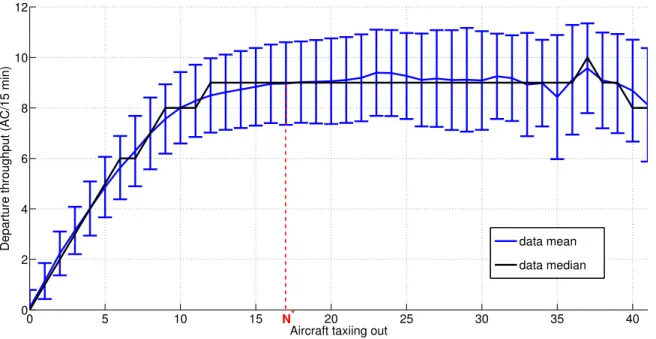
per 15 minutes at PHL in 2011 (top); Average number of pushbacks per 15 minutes and average taxi-out times (bottom). . . 31 1-3 Departure throughput as a function of the number of aircraft taxiing out, for the
(VMC; 31 | 4) configuration at LGA . . . 42
2-1 BOS throughput in configuration (VMC; 22L, 27 | 22L, 22R). . . 50 2-2 BOS departure throughput in configuration (VMC; 22L, 27 | 22L, 22R) as function
of arrivals and departure demand. . . 55 2-3 BOS departure throughput in configuration (VMC; 22L, 27 | 22L, 22R) for different
numbers of arrivals. . . 56 2-4 BOS departure throughput (AC/15 min) as a function of arrival throughput (A) and
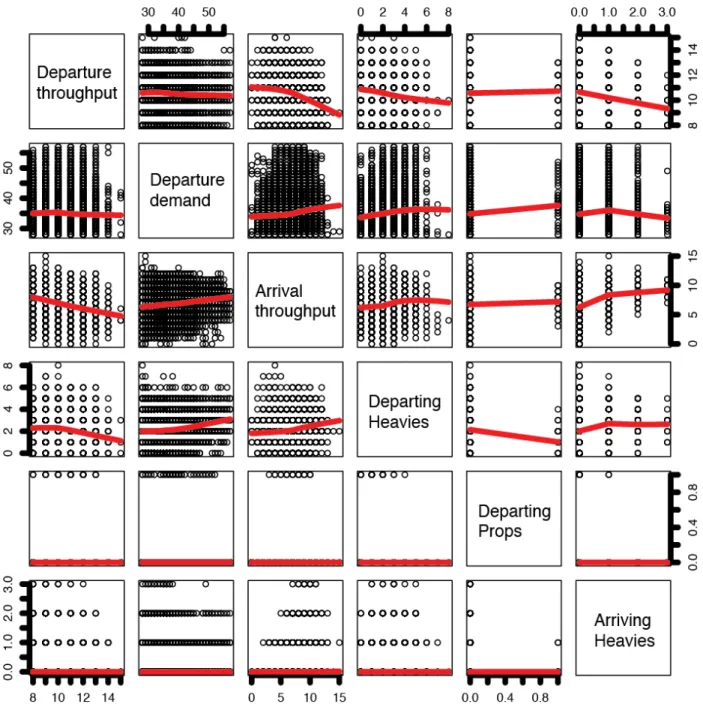
departure demand (N ). . . 58 2-5 BOS operational throughput envelope in configuration (VMC; 22L, 27 | 22L, 22R). . 60 2-6 Correlation between departure throughput, departure demand, arrival throughput,
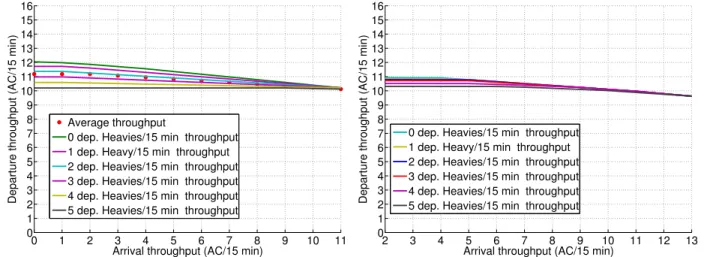
Heavy departures and departing props. . . 64 2-7 BOS parametrized operational throughput envelope in configuration (VMC; 22L, 27
| 22L, 22R). . . 66 2-8 BOS operational throughput envelope in configuration (VMC; 4R, 4L | 4R, 4L, 9). 68 2-9 BOS operational throughput envelope in configuration (VMC; 27, 32 | 33L). . . 68
2-10 Operational throughput envelope and capacity envelope comparison for BOS config-uration (VMC; 22L, 27 | 22L, 22R). . . 69 2-11 BOS operational throughput envelopes estimated with ASDE-X data. . . 74
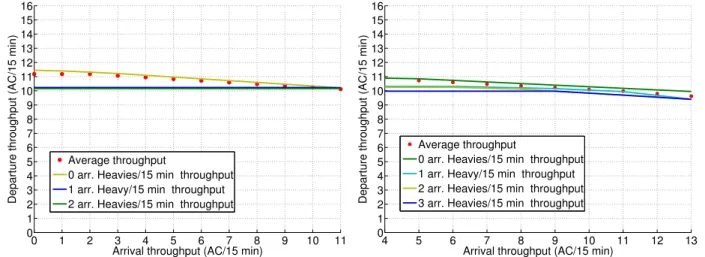
2-12 BOS departure throughput tradeoff between props and jets in configuration (VMC; 22L, 27 | 22L, 22R). . . 74 2-13 BOS jet departure throughput in configuration (VMC; 22L, 27 | 22L, 22R). . . 75 2-14 Operational jet throughput envelopes in configuration (VMC; 22L, 27 | 22L, 22R). . 77
3-1 Two different measures of the capacity of runway configuration (VMC; 4R | 4L) of EWR. . . 81 3-2 Correlation between departure throughput, departure demand, arrival throughput,
Heavy departures, prop departures and Heavy arrivals. . . 83 3-3 Parametric representation of the capacity of the 4R|4L runway configuration. . . 87 3-4 Operational throughput envelopes of the two major south-flow runway configurations
at EWR. . . 90 3-5 Impact of Heavy departures on operational throughput for the two major south-flow
runway configurations at EWR. . . 91 3-6 Impact of Heavy aircraft arrivals for the two major south–flow runway configurations
at EWR. . . 92 3-7 Relation between Heavy departures and Heavy arrivals for three major runway
con-figurations at EWR. . . 94 3-8 Relation between EWR departure capacity and JFK departures for the three major
runway configurations at EWR, during periods when EWR is in saturation. . . 98 3-9 Relation between EWR departure capacity and JFK departure capacity, for three
major runway configurations at EWR during periods when both airports are in saturation. . . 99 3-10 Relation between EWR departure capacity and LGA departure capacity for the three
major runway configurations at EWR and LGA. . . 101 3-11 Correlations between departures and arrivals in the NY Metroplex for the
“South-Flow-VMC-Arrival Priority” configuration. . . 104 3-12 Operational throughput envelope of the New York Metroplex for the
“South-Flow-VMC-Arrival Priority” configuration. . . 106 3-13 Operational throughput envelopes of the New York Metroplex for the Departure
Priority configurations. . . 107 3-14 Use of route availability for operational throughput estimation. . . 112
4-1 Departure process model. . . 117
4-2 Empirical data showing the taxi-out times as a function of the adjusted traffic for the flights of ExpressJet Airlines in configuration 22L | 22R at EWR. . . 123
4-3 Regression fit of the taxi-out times as a function of the adjusted traffic for the flights of ExpressJet Airlines in runway configuration 22L | 22R at EWR. . . 124
4-4 Empirical and fitted distribution of the unimpeded taxi-out times of ExpressJet Airlines in runway configuration 22L | 22R at EWR. . . 125
4-5 Markov chain transition at the time of arrival of the lth aircraft. . . 130
4-6 EWR saturation plot for configuration (VMC; 22L | 22R) in year 2011. . . 136
4-7 Two representations of the EWR departure capacity . . . 137
4-8 Empirical (frw) and modeled (frm) probability distributions of the departure through-put of runway configuration 22L |22R under different conditions. . . 138
4-9 Empirical (frw) and modeled (frm) probability distributions of the departure through-put of BOS runway configuration 22L, 27 | 22L, 22R. . . 141
4-10 Empirical service time probability distribution for departures of runway configuration 22L, 27 | 22L, 22R at BOS. . . 143
4-11 Service time probability distribution fits for departures of runway configuration 22L, 27 | 22L, 22R at BOS. . . 146
4-12 Empirical throughput distribution, frw, and fits frm and ˜fde for departures of BOS runway configuration 22L, 27 | 22L, 22R. . . 147
4-13 Empirical throughput distribution, frw, and fits fsf and fsa for departures of BOS runway configuration 22L, 27 | 22L, 22R. . . 148
4-14 Empirical service time probability distributions for departures of BOS runway con-figuration 22L, 27 | 22L, 22R for Heavy and non-Heavy jets. . . 149
4-15 Actual and modeled frequency of each state N (top); Actual and modeled average taxi-out time as a function of the state N at the time of pushback (bottom) for EWR runway configuration 22L | 22R in year 2011. . . 152
4-16 Actual and modeled throughput of all states N for EWR runway configuration 22L | 22R in year 2011: Mean (top); Median (bottom). . . 153
4-17 Actual and predicted average taxi-out time as a function of the takeoff queue of each aircraft. . . 155
4-18 Actual and modeled histogram of taxi-out times for EWR runway configuration 22L | 22R in year 2011. . . 158
4-19 Actual and modeled frequency of all states N (top); Actual and modeled average taxi-out time as a function of the state N at the time of pushback (bottom) for EWR runway configuration 22L | 22R in year 2010. . . 161
4-20 Actual and modeled throughput of all states N for EWR runway configuration 22L | 22R in year 2010: Mean (top); Median (bottom). . . 162
4-21 Predictions of departure throughput, average taxi-out times and departure queue lengths in each 15-min interval over a 13-hour period on Thursday, August 5, 2010. 163
4-22 Predictions of departure throughput, average taxi-out times and departure queue lengths in each 15-min interval over a 12-hour period on Friday, 26 November, 2010. 164
4-23 Predictions of departure throughput, average taxi-out times and departure queue lengths in each 15-min interval over a 13-hour period on Wednesday, 8 December, 2010. . . 164
4-24 Actual and modeled frequency of all states N (top); Actual and modeled average taxi-out time as a function of the state N at the time of pushback (bottom) for EWR runway configuration 22L | 22R in year 2007. . . 165
4-25 Actual and modeled throughput of all states N for EWR runway configuration 22L | 22R in year 2007: Mean (top); Median (bottom). . . 166
4-26 Predicted impact of high congestion on the variability of the queuing delays. . . 167
4-27 Taxi-out time prediction error for individual flights for EWR runway configuration 22L | 22R. . . 168
4-28 Actual throughput in all states N for EWR runway configuration 22L | 22R in years 2007, 2010 and 2011: Mean (top); Median (bottom). . . 170
5-1 Regression of the departure throughput as a function of the number of aircraft taxiing out, for the 22L, 27 | 22L, 22R configuration at BOS during evenings, under VMC, using ASDE-X data. . . 175
5-2 State transition diagram for an (M (t)|R0)/E2/1 system with queuing space of 4
5-3 Empirical (frw) and modeled (frm) probability distributions of the departure
capac-ity of runway configuration 22L, 27|22L,22R under visual meteorological conditions during evening times. . . 184
5-4 Optimal pushback policy and expected work-in-process as a function of the current state. . . 186
5-5 Optimal pushback policy ¯λτ as a function of the expected queue ¯Dτ +∆ at the next
epoch (τ + ∆). . . 187
5-6 Jet departure throughput prediction (mean, standard deviation) given expected number of Arrivals in the next 15 minutes and number of props taxiing out. . . 188
5-7 Setup of rate control transmitter and receiver in the BOS ATCT. . . 190
5-8 The two tablets used during the 2011 field-trials at BOS. . . 191
5-9 Surface congestion at each time window, demand and pushbacks during each time window (top), departure throughput measurements and predictions (center) and average taxi-out times and gateholds (bottom) during each time window for two days of field-testing . . . 195
5-10 Queue sizes measured and predicted per minute, on July 21, 2011. . . 198
5-11 Percentage of gate-hold times, taxi-out time reduction and fuel burn savings corre-sponding to each airline. . . 200
5-12 Histogram of responses from air traffic controller survey regarding PRC at BOS. . . 203
5-13 Expected queue length after 15 minutes as a function of the number of aircraft in the departure queue (D) and the number of aircraft traveling to the runway (G) for the two models, (M (t)|R0)/E(k)/1 in solid line, (M (t)|R0)/Ds(t)/1 in dashed line. 208
5-14 Optimal pushback policy as a function of the expected queue ¯Dτ +∆at the next epoch
(τ + ∆) for the policies PRC v2.0 and PRC v3.0. . . 210
5-15 Optimal pushback policy ˆλτ as a function of the expected queue ¯Dτ +∆ at the next
epoch (τ + ∆) for the policies PRC v3.0 and PRC v3.1. . . 211
5-16 Sensitivity analysis examples. . . 212
5-17 Average number of pushbacks, and average numbers of actual and predicted takeoffs by time of day at PHL in 2011 (top); Average actual and predicted taxi-out times (bottom). . . 214
5-18 N-Control simulation: Average departure capacity (in black), average number of pushbacks, average number of actual and simulated takeoffs at PHL in 2011 (top);
Average actual and simulated taxi-out times (bottom). . . 219
5-19 Slot-Control simulation: Average departure capacity (in black), average number of pushbacks, average number of actual and simulated takeoffs at PHL in 2011 (top); Average actual and simulated taxi-out times (bottom). . . 220
5-20 PRC simulation: Average departure capacity (in black), average number of push-backs, average number of actual and simulated takeoffs at PHL in 2011 (top); Aver-age actual and simulated taxi-out times (bottom). . . 221
5-21 Comparison of the performance of the control strategies in the evening times . . . . 221
A-1 JFK airport diagram[83] . . . 228
A-2 EWR airport diagram[83] . . . 229
A-3 EWR airport diagram[83] . . . 230
A-4 PHL airport diagram[83] . . . 231
A-5 BOS airport diagram[83] . . . 232
A-6 CLT airport diagram [42] . . . 233
A-7 DFW airport diagram with runway crossing boxes ( courtesy of Lincoln Labs) . . . . 234
B-1 Airspace Configuration [130] . . . 236
B-2 Relative runways orientation [130] . . . 236
C-1 Operational throughput envelopes for the major runway configurations of JFK. . . . 238
C-2 Operational throughput envelopes for the main runway configurations of LGA. . . . 239
C-3 operational throughput envelope for runway configuration 26, 27R, 35 | 27L, 35 of PHL . . . 240
C-4 Parametrized operational throughput envelope for runway configuration 26, 27R, 35 | 27L, 35 of PHL . . . 240
D-1 Departure throughput as function of the number of aircraft taxiing out in 2010. . . . 243
D-2 Departure throughput of Runway 17R as function of number of aircraft in the de-parture queue. . . 245
D-3 Service time distributions. . . 246
D-5 Regression tree for the service time prediction given zero runway crossings. . . 251 D-6 Operational throughput envelopes for Runway 17R. . . 257 D-7 Jet aircraft departure throughput as function of jets departure demand in 2010 . . . 259 D-8 Departure throughput as function of aircraft taxiing out at PHL. . . 260 D-9 Departure throughput of Runway 27L of PHL as a function of arrival throughput
and route availability. . . 262 D-10 Operational throughput envelope of Runway 27L of PHL parametrized by the
num-ber of Heavy departures. . . 263
E-1 Fitted function of the taxi-out times of the flights for JetBlue in configuration 22L | 22R of EWR . . . 267 E-2 Empirical and fitted distribution of the unimpeded taxi-out times for JetBlue in
configuration 22L | 22R at EWR . . . 267 E-3 Fitted function of the taxi-out times of the flights for US Airways in configuration
22L | 22R of EWR . . . 268 E-4 Empirical and fitted distribution of the unimpeded taxi-out times for US Airways in
configuration 22L | 22R at EWR . . . 268
F-1 Actual and modeled frequency of all states N (top); Actual and modeled dependence of the average taxi-out time as a function of the state N at the time of pushback (bottom) for EWR runway configuration 4R | 4L in year 2011. . . 270 F-2 Actual and modeled throughput of all states N for EWR runway configuration 4R |
4L in year 2011: Mean (top); Median (bottom). . . 271 F-3 Actual and modeled frequency of all states N (top); Actual and modeled dependence
of the average taxi-out time as a function of the state N at the time of pushback (bottom) for EWR runway configuration 4R | 4L in year 2010. . . 272 F-4 Actual and modeled throughput of all states N : Mean (top); Median (bottom) for
EWR runway configuration 4R | 4L in year 2010. . . 273 F-5 Actual and modeled frequency of all states N (top); Actual and modeled dependence
of the average taxi-out time as a function of the state N at the time of pushback (bottom) for EWR runway configuration 4R | 4L in year 2007. . . 274 F-6 Actual and modeled throughput of all states N for EWR runway configuration 4R |
F-7 Individual flights taxi time prediction error for EWR runway configuration 4R | 4L. 276
G-1 PHL saturation plot for runway configuration 26, 27R, 35 | 27L, 35 in year 2011. . . 278
G-2 Estimation of the area for which the departure throughput does not change with departure demand. . . 279
G-3 Expected departure throughput and service time distributions parameters for 20 ≤ N ≤ 27 conditioned on arrival demand, route blockage and fleet mix information. . . 280
G-4 Actual and modeled frequency of all states N (top); Actual and modeled dependence of the average taxi-out time as a function of the state N at the time of pushback (bottom) for PHL runway configuration 26, 27R, 35 | 27L, 35 in year 2011. . . 283
G-5 Actual and modeled throughput of each state N : Mean (top); Median (bottom) for PHL runway configuration 26, 27R, 35 | 27L, 35 in year 2011. . . 284
G-6 Average number of pushbacks, average number of actual and predicted takeoffs at PHL in 2011 (top); Average actual and predicted taxi-out times (bottom). . . 285
G-7 Average number of pushbacks, average number of actual and predicted takeoffs of Heavies at PHL in 2011 (top); Average number of pushbacks, average number of actual and predicted takeoffs of props at PHL in 2011 (bottom). . . 286
H-1 Operational throughput envelope of the major CLT runway configurations. . . 288 H-2 Data scatter, mean values, and fitted throughput function the south flow
configura-tion (18R, 23 | 18R, 18L) in 2007. . . 289
H-3 Regression tree showing the departure throughput (AC/15 min) of the (VMC; 36L, 36R | 36L, 36R) configuration in 2009, parametrized by arrival throughput (AC/15 min). . . 295 H-4 Regression tree showing the departure throughput (AC/15 min) of (VMC; 36C, 36L,
36R | 36C, 36R) configuration in 2011 parametrized by arrival throughput (AC/15 min). . . 296
H-5 Actual and modeled frequency of each state N (top); Actual and modeled average taxi-out time as a function of the state N at the time of pushback (bottom) for CLT runway configuration 36C, 36L, 36R | 36C, 36R in 2010. . . 298
H-6 Actual and modeled throughput of all states N for CLT runway configuration 36C, 36L, 36R | 36C, 36R in 2010: Mean (top); Median (bottom). . . 298
H-7 Actual and modeled frequency of each state N (top); Actual and modeled average taxi-out time as a function of the state N at the time of pushback (bottom) for CLT runway configuration 36C, 36R | 36C, 36R in 2010. No new runway is assumed in the model predictions. . . 299 H-8 Actual and modeled throughput of all states N for CLT runway configuration 36C,
36R | 36C, 36R in 2010: Mean (top); Median (bottom). No new runway is assumed in the model predictions. . . 299 H-9 Average number of pushbacks, and average numbers of actual and predicted takeoffs
by time of day at CLT for runway configuration 36C, 36L, 36R | 36C, 36R in 2010 (top); Average actual and predicted taxi-out times (bottom). . . 300 H-10 Average number of pushbacks, and average numbers of actual and predicted takeoffs
by time of day at CLT for runway configuration 36C, 36R | 36C, 36R in 2010 (top); Average actual and predicted taxi-out times (bottom). No new runway is assumed in the model predictions. . . 301 H-11 Actual and modeled frequency of each state N (top); Actual and modeled average
taxi-out time as a function of the state N at the time of pushback (bottom) for CLT runway configuration 18C, 18R, 23 | 18C, 18L in 2010. . . 303 H-12 Actual and modeled throughput of all states N for CLT runway configuration18C,
List of Tables
2.1 Mutual information and correlation between departure throughput and potential explanatory variables. . . 63 2.2 Statistics of the training and test datasets. . . 71 2.3 Comparison of three different estimators for the departure throughput on the training
and the test datasets. . . 73
3.1 Frequency of use of most frequently used EWR configurations under Visual and Instrument Meteorological Conditions in 2007 and 2008. . . 80 3.2 Mutual information and correlation between departure throughput and potential
explanatory variables. . . 82 3.3 Statistics of the training dataset for the EWR analysis. . . 93 3.4 Comparison of four different estimators for the departure throughput on the EWR
training data set. . . 93 3.5 Correlation between Heavy departures and Heavy arrivals for the prominent runway
configurations at EWR. . . 95 3.6 EWR aggregate average runway throughput (AC/15 minutes). . . 96 3.7 Correlation between EWR departure capacity and JFK departure capacity. . . 100 3.8 Frequency of simultaneous use of EWR and LGA configurations under Visual
Mete-orological Conditions. . . 100 3.9 JFK aggregate average runway throughput (AC/15 min). . . 102 3.10 LGA aggregate average runway throughput (AC/15 min). . . 103 3.11 Elements of the “South-Flow-VMC-Arrival Priority” Metroplex configuration. . . . 103 3.12 Elements of the “South-Flow-VMC-Departure Priority” Metroplex configuration. . 105 3.13 Elements of the “North-Flow-VMC-Departure Priority” Metroplex configuration. . 105 3.14 New York Metroplex aggregate average throughput (AC/15 minutes). . . 106
3.15 RAPT indicators when runway configuration 22 | 13 was in use at LGA. . . 110 3.16 RAPT indicators when runway configuration 22 | 31 was in use at LGA. . . 110 3.17 Statistics of the training and test datasets for the LGA RAPT analysis. . . 112 3.18 Comparison of three different estimators of departure throughput for runway
config-uration 22 | 13 at LGA, showing the benefits of RAPT usage. . . 113 3.19 Comparison of three different estimators of departure throughput on the training
data set for runway configuration 22 | 31 at LGA, showing the benefits of RAPT usage. . . 114
4.1 Standard deviation of the distributions frw and frm. . . 140
4.2 Distributions frw and frm. . . 141
4.3 Distribution parameters . . . 146 4.4 Comparison of the distributions frw, frm and fde. . . 148
4.5 Comparison of the distributions frw, fsf and fsa. . . 149
4.6 Aggregate taxi time predictions for EWR runway configuration 22L | 22R in year 2011. . . 151 4.7 Prediction statistics for the congestion state and the throughput for EWR runway
configuration 22L | 22R in year 2011. . . 153 4.8 Aggregate taxi time predictions using a deterministic model for EWR runway
con-figuration 22L | 22R in year 2011. . . 154 4.9 Averaged taxi time predictions from Monte Carlo simulations of simulation setting
1 for EWR runway configuration 22L | 22R in year 2011. . . 159 4.10 Averaged taxi time predictions from Monte Carlo simulations of simulation setting
2 for EWR runway configuration 22L | 22R in year 2011. . . 159 4.11 Averaged taxi time predictions from Monte Carlo simulations of simulation setting
3 for EWR runway configuration 22L | 22R in year 2011. . . 159 4.12 Averaged taxi time predictions from Monte Carlo simulations of simulation setting
4 for EWR runway configuration 22L | 22R in year 2011. . . 159 4.13 Aggregate taxi time predictions for EWR runway configuration 22L | 22R in year
2010. . . 160 4.14 Prediction statistics for the congestion state and the throughput for EWR runway
4.15 Aggregate taxi time predictions for EWR runway configuration 22L | 22R in year 2007. . . 166 4.16 Prediction statistics for the congestion state and the throughput for EWR runway
configuration 22L | 22R in year 2007. . . 167 4.17 Prediction statistics for individual taxi-out times for EWR runway configuration 22L
| 22R in year 2007. . . 169 4.18 Prediction statistics for individual taxi-out times for EWR runway configuration 4R
| 4L in years 2007, 2010 and 2011. . . 170 4.19 Summarized prediction results for EWR runway configuration 22L | 22R in years
2007, 2010 and 2011. . . 171 4.20 Summarized prediction results for EWR runway configuration 4R | 4L in years 2007,
2010 and 2011. . . 171
5.1 First two moments of the distributions frw and frm. . . 185
5.2 Summary of gate-hold times for the eight demo periods with significant gateholds. . 193 5.3 Effect of gate-holding on mean taxi-times and queue lengths. . . 197 5.4 Comparison of the estimator used and three alternatives for predicting jet departure
throughput. . . 201 5.5 Taxi time predictions for PHL from simulating different control strategies. . . 217
D.1 Major runway configurations in DFW under Visual Meteorological Conditions. . . . 242 D.2 Service time as a function of queue size. . . 245 D.3 Intercept and regression coefficients for the multiple regression model given zero
arrivals crossings. . . 250 D.4 Summarized results for the multiple regression model given zero arrivals crossings. . 250 D.5 Intercept and regression coefficients for the robust regression model given zero
ar-rivals crossings. . . 250 D.6 Intercept and regression coefficients for the multiple regression model given zero
arrivals crossings without the “Same subqueue” variable. . . 252 D.7 Summarized results for the multiple regression model given zero arrivals crossings
without the Same subqueue variable. . . 252 D.8 Intercept and regression coefficients for the robust regression model given zero
D.9 Intercept and regression coefficients for the multiple regression model given nonzero arrivals crossing. . . 253 D.10 Summarized results for the multiple regression model given nonzero arrivals crossing. 253 D.11 Intercept and regression coefficients for the robust regression model given nonzero
arrivals crossing. . . 253
E.1 Unimpeded taxi-out time estimates for runway configuration 22L | 22R of EWR . . 266
F.1 Aggregate taxi time predictions for EWR runway configuration 4R | 4L in year 2011. 269 F.2 Prediction statistics for the congestion state and the throughput for EWR runway
configuration 4R | 4L in year 2011. . . 269 F.3 Aggregate taxi time predictions for EWR runway configuration 4R | 4L in year 2010. 272 F.4 Prediction statistics for the congestion state and the throughput for EWR runway
configuration 4R | 4L in year 2010. . . 273 F.5 Aggregate taxi time predictions for EWR runway configuration 4R | 4L in year 2007. 274 F.6 Prediction statistics for the congestion state and the throughput for EWR runway
configuration 4R | 4L in year 2007. . . 275 F.7 Prediction statistics for individual taxi-out times for EWR runway configuration 4R
| 4L. . . 276
G.1 Unimpeded taxi-out time estimates for PHL runway configuration 26, 27R, 35 | 27L, 35 in year 2011. . . 281 G.2 Aggregate taxi time predictions for PHL runway configuration 26, 27R, 35 | 27L, 35
in year 2011. . . 283 G.3 Prediction statistics for the congestion state and the throughput for PHL runway
configuration 26, 27R, 35 | 27L, 35 in year 2011. . . 284
H.1 CLT aggregate average runway throughput before and after the capacity expansion for the south flow configuration (AC/15 min). . . 291 H.2 CLT aggregate average runway throughput before and after the capacity expansion
for the north flow configuration (AC/15 min). . . 291 H.3 CLT aggregate runway operational throughput improvement in 2010-2011, relative
to the operational throughput in 2009. . . 292 H.4 CLT aggregate taxi times in years 2007-2011. . . 293
H.5 CLT aggregate taxi-out time predictions for the north flow configuration during the years 2007-2011. No new runway is assumed in the model predictions. . . 295 H.6 CLT aggregate taxi-out time predictions for the north flow configuration for the years
2010-2011. . . 296 H.7 CLT predicted taxi-out time and taxi-out delay reduction for the north flow
config-uration in 2010 and 2011 . . . 297 H.8 CLT aggregate taxi-out time predictions for the south flow configuration in years
2007-2011. No new runway is assumed in the model predictions. . . 302 H.9 CLT aggregate taxi-out time predictions for the south flow configuration for the years
2010-2011. . . 302 H.10 CLT predicted taxi-out time and taxi-out delay reduction for the south flow
Chapter 1
Introduction
The significant increase in air traffic demand in the United States over the past two decades has been accompanied by an increase in flight delays. A detailed analysis of domestic air traffic delays in 2007 by the Joint Economic Committee of the U.S. Senate found that these delays had a $41 billion impact on the nation’s economy [65]. The study also estimated that while the major portion of these delays were absorbed when flights were still at their gates, 20% of the delays were incurred as flights were taxiing out to the runway. While some delays, such as those due to extreme weather events, are unavoidable, others can be significantly decreased through better planning and control. Delays caused by an imbalance between available capacity and demand, or delays due to congestion, fall into this category. Operational data shows that in the past decade, more than 15% of National Airspace System (NAS) flight delays have been due to terminal-area volume, or congestion around airports [43]. These delays were incurred when the airports were operating in their optimum configuration, and there were no other impacting conditions. Delays at major airports have also been seen to propagate to large parts of the system [93]. In addition to the increased taxi-out times and delays, airport congestion results in increased fuel burn, emissions, and noise and air quality impacts [21, 82, 85, 107, 129]. The overarching objective of this thesis is the development of approaches for the reduction of the adverse impacts of airport congestion, through the analysis, modeling, and control of the departure process.
1.1
Motivation
Airport surface congestion has several undesirable impacts, the most noticeable of which is the increase in taxi-out times. An analysis of operations in the year 2007 at John F. Kennedy (JFK),
Newark Liberty (EWR) and Philadelphia (PHL) airports showed that they experienced surface congestion, that is, there were more than enough active flights to sustain departure throughput at the airport, 10% to 20% of the time (we will formalize this notion of congestion later in this thesis) [108]. During these periods of congestion aircraft also experienced very high taxi-out times. For example, even under Visual Meteorological Conditions (VMC), the average taxi-out time at JFK was 56 min when the airport was congested, while the unimpeded taxi-out time at JFK was only 16 min in VMC. Similarly, the average taxi-out time at PHL was 38 min when the airport was congested in VMC, while the unimpeded taxi-out time was only 12 min [108].
Figure 1-1 shows the nature of surface congestion during evening operations at PHL1 [102].
Aircraft taxiing out are depicted in green, and aircraft taxiing in are shown in red. Runway 27L, highlighted with a green arrow, is the departure runway and Runway 27R, highlighted with a red arrow, is the arrival runway. There are approximately 22 aircraft (AC) in the three queues forming near the threshold of the departure runway. We note that it is quite difficult to quantify the exact length of the departure queue, as the 35 aircraft taxiing out seem to be dispersed across multiple taxiways.
Figure 1-1: Departure queue of Runway 27L at PHL [102].
We use data from the Aviation System Performance Metrics (ASPM) database [38] of the
1
The visualizations used surface surveillance data from the Airport Surface Detection Equipment – Model X, or ASDE-X system [37].
Federal Aviation Administration (FAA) to further investigate the congestion problem at PHL. In the upper plot of Figure 1-2, we show the average number of pushbacks and the average number of takeoffs (or departures) that was recorded during each 15-minute time window for all days that this runway configuration was in use in 2011. We also show the average departure capacity of this runway configuration of PHL, which is estimated to be 13 AC/15 min, as it will be shown in this thesis. This plot illustrates the imbalance between pushback rate and departure rate. While the average departure throughput is constrained by the capacity of the airport, the demand (pushback rate) can be much higher. The impact of this imbalance on taxi-out times is seen in the lower plot of Figure 1-2, where the average taxi-out times for the flights that pushed back in each 15-minute time window are shown. The figure clearly shows the correlation between excessive pushback rates and large taxi-out times.
6 8 10 12 14 16 18 20 22 0 5 10 15 20 Operations /15 min 6 8 10 12 14 16 18 20 22 0 5 10 15 20 Local time Pushbacks/ 15 min 6 8 10 12 14 16 18 20 22 0 10 20 30 40 Taxi−out time Pushbacks Departures Capacity
Figure 1-2: Average number of pushbacks, average number of takeoffs and departure capacity per 15 minutes at PHL in 2011 (top); Average number of pushbacks per 15 minutes and average taxi-out times (bottom).
Figure 1-2 summarizes some of the challenges that motivate the work in this thesis. The first question relates to the estimation of the departure capacity of an airport and its distribution under different conditions. It is also desirable to identify opportunities for its improvement, since it is well known that a small increase in capacity can yield large reduction in taxi-out delays [30, 57]. The characterization of the relationship between airport congestion and taxi-out delays is the next objective. Understanding this relationship would help us predict the taxi-out delays that result from the imbalance between demand and capacity, as shown in Figure 1-2. The final challenge is the development of control algorithms that will reduce the impacts of ground congestion, by appropriately regulating pushbacks. Our ultimate goal is to develop tools for the current system that improve the efficiency and predictability of the departure process, and thereby reduce excessive taxi-out times and the associated costs (fuel burn, emissions and controller workload). The proposed approaches do not assume the presence of perfect information and 4D trajectory conformance, but instead try to achieve efficient planning under existing conditions and levels of technology.
1.2
Background and literature review
1.2.1 Characterization of airport capacity
Quantifying the number of arrivals and departures that can be serviced at an airport is important for both strategic planning purposes and tactical air traffic management. Airport capacity is one of the most important inputs for air traffic flow management programs employed in practice by the FAA [34] and proposed in research [12, 121]. It is also the fundamental input for studies aimed at addressing the costs of air traffic delays [94, 125]. Despite the importance of the runway capacity, there is no method available for a simple, consistent and generalizable quantification of airport capacity. Instead, the FAA relies on heuristic estimates of runway capacity based on controller experience and facilities’ preferences [40, 41].
Despite the usefulness of the current rules derived by operational experience, the lack of a scientific approach in assessing the capacity of an airport can lead to misconceptions. For example, recent slot limitations at EWR restricted the total number of movements in the airport to 81 movements/hour without differentiating between arrivals and departures [36]. However, this thesis will show that the capacity of EWR is best defined as a function of departure and arrival capacity, and not merely their sum. Another common approach is to study congestion pricing under the assumption that all users impose the same external marginal cost on other users, all else being
equal [35]. However, this thesis will show that the external marginal cost of a specific type of user can differ significantly depending on the specifics of the airport. Such differences must be identified before being used for the design of policy instruments.
Runway capacity estimation
It has been shown that the most fundamental quantity that characterizes the performance of the airport is its runway capacity, since the main throughput bottleneck at an airport is the runway system [61]. Along the same lines, runway capacity has been shown that it is the predominant cause of the most extreme instances of delays [8]. Thus, the capacity of an airport is in most cases synonymous of the capacity of the runway system.
The most influential work in the area of the empirical measurement of the capacity of an airport is that of Gilbo [49], in which he proposed a quasi-statistical procedure for estimating the capacity envelope of a single airport, for a given runway configuration. 15-minute arrival and departure counts were used to estimate the capacity envelope as the convex hull of the scatter of the counts after correcting for outliers. Frequency-based filtering was employed to eliminate outliers. Along similar lines, Ramanujam and Balakrishnan proposed a systematic statistical approach for estimat-ing intra- and inter-airport capacity envelopes from observed data by applyestimat-ing quantile regression [97]. In the above-referenced papers, the capacity envelope was estimated using statistically sig-nificant maximum counts of the movements. These estimated counts are probably achievable only under certain circumstances, such as a favorable fleet mix, or favorable operations sequencing. Thus, the estimated values do not represent expected number of movements, but rather the upper bounds for the number of movements. In addition, these estimates of airport capacity do not reveal its variance, caused by factors such as fleet mix, weather and airspace restrictions.
Theoretical methods have also been employed for measuring the capacity of the runway system [30]. However, they heavily rely on stylized models and assumptions which tend to vary among different airports. One such example is that wake vortex separation is the prevalent determining factor for the departure capacity. It turns out, that in many cases, airspace constraints are more important than wake vortex separation constraints, as it will be shown in this work. Thus, in certain cases, stylized models can over-estimate the capacity. Theoretical models provide a very good benchmark for identifying opportunities for improvement by comparing their estimates to the empirical ones [64].
New York Metroplex capacity estimation
A critical component of the NAS is the airport system of New York, comprising John F. Kennedy International Airport (JFK), Newark Liberty International Airport (EWR), LaGuardia Airport (LGA), and smaller regional airports. According to the Government Accountability Office (GAO), 41% of total delayed departures and 47% of the total delay in the NAS in 2009 were attributed to the three major US airports (JFK, EWR and LGA) [124] . In response, the Regional Plan Association laid out a comprehensive plan with options for adding capacity and reducing delays in New York airspace [130]. Many researchers have recommended several solutions for improving the imbalance between demand and capacity in the three New York airports [9, 93, 126]. Despite the great level of interest that the major New York airports have attracted from the operations, research and policy communities, few systematic studies have estimated the capacity of the individual airports as well as the Metroplex.
1.2.2 Modeling of departure operations
Prior work on the modeling of the departure process at airports can be broadly classified into three groups. The first group focuses on computing runway-related delays under dynamic and stochastic conditions [71, 81, 94]. This runway-centric approach is justified by the observation that the main throughput bottleneck at an airport is the runway system [61]. This approach views the runway complex of an airport as a queuing system whose customers are aircraft that need to land or takeoff. The models are then used to predict the expected system behavior, and their results are typically most useful for long-term planning (for example, estimating the expected reduction in delays from the construction of a new runway), or for estimating the network propagation of local disruptions, such as thunderstorms. However, their level of abstraction is too high for studying taxi-out reduction algorithms, or for predicting taxi-out times for individual flights. For this reason, these models are typically used to estimate “treatment effects” in the entire NAS. The models are used to calculate a baseline and then estimate the effect of network modifications, disruptions to the system, scenarios of traffic demand, future technologies, or next-generation operations by comparing the results of the test scenario to the baseline scenario. However, the simplifying abstraction of modeling the airport as a runway server may influence these calculations. Recent research has also shown that airspace constraints and downstream restrictions can also lead to significant delays in the NAS [31, 32, 100]. In addition, these models use a Poisson process for modeling the aircraft
service requests at the runway server, which may be an appropriate approximation for landings [128], but has not been validated for departures. Recently, it was shown that simulating the service requests with a less random process, that is, one with smaller support and variation around the expected value, predicts both expected delays and their variability in congested airports [62].
The second category of prior research focused on predicting taxi-out times. Shumsky developed a model to predict taxi times using a variety of explanatory variables such as the airline, the departure runway and departure demand [104, 105]. He also developed a queuing model for the runway service process. However, the queuing model was based on cumulative behavior and did not reflect the stochastic nature of the process [104]. Idris et al. analyzed the main causal factors that affect taxi times and based on this analysis, they developed a statistical regression model to predict taxi times [58], as part of Departure Planning Project [47]. That work did not explicitly model the runway service process, and so could not link the excessive taxi times with the capacity constraints. It could therefore not be used for strategic surface flow management applications such as the one considered in this thesis, where we like to consider gate-to-runway traffic states, and determine how surface queues can be managed in order to reduce taxi-out times.
In contrast, Pujet et al. extended some these notions to predict taxi times using a simple stochastic queuing model [92]. They assumed that an aircraft needs a certain (fixed) amount of time, defined to be the travel time, to reach the departure runways. In their model, upon reaching the departure runways, aircraft line up in the runway queue, where they get served by the runway server according to a probabilistic service process. Pujet et al. estimated the travel time for each flight based on several casual factors and also modeled the probabilistic service process. Given a pushback schedule, the estimated taxi-out time is the sum of travel time and the wait time for service (takeoff) at the runway queue. In earlier work, we provided with a more complete queuing model of the departure process, by using better unimpeded taxi-out time estimations, new models for the runway server(s) and the ramp and taxiway delays [107]. However, none of the above surface models account for the impact of arrivals nor the air traffic flow management programs, although it has been shown that they have a high impact on taxi-out times [59]. In addition, these models simulate the runway service process using random number generators and thus the output is just a random sample path. Multiple runs are necessary in order to obtain statistically significant estimates.
Based on the progress of work on surface models, some queuing models of the NAS have tried to incorporate a ground component instead of just modeling the airport as a runway server [24, 79, 127].
In particular, the Detailed Policy Assessment Tool (DPAT) built on this approach by adding a stochastic component for the taxiway related delay [127]. This resulted in the first system-wide model to include delays that are not related to the runway queuing time. However, the runway module of DPAT is a deterministic one and the taxiway delay is a user-input. It is not shown how it can be derived, or modeled to reflect the actual taxiway-related delays. In LMINET [79], taxiway delays are modeled by an M/M/1 queue. The assumption that the taxiway system can be modeled as a single server with exponential service rate is debatable. Moreover, the runway related delay model in LMINET is not validated by empirical data. In summary, both DPAT and LMINET suffer from oversimplifying assumptions in the runway-and-taxiway-related delay estimation, representation and prediction. It must be noted that the airport modules of these models have not been fully validated. We hypothesize that such models will not be able to predict taxi out times accurately and as a result, delays may be estimated inaccurately. This inaccuracy may also result in errors in the estimation of the network-wide effects of airport delays.
Finally, a third body of work involves the microscopic modeling of all airport components, such as the Airport and Airspace Simulation Model (SIMMOD) and the Total Airspace and Airport Modeler (TAAM) [87]. These tools model the layout of an airport, the operating rules for every aircraft type, and the dynamics of every gate, taxiway and runway with high fidelity. They need extensive adaptation of both the airport layout and the traffic scenarios so as to generate statistically significant results. It is therefore difficult to use them to perform a probabilistic analysis of the departure process or to test new strategies, such as control of the departure process for emissions reduction, because this would require simulating them over long periods of time [87].
Unimpeded taxi-out estimation
There has been relatively little prior analysis of unimpeded taxi times at airports. Unimpeded taxi-out times are very crucial in understanding the performance of the airports [108], as they need to be subtracted from taxi-out times in order to estimate taxi-out delays. They are also crucial for modeling the departure process.
The FAA defines the unimpeded taxi-out time as the taxi-out time under optimal operating con-ditions, when neither congestion, weather nor other factors delay the aircraft during its movement from gate to takeoff [88]. The unimpeded taxi-out time is redefined in terms of available data as the taxi-out time when the departure queue is equal to one and the arrival queue is equal to zero. A linear regression of the observed taxi-out times with the observed departure and arrival queues is
then conducted, and the unimpeded taxi-out time is estimated from the linear regression equation by setting the departure queue equal to 1 and arrival queue equal to 0 [46].
Idris et al. [58] observed that (1) there is poor correlation of the taxi-out times with arriving traffic, and (2) the taxi-out time of a flight is more strongly correlated with its takeoff queue than the number of departing aircraft on the ground. The exact dependence of the taxi-out time of an aircraft with the takeoff queue, and how this dependence can be used for estimating the unimpeded taxi-out time, both remain unanswered questions.
Nevertheless, researchers have proposed solutions for better estimating the unimpeded taxi-out time [20, 92]. However, all of these methods are heuristic improvements of the FAA method. For example, Pujet [92] extended the method of FAA to consider a range of values 0-2 of the departure queue. He also derived distributions instead of point estimates. We used a method based on the concept of the takeoff queue, but we assumed normally distributed errors around the estimated value [107]. However, it is known that unimpeded taxi-out times are not normally distributed in practice [70, 92].
We also note that the recently available ground surveillance (ASDE-X) data enabled the ex-traction of unimpeded taxi-out times by directly estimating the time an aircraft needs to cross a taxiway link conditioned on this link being free of other traffic [70, 77]. ASDE-X coverage is poor in the ramp area, and thus it renders ASDE-X data use unreliable for extracting the unimpeded travel time from the gate to runway. In addition, we would like to develop a more general method which does not need to rely on readily-available ASDE-X data capability.
1.2.3 Optimization of the departure process Taxi-out time optimization
In most recent research, the control of the airport departure process is formulated as a surface traffic optimization problem [75]. In these formulations, the airport taxiway system is modeled as a network of links and nodes. In this node-link model, nodes represent significant control points on the airport surface, such as gate locations, runway entry and exit points, intersections of taxiways, and holding spots for clearance. The taxiway segments between two points on the surface are represented as links between the respective nodes. Flights get routed through the network from a starting to an ending point. If the flight is a departure, the starting point is its gate and the ending point is the assigned departure runway. The surface traffic optimization problem is formulated as
a scheduling or routing problem for the flights through the network. The objective of this problem is to minimize taxi delay given a runway schedule. The optimization is performed by choosing between alternative routes through the network, by scheduling the passage times on the nodes, or a combination of both.
This optimization problem is typically solved as a Mixed Integer Linear Programming (MILP) problem. Smeltink et al. were the first ones to develop a MILP model to determine the movement of taxiing aircraft and meet basic safety and operational constraints for the Amsterdam airport [115]. The model, however, had long computation times and missed some constraints such as the runway occupancy time. Rathinam et al. improved Smeltink et al.’s model and applied their approach to simulations at Dallas Fort Worth (DFW) airport [98]. They incorporated more oper-ational constraints, such as the aircraft type for wake vortex separation requirements. However, the model, tested with empirical data, showed very long computation time for high density traffic. Balakrishnan and Jung proposed an integer programming formulation for optimizing surface opera-tions at DFW by adapting the Bertsimas and Stock-Patterson formulation [12] for the Traffic Flow Management Problem [7]. Through simulations with actual DFW airport data, they evaluated two strategies for improving the taxi times; controlled pushback and taxiway reroutes. This model im-proved the formulation for the surface operations optimization and its computational performance, but did not account for several operational restrictions such as overtaking constraints and collision avoidance at intersections. This formulation was further refined by Lee and Balakrishnan who considered additional operational constraints [75].
This problem has, in its general form, been shown to be NP-hard [12, 115]. Practical imple-mentations consider scheduling a small number of operations, typically 20-30 flights at a time. The problem of scheduling a day of traffic at an airport is recast as a rolling-horizon problem, with a typical horizon being 15 minutes. In other words, the solutions are open-loop policies subject to periodic reoptimization. It is not clear how suboptimal the rolling-horizon solution is with respect to the global solution. The robustness of the optimal solutions has not been extensively investi-gated. In addition, perfect information of the location and the intent of all aircraft on the surface, deterministically known schedules, and, in many cases, ability of the decision maker to instanta-neously set and change aircraft states and speeds are assumed. It is not analyzed how well these algorithms would perform in a dynamic environment in the presence of uncertainties, or unexpected events, such as an aircraft taking too long to pushback, a mechanical problem, a datalink failure, a safety incident, a temporary runway closure, etc. In related work, we have shown that applying the
optimized schedule without enforcing pilot conformance to the specified arrival time at the network nodes can end up being suboptimal even compared to current operations [76].
There has been little work on the stochastic optimization of the taxiing operations. One possible reason for this is that the variability of the underlying processes is of the same order of magnitude as the quantity to be optimized. For example, if the duration of the pushback process is uniformly distributed between 2 and 5 minutes, and the optimized taxi-times are in the order of magnitude of 15 minutes, it may be very hard, or not really useful to formulate the problem as a stochastic routing problem through a network where inter-arrival times at successive nodes are as short as 30 seconds. Another challenge is that the computation requirements of the stochastic formulation of this problem can be prohibitive.
There have also been a few alternative, non-MILP formulations to this routing problem. For example, Gotteland et al. use genetic algorithms to choose between alternative taxi routes [50], and Trani et al. use Time-Dependent Shortest Path techniques [122]. However, little has been shown about the optimality, performance or robustness of these approaches.
Optimization of runway operations
A problem closely linked to the control of taxi times is that of runway operations scheduling. Clearly, a more favorable runway schedule yields higher throughput and consequently shorter taxi times for the aircraft in the sequence. In contrast, bad sequencing at the runway will mean higher taxi times for everyone and could diminish any benefits of taxi-out time optimization or control.
Nowadays, runway scheduling at all major airports is mostly done on first-come-first-serve (FCFS) basis. Air traffic controllers consider heuristic deviations from the FCFS discipline in order to increase departure throughput2. For example, in Figure 1-1, we observe three queues feeding the
departure runway. Air traffic controllers at PHL feed aircraft in different queues so as to increase opportunities for dispersal headings and improve the departure throughput of the airport [99].
In the research literature, the problem of scheduling runway operations has been particularly studied for the case of landings. It has been shown that the problem of optimal runway operations sequencing is in its general form NP-hard [10]. However, for practical applications, one only needs to consider deviations from the FCFS discipline only within a specified maximum number of positions. Such a policy is called constrained position shifting (CPS). The CPS problem has complexity that scales linearly with the number of aircraft [6]. The CPS framework has also been extended for
2
robust runways operations planning allowing for uncertainty in the estimated time of arrival (ETA) of an aircraft [22].
The problem of scheduling and sequencing departures at a runway exhibits significant differences from the problem of landings. In the case of the landings, all aircraft are airborne and have an ETA at the runway. This ETA can be assumed to be deterministic or probabilistic and the scheduling and sequencing can be efficiently formulated as a dynamic programming recursion, as discussed previously [6, 22]. However, in the case of departures, the ETA of aircraft at the runway is also a decision variable. If a taxiway planner is available, it will attempt to minimize taxi times by delaying flights at the gate as long as possible. Furthermore, estimating the time of arrival at the runway of a departing aircraft after clearing it for pushback is a much harder problem. As we shall see, the inherent uncertainties are much larger. These systematic uncertainties are mitigated today by ensuring that there is a large pool of aircraft available for takeoff. This is at odds with the taxiway planner, which would attempt to minimize the number of aircraft on the surface. Finally, departures scheduling has occasionally to be traded with other events, like runway crossings, or arrivals scheduling. These additional constraints are absent from the arrivals scheduling problem, because arrivals are by default given priorities over these events.
There is relatively little work in the literature addressing the peculiarities of the departure scheduling problem. Anagnostakis et al. addressed some of them, by incorporating constraints such as runway crossings, minutes in trail, miles in trail and Expect Departure Clearance Time (EDCT) requirements in the departures scheduling problem [1, 2, 3]. In particular Anagnostakis and Clarke proposed a two stage solution approach: In the first stage, the optimal weight class sequencing is heuristically determined. In the second stage, individual aircraft are assigned to available weight class slots. The first stage maximizes throughput and the second stage minimizes individual aircraft delay [1, 2]. Balakrishnan and Chandran proposed algorithms for departure scheduling in the presence of position shift constraints [5]. However, the suggested heuristics and algorithms were deterministic planning tools. More recently, a stochastic departure runway planning tool was proposed by Solveling et al. [117] extending the two-stage deterministic approach proposed by Anagnostakis and Clarke. This was the first stochastic planning tool tailored to the problem of departures scheduling addressing the uncertainty of the pushback process, the taxiing process and the time of arrival of landing aircraft. Nonetheless, it did not incorporate restrictions from air traffic flow management programs. Additionally, the proposed algorithm had very high computational cost, and an approximate solution could be found only for small sequences of flights, such as eight
![Figure 1-1 shows the nature of surface congestion during evening operations at PHL 1 [102].](https://thumb-eu.123doks.com/thumbv2/123doknet/13986033.454633/30.918.108.812.569.962/figure-shows-nature-surface-congestion-evening-operations-phl.webp)