Publisher’s version / Version de l'éditeur:
Vous avez des questions? Nous pouvons vous aider. Pour communiquer directement avec un auteur, consultez la première page de la revue dans laquelle son article a été publié afin de trouver ses coordonnées. Si vous n’arrivez pas à les repérer, communiquez avec nous à [email protected].
Questions? Contact the NRC Publications Archive team at
[email protected]. If you wish to email the authors directly, please see the first page of the publication for their contact information.
https://publications-cnrc.canada.ca/fra/droits
L’accès à ce site Web et l’utilisation de son contenu sont assujettis aux conditions présentées dans le site
LISEZ CES CONDITIONS ATTENTIVEMENT AVANT D’UTILISER CE SITE WEB.
Internal Report (National Research Council of Canada. Division of Building
Research), 1970-11-01
READ THESE TERMS AND CONDITIONS CAREFULLY BEFORE USING THIS WEBSITE.
https://nrc-publications.canada.ca/eng/copyright
NRC Publications Archive Record / Notice des Archives des publications du CNRC : https://nrc-publications.canada.ca/eng/view/object/?id=8a7fb5c8-3495-4f1d-a842-42d3f31d4cfa https://publications-cnrc.canada.ca/fra/voir/objet/?id=8a7fb5c8-3495-4f1d-a842-42d3f31d4cfa
NRC Publications Archive
Archives des publications du CNRC
For the publisher’s version, please access the DOI link below./ Pour consulter la version de l’éditeur, utilisez le lien DOI ci-dessous.
https://doi.org/10.4224/20331620
Access and use of this website and the material on it are subject to the Terms and Conditions set forth at
Dynamic testing of cast-in-place piles
NATIONAL RESEARCH COUNCIL O F CANADA DIVISION O F BUILDING RESEARCH
DYNAMIC TESTING O F C A S T - I N - P L A C E P I L E S b y R . H. F e r a h i a n I n t e r n a l R e p o r t No. 3 7 9 of t h e Division of Building R e s e a r c h OTTAWA N o v e m b e r 1970
DYNAMIC TESTING O F CAST-IN-PLACE PILES by
R. H. F e r a h i a n
P R E F A C E
The p r e s e n t r e p o r t i s a sequel to DBR I n t e r n a l R e p o r t No. 376 and r e p o r t s the r e s u l t s of dynamic testing of two 20-in. d i a m e t e r F r a n k i piles, one with a built-in fault. F o r the p i l e s tested the u s e of a x i a l dynamic i m p a c t i m p a r t e d to the pile top did not p r o v e to b e a p r a c t i c a l l y s e n s i t i v e indication of pile defect. Before f u r t h e r full- s c a l e t e s t s a r e m a d e i t i s recommended that a s e r i e s of m o d e l t e s t s be undertaken to provide guidance f o r the m o s t promising method of diagnostic testing of piles.
OTTAWA
November 1970
N. B. Hutcheon
DYNAMIC TESTING O F CAST-IN-PLACE PILES
R. H. F e r a h i a n
DBR I n t e r n a l R e p o r t No. 376 ( 1 ) d e s c r i b e d the dynamic testing of a F r a n k i c a s e d c a i s s o n 18 in. i n d i a m e t e r and 30 f t long. The
p r e s e n t r e p o r t p r e s e n t s the r e s u l t s of dynamic testing of two 21 -in. (20-in. nominal) d i a m e t e r F r a n k i piles 44 and 55. 5 f t long m e a s u r e d to the top of the bulb. The longer pile had a built-in fault, which was a reduction of the c r o s s - s e c t i o n a l a r e a by 50 p e r c e n t over a 2-ft length, t h e middle of which was located approximately 15 f t above the bulb. A c e n t r a l a x i a l impact was i m p a r t e d to the piles, a s d e s c r i b e d in R e p o r t No. 376, f r o m a 108-lb m a s s falling f r e e l y through 2 ft. Comparison of the r e s p o n s e of the two p i l e s provides a b a s i s f o r judg- ing the sensitivity of this method of detecting faulty piles.
EXPERIMENTAL PROCEDURE
F i g u r e 1 shows a group of F r a n k i piles, including the good pile tested. The faulty pile was constructed outside the 10-ft deep excava- tion shown in this figure, the r e a s o n f o r the difference in the length of two piles. The s o i l profile f o r a borehole approximately 10 f t away f r o m the good pile i s given in F i g u r e 2. The s t a t i c load t e s t r e s u l t s f o r the good pile a r e given in F i g u r e 3.
The piles t e s t e d w e r e 20 in. 0. D. A 7000-Ib h a m m e r falling
through 20 f t was used to d r i v e the pile tube ( m a d e of l i t ! thick s t e e l ) into the ground by i m p a c t s applied to a c o n c r e t e plug a t the driving end of the tube. Once the d e s i r e d depth had been r e a c h e d (approximately 44 f t f o r the sound pile and 55 f t f o r the faulty pile), the s t e e l tube was lifted a few inches and held while the h a m m e r was dropped onto the plug, c l e a r i n g the driving end of the tube. Dry c o n c r e t e was then placed in t h e tube and f o r c e d by the h a m m e r to d i s p l a c e the s o i l and f o r m a bulb of approximately 10 c u f t a t the bottom of the tube. A reinforcing c a g e
3
( i n t e r n a l d i a m e t e r 14$ i n . , e x t e r n a l d i a m e t e r 16$ in. ) of five
,-
in. d i a m e t e r b a r s with $-in. s t i r r u p s was lowered into the tube. Dry con- c r e t e was placed in s m a l l quantities in the tube and h a m m e r e d into place while the tube was gradually pulled out until the pile was fully f o r m e d .The built-in f a u l t was incorporated i n the second pile by attaching inside the cage a s h e e t m e t a l sleeve, 24 in. long, 15 f t f r o m the bottom of the cage. The s l e e v e had lip f o r m a t i o n s a t both ends long enough to c o m e in contact with the inside of the tube, thus preventing the c o n c r e t e f r o m getting into a n e x t e r n a l annulus equal to approximately 50 p e r c e n t of the c r o s s - s e c t i o n a l a r e a of the pile.
RESULTS AND DISCUSSION
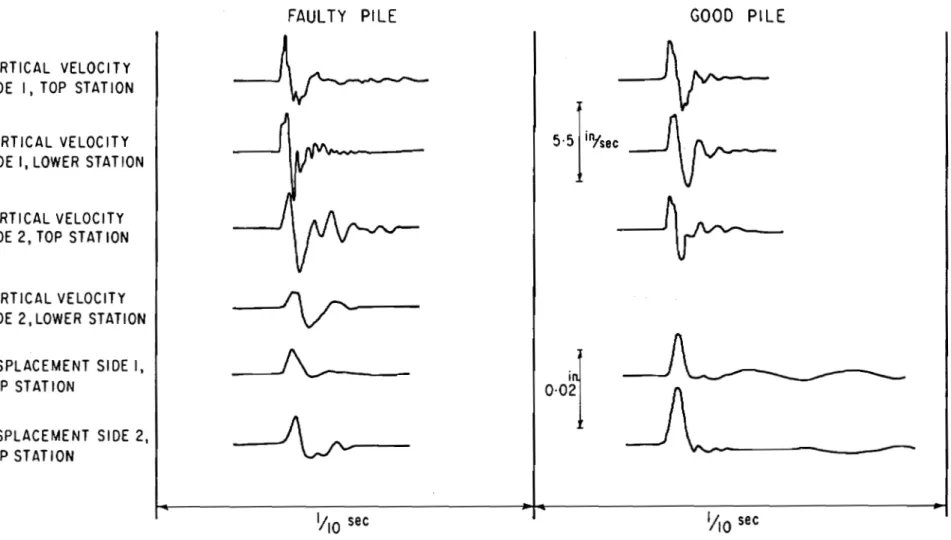
Vibration r e c o r d s a r e p r e s e n t e d on F i g u r e s 4, 5, 6 and 7. The r e c o r d s of the r e s p o n s e of both the good and the faulty p i l e s a r e shown on the s a m e f i g u r e s f o r e a s e of c o m p a r i s o n . A v a r i a t i o n of a s m u c h a s
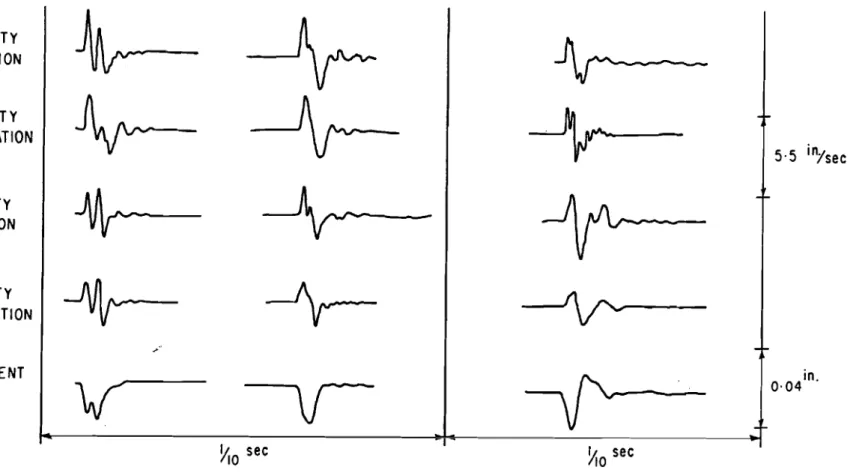
f 20 p e r c e n t in the vibration l e v e l s of the p i l e s was o b s e r v e d f o r dif- f e r e n t i m p a c t s of the h a m m e r , mainly due to slight v a r i a t i o n s i n the axiality of the impact and the height of the f r e e f a l l of the h a m m e r . F r o m examination of the r e s p o n s e of the good pile ( F i g u r e 5 and Table I) i t m a y c l e a r l y be s e e n that the frequency content of the two r e c o r d s c a n b e m a r k e d l y different even though the m a x i m u m vibration amplitudes a r e p r a c t i c a l l y the s a m e . F r o m Table I i t m a y b e s e e n that f r e q u e n c i e s d e - duced f r o m the velocity r e c o r d s c a n have a s c a t t e r of 30 p e r c e n t (100 p e r cent in one instance). F o r the d i s p l a c e m e n t r e c o r d s , the s c a t t e r was found to b e l e s s than f o r the velocity r e c o r d s .
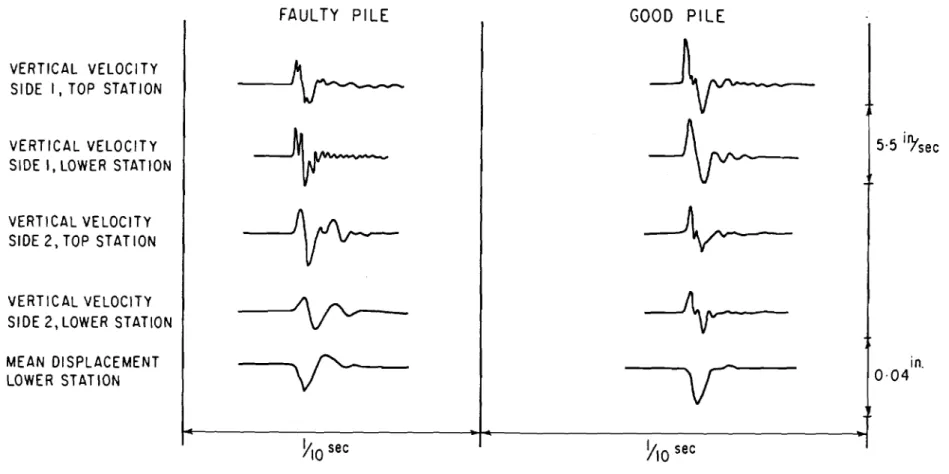
O v e r - a l l s c a t t e r was l e a s t a t the lower station of m e a s u r e m e n t , this being one d i a m e t e r (21 in. ) below the pile top. The m e a n d i s p l a c e m e n t r e c o r d s a t the top and lower stations w e r e the s i m p l e s t in f o r m and showed a m a x i m u m s c a t t e r of only 20 p e r cent. I t i s recommended, t h e r e f o r e , that f o r p o s s i b l e f u t u r e extensions of this work the m e a n d i s p l a c e m e n t b e monitored a t a section one d i a m e t e r below the pile top. The m e a n d i s - p l a c e m e n t s a t a section w e r e d e t e r m i n e d by integrating the r e s u l t of a d - ding e l e c t r i c a l l y the velocities m e a s u r e d a t both s i d e s of the pile.
Comparison of the amplitudes of vibration of the good and faulty p i l e s shows that they a r e usually not different by m o r e than 20 p e r cent, with no c o n s i s t e n t indication a s to which h a s a g r e a t e r r e s p o n s e . The f r e q u e n c i e s of vibration of the good and faulty p i l e s a r e usually not m o r e than 50 p e r c e n t different f r o m e a c h other; the difference is 20 p e r c e n t when the m e a n d i s p l a c e m e n t s a r e compared. Keeping in mind that the faulty pile was 25 p e r cent longer than the good pile and a s s u m i n g a con-
s t a n t density of c o n c r e t e f o r both (155 psf), then the f r e q u e n c i e s of the two p i l e s ( a s s u m e d f i x e d - f r e e columns a s d e s c r i b e d i n DBR I n t e r n a l Re- p o r t No. 376) will b e i n v e r s e l y proportional to t h e i r lengths and d i r e c t l y proportional to the s q u a r e r o o t of t h e i r Young's moduli.
I t i s e s t i m a t e d that the s t a t i c Youngt s Moduli f o r the c o n c r e t c a t the t i m e of testing w e r e a s follows:
-6
Faulty Pile* Elevation (ft) E-Static Young! s Modulus x 10 ( p s i )
180 5 . 0
2 05 5 . 3
230 6. 8
*Elevation f o r the bottom of the c a g e is 179 f t - 4 in.
Good P i l e + Elevation (ft) E-Static Young's Modulus x 10 - 6 ( p s i )
+Elevation f o r the bottom of the cage i s 180 f t
-
9
in.Elevation a t pile top 225 f t
-
4 in.The m e a n Young's moduli f o r the good and faulty p i l e s w e r e 7. 0 and 5 . 7 x 10 p s i respectively. The r a t i o s of f r e q u e n c i e s of the good to faulty piles due to differences in length and E would be
" p
- I t m a y be seen, t h e r e f o r e , that in o r d e r to d e t e r m i n e44 7 - 1.10.
the extent of the frequency change resulting f r o m the built-in f a u l t in the pile the f r e q u e n c i e s f o r the good pile should b e reduced by 10 p e r c e n t b e - f o r e the f r e q u e n c i e s of the good and faulty piles a r e c o m p a r e d . F r o m e x - amination of the m e a n displacements of Table I, i t can t h e r e f o r e be con- cluded that the change in frequency of the pile b e c a u s e of the built-in fault i s within the s c a t t e r variation in the f r e q u e n c i e s that c a n be expected f o r different o r s u c c e s s i v e impacts of the h a m m e r on the pile top.
According to Dvorak ( 2 ) necking o r interruption of the c o n c r e t e in the pile c a n be deduced f r o m a n i n c r e a s e in the d i s p l a c e m e n t and a d e c r e a s e in frequency of the pile. F o r the length of pile t e s t e d a 50 p e r c e n t reduction of the c r o s s -section over a length approximately equal to the d i a m e t e r of the pile and a t a depth approximately equal to
$
of the pile length, the m e a n displacements w e r e p r a c t i c a l l y the s a m e f o r both the good and faulty piles and the differences in the f r e q u e n c i e s w e r e within the s c a t t e r of the r e s u l t s . The changes in the m e a n d i s p l a c e m e n t s and f r e - quencies a r e not l a r g e enough to identify the fault. The shape of the m e a n d i s p l a c e m e n t r e c o r d s ( s e e F i g u r e s 5 and 6) does, however, show d i f f e r e n c e s f o r the two piles. The good pile shows only a single downward pulse,w h e r e a s the bad pile shows a full wave. This could, with experience, i n - dicate the fault; m o r e r e s u l t s a r e needed, however, to confirm this trc:nd. CONCLUSIONS
F o r thc length of piles tcstcd (40 to 60 f t ) dynar-nic tcbstinl,: a s t i c . -
s c r i b e d in this r e p o r t does not provide a sensitive indication oi a pilc d(:- f e c t (reduction of c r o s s - s e c t i o n a l a r e a by 50 p e r c e n t ) in the lowest
q u a r t e r of the pile. The difference in the f r e q u e n c i e s of the good and faulty piles i s well within the s c a t t e r r a n g e expected in the dynamic testing of p i l e s . RECOMMENDATIONS FOR FUTURE WORK
Before f u r t h e r f u l l - s c a l e s t u d i e s a r e made, i t i s recommended that a s e r i e s of model t e s t s b e undertaken to provide guidance to the m o s t
p r o m i s i n g diagnostic testing of p i l e s . I t i s possible that the method d e s c r i b e d in this r e p o r t m a y prove s a t i s f a c t o r y f o r s h o r t e r piles and f o r defects in the top q u a r t e r . The suitability of other methods of excitation such a s t o r s i o n applied to the pile top should be ex- amined.
ACKNOWLEDGEMENT
The a u t h o r ' s thanks a r e h e r e extended to M r . Gordon McRostie, McRostie Seto Genest and A s s o c i a t e s L t d . , who suggested this p r o j e c t and m a d e the p i l e s available f o r testing.
REFERENCES
1. F e r a h i a n , R. H. Dynamic testing of c a s t - i n - p l a c e p i l e s . National R e s e a r c h Council of Canada, Division of Building R e s e a r c h , I n t e r n a l R e p o r t No. 376, A p r i l 1970, 3 1 p.
2. Dvorak, A . Dynamic t e s t s of p i l e s and the verification of r e s u l t s
by s t a t i c loading t e s t s . Aeta Technica Academiae S c i e n t i a r i u m
T A B L E I E S T I M A T E D LOWEST PREDOMINANT F R E Q U E N C I E S (Hz) TOP S t a t i o n F i g u r e 4 F i g u r e 5 F i g u r e 6 F i g u r e 7 L o w e r S t a t i o n F i g u r e 4 F i g u r e 5 F i g u r e 6 F i g u r e 7
I
140 270 13 5 100 140 140 2 10 135 13 0 140 105 9 0 145 130 120 100 190 8 5 100 170 270 135 160 145 130 120 270 13 5 130 150 9 5 100 130 145 130 120B
13 0 100 9 5 9 0 9 0 7 0 80 60 8 0I
8 0 6 0Soil P r o f i l e 1 O f t .
F i g u r e 3 - Static Load T e s t f o r Good P i l e PILE 6.5-17-8 TEST D l A C R A M C A R L E T O N UNIVERSITY A R T S I TOWER M c R O S T l E SETOGENEST b ASSOCIATCS LTD. consuLrl*c r m l r t c t n s o n ~ w ~ YAIICH. ID70 ?COT COYCCLTCD J A Y U A ~ Y n, ~ r m
FAULTY P I L E
GOOD P I L E
VERTICAL VELOCl T Y SlDE I , TOP STATION
VERTICAL VELOCITY SlDE I, LOWER STATION
VERTICAL VELOCITY SlDE 2, TOP STAT ION
VERTICAL VELOCITY SlDE 2, LOWER STATION DISPLACEMENT SIDE I, TOP STATION
DISPLACEMENT SlDE 2, TOP STATION
FIGURE 4
COMPARISON OF RESPONSE OF GOOD AND FAULTY PILES TO CENTRAL VERTICAL IMPACT IMPARTED
TO P l L E T O P BY
A 1 0 8
-
L B MASS FALLING FREELY THROUGH 2 F T
GOOD P l L E
( T W O IMPACT RECORDS 1
FAULTY P l L E
VERTICAL VELOCITY Sl DE I , TOP STAT ION
VERTICAL VELOCITY SlDE I , LOWER STATION
VERTICAL VELOCITY SlDE 2 , TOP STATION
FIGURE
5
COMPARISON. OF RESPONSE OF GOOD AND FAULTY P I L E S TO CENTRAL VERTICAL IMPACT
IMPARTED TO P l L E TOP BY A 108-LB MASS FALLING FREELY THROUGH 2 F T
( MEAN DISPLACEMENT OF TOP STAT IONS
1
B R + ¶ T I -3
VERTICAL VELOCITY SIDE 2,LOWER STATION
MEAN DISPLACEMENT TOP STATIONS
x0
!40 A-'V
-
7- -
l i in. 0.04 --
V E R T I C A L V E L O C I T Y S l D E I, T O P STATION V E R T I C A L V E L O C I T Y S l D E I, LOWER STATION
I
FAULTY P l L E
V E R T I C A L VELOCITY S l D E 2 , LOWER STATION V E R T I C A L V E L O C I T Y SlDE 2 , TOP S T A T I O N M E A N D I S P L A C E M E N T LOWER S T A T I O N+-
GOOD P l L E
IFIGURE
6C O M P A R I S O N OF RESPONSE OF GOOD AND F A U L T Y P I L E S TO C E N T R A L V E R T I C A L
IMPACT IMPARTED TO P l L E TOP BY A 1 0 8 - L B M A S S F A L L I N G FREELY THROUGH 2 F T
( M E A N D I S P L A C E M E N T OF LOWER S T A T I O N S
FAULTY P I L E GOOD P I L E
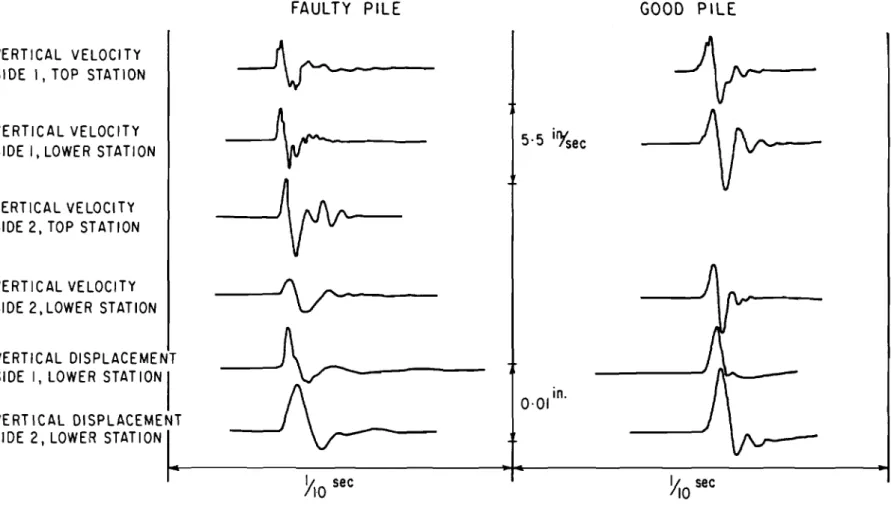
FIGURE
7
COMPARlSlON OF RESPONSE OF GOOD AND FAULTY P I L E S TO CENTRAL VERTICAL IMPACTIMPARTED TO PlLE TOP BY A 1 0 8 - L 8 MASS FALLING FREELY THROUGH
2
FT( D I S P L A C E M E N T S A T L O W E R S T A T I O N S em457a
-
JV E R T I C A L V E L O C I T Y S l D E I , T O P STATION
V E R T I C A L V E L O C I T Y SIDE I, LOWER STATION
V E R T I C A L VELOCITY SlDE 2 , TOP S T A T I O N
V E R T I C A L VELOCITY SIDE 2 , LOWER STATION
V E R T I C A L D I S P L A C E M E N T