HAL Id: hal-00304138
https://hal.archives-ouvertes.fr/hal-00304138
Submitted on 25 Apr 2008HAL is a multi-disciplinary open access
archive for the deposit and dissemination of sci-entific research documents, whether they are pub-lished or not. The documents may come from teaching and research institutions in France or abroad, or from public or private research centers.
L’archive ouverte pluridisciplinaire HAL, est destinée au dépôt et à la diffusion de documents scientifiques de niveau recherche, publiés ou non, émanant des établissements d’enseignement et de recherche français ou étrangers, des laboratoires publics ou privés.
The effect of organic compounds on the growth rate of
cloud droplets in marine and forest settings
N. C. Shantz, W. R. Leaitch, L. Phinney, D. Toom-Sauntry, M. Mozurkewich
To cite this version:
N. C. Shantz, W. R. Leaitch, L. Phinney, D. Toom-Sauntry, M. Mozurkewich. The effect of organic compounds on the growth rate of cloud droplets in marine and forest settings. Atmospheric Chemistry and Physics Discussions, European Geosciences Union, 2008, 8 (2), pp.8193-8242. �hal-00304138�
ACPD
8, 8193–8242, 2008 Droplet growth on organic aerosols from field measurements N. C. Shantz et al. Title Page Abstract Introduction Conclusions References Tables Figures ◭ ◮ ◭ ◮ Back CloseFull Screen / Esc
Printer-friendly Version Interactive Discussion
Atmos. Chem. Phys. Discuss., 8, 8193–8242, 2008 www.atmos-chem-phys-discuss.net/8/8193/2008/ © Author(s) 2008. This work is distributed under the Creative Commons Attribution 3.0 License.
Atmospheric Chemistry and Physics Discussions
The effect of organic compounds on the
growth rate of cloud droplets in marine
and forest settings
N. C. Shantz1, W. R. Leaitch2, L. Phinney3, D. Toom-Sauntry2, and M. Mozurkewich4
1
University of Toronto, Toronto, Ontario, Canada
2
Environment Canada, Toronto, Ontario, Canada
3
Environment Canada, Dartmouth, Nova Scotia, Canada
4
York University, Toronto, Ontario, Canada
Received: 17 March 2008 – Accepted: 2 April 2008 – Published: 25 April 2008 Correspondence to: N. C. Shantz (Nicole.Shantz@ec.gc.ca)
ACPD
8, 8193–8242, 2008 Droplet growth on organic aerosols from field measurements N. C. Shantz et al. Title Page Abstract Introduction Conclusions References Tables Figures ◭ ◮ ◭ ◮ Back CloseFull Screen / Esc
Printer-friendly Version Interactive Discussion
Abstract
Organic matter represents an important fraction of the fine particle aerosol, yet our knowledge of the roles of organics in the activation of aerosol particles into cloud droplets is poor. A cloud condensation nucleus (CCN) counter is used to examine the relative growth rates of cloud droplets for case studies from field measurements on the
5
North Pacific Ocean and in a coniferous forest. A model of the condensational growth of water droplets, on particles dissolving according to their solubility in water, is used to simulate the initial scattering of the droplets as they grow in the CCN counter. Sim-ulations of the growth rates of fine particles sampled in the marine boundary layer of the North Pacific Ocean indicate that the main influence of the marine organic
mate-10
rial on the water uptake rate is from its effect on the size distribution of the sulphate. Simulations of the observations of water uptake on biogenic organic aerosol particles sampled in a coniferous forest indicate an impact of the organic on the water uptake rates, but one that is still smaller than that of pure sulphate. The solubility of the organic becomes an important factor in determining the water uptake as the organic mass
in-15
creases relative to sulphate. The values of the organic component of the hygroscopicity parameter κ that describes the CCN activity were found to be negligible for the marine particles and 0.02–0.05 for the forest particles.
1 Introduction
One of the largest uncertainties in determining the human impact on the global climate
20
is the effect of aerosol particles on clouds or the indirect effect (IPCC, 2007). Atmo-spheric aerosol particles have varying abilities to nucleate cloud droplets depending on the size and composition of the particles. Historically, it was believed that primarily highly soluble inorganic species, such as sulphate and sea salt, contributed to cloud droplet growth. More recently, it has become apparent that organics are a significant
25
ACPD
8, 8193–8242, 2008 Droplet growth on organic aerosols from field measurements N. C. Shantz et al. Title Page Abstract Introduction Conclusions References Tables Figures ◭ ◮ ◭ ◮ Back CloseFull Screen / Esc
Printer-friendly Version Interactive Discussion
organic compounds act as cloud condensation nuclei (CCN), and this contributes to the large uncertainty in the indirect effect (IPCC, 2007). There may be thousands of individual species comprising the organic aerosol fraction and characterization of the organic constituents in the atmosphere has only scratched the surface (e.g., Alves et al., 2001; Carvalho et al., 2003; Gao et al., 2003; Graham et al., 2003; Yu et al., 2005).
5
Because the known organic compounds range from soluble to insoluble (Saxena and Hildemann, 1996), the question of how the particulate organic contributes to cloud droplet growth is more difficult.
The complexity of the organic aerosol has led some, when examining aerosol-CCN and aerosol cloud droplet closure, to assume that all of the aerosol mass was
sul-10
phate. In some cases, this assumption has led to reasonable agreement between the observed number of cloud droplets or CCN (e.g. Conant et al., 2004; VanReken et al., 2003). In other cases, the agreement was relatively poor and a lack of information about organics is one of the explanations (e.g. Kaku et al., 2006; Snider et al., 2003). Some found that the inorganic mass present during the field measurements accounted
15
for the majority of the water uptake or CCN activity and the organic mass did not con-tribute substantially to the water uptake; thus the organic could be assumed to be insol-uble (Broekhuizen et al., 2006; Cantrell et al., 2001; Fountoukis et al., 2007; Lowenthal et al., 2003; Medina et al., 2007; Roberts et al., 2002). Chang et al. (2007) found specific times of high organic mass during the field study when the insoluble organic
20
assumption led to an underestimation in the number of CCN, and it was necessary to assume that water uptake by the organic was significant. Organics have been shown to contribute to water uptake at relative humidities less than 100% (e.g. Dick, 2000; Gysel et al., 2004), and Kreidenweis et al. (2006) suggest that treating the slightly soluble component of the aerosol as either fully soluble or fully insoluble may be the reason
25
why closure has not always been achieved for polluted air in field measurements. Overall, organic particles tend to be less soluble than the major inorganic compounds in the atmospheric aerosol, and this increases the diameter at which an organic particle will activate to a cloud droplet (critical diameter) (Shulman et al., 1996). Organic
com-ACPD
8, 8193–8242, 2008 Droplet growth on organic aerosols from field measurements N. C. Shantz et al. Title Page Abstract Introduction Conclusions References Tables Figures ◭ ◮ ◭ ◮ Back CloseFull Screen / Esc
Printer-friendly Version Interactive Discussion
pounds may also inhibit the condensation of water (e.g. Cantrell et al., 2001; Feingold and Chuang, 2002). On the other hand, organics may decrease the surface tension of a droplet, tending to increase the critical diameter and increasing its ability to take up water (Anttila and Kerminen, 2002; Ervens et al., 2004; Facchini et al., 1999; Mircea et al., 2002; Shulman et al., 1996). This surface tension affect could potentially
counter-5
act the delayed activation imposed by reduced particle solubility (Shulman et al., 1996). However, the effect of surface active organics on water uptake is still an unknown (Ab-batt et al., 2005; Bilde and Svenningsson, 2004).
Laboratory studies of the effect of organics on cloud droplet activation have shown that water-soluble organics contribute to CCN activity, insoluble organics do not and
10
slightly soluble organics have a range of cloud-forming capabilities (Abbatt et al., 2005; Broekhuizen et al., 2004; Corrigan and Novakov, 1999; Cruz and Pandis, 1997; Giebl et al., 2002; Hartz et al., 2006; Henning et al., 2005; Hori et al., 2003; Kumar et al., 2003; Prenni et al., 2001; Raymond and Pandis, 2002; Shantz et al., 2003). The addition of even a few percent of inorganic material (by mass) to a mostly insoluble organic
15
particle can have a large impact on the CCN activation (Abbatt et al., 2005; Bilde and Svenningsson, 2004; Broekhuizen et al., 2004; Lohmann et al., 2004; Raymond and Pandis, 2003).
Results from modelling studies of the effects of organics solubility on the formation of cloud droplets have varied. Abdul-Razzak and Ghan (2005) found that in mixtures
20
of slightly soluble organics with inorganics, the organics can be considered fully solu-ble yet Ervens et al. (2004) found that including low solubility organics decreased the number of CCN relative to a fully soluble case. Mircea et al. (2005) showed that with a situation with a high organic fraction, knowledge of the chemical composition (and thus the solubility) of the water soluble component of the aerosol is needed.
25
The delay in the growth of cloud droplets formed on organic particles due to reduced solubility observed in a laboratory and modelling study can have a significant effect on the ability of a particle to activate in clouds in the atmosphere (Shantz et al., 2003). The work presented here extends the approach of Shantz et al. to field observations. The
ACPD
8, 8193–8242, 2008 Droplet growth on organic aerosols from field measurements N. C. Shantz et al. Title Page Abstract Introduction Conclusions References Tables Figures ◭ ◮ ◭ ◮ Back CloseFull Screen / Esc
Printer-friendly Version Interactive Discussion
initial growth of aerosols as they activate into cloud droplets is examined using mea-surements from two field projects, one sampling from a ship on the North Pacific Ocean as part of the Canadian SOLAS study (C-SOLAS) and one sampling in Golden Ears Provincial Park (GE) on the west coast of Canada. These sites provide strong con-trasts, a marine environment with the aerosol mass dominated by sulphate (Phinney
5
et al., 2006) and a forest site with a small urban influence and dominated by organic aerosol (Shantz et al., 2004).
A model that treats changes in droplet growth with respect to time and the Mie scat-tering off of these droplets is used to simulate the CCN measurements and to study the differences of the two contrasting aerosol regimes on the nucleation of cloud droplets.
10
As it can be difficult to characterize the water activity of organic aerosols due to their complexity and insufficient information about their chemical composition, a single hy-groscopicity parameter that considers both hygroscopic and CCN activity (κ: Petters and Kreidenweis, 2007) was also determined. Using this parameter can simplify the physical and chemical information needed for describing activation in models.
15
2 Instrumentation
2.1 Particle size distributions
Size distributions of particles from 0.01–0.4 µm were measured with a Scanning Mo-bility Particle Sizer (SMPS) comprised of a TSI 3071 Electrostatic Classifier and a TSI 3025 Ultrafine Condensation Particle Counter. Larger particle size distributions were
20
measured using an optical particle counter, a PMS Passive Cavity Aerosol Spectrome-ter Probe (PCASP). Both the SMPS and PCASP are used in the two field projects, the C-SOLAS study and the Golden Ears (GE) study (see Phinney et al., 2006; Shantz et al., 2004 respectively for further details).
ACPD
8, 8193–8242, 2008 Droplet growth on organic aerosols from field measurements N. C. Shantz et al. Title Page Abstract Introduction Conclusions References Tables Figures ◭ ◮ ◭ ◮ Back CloseFull Screen / Esc
Printer-friendly Version Interactive Discussion
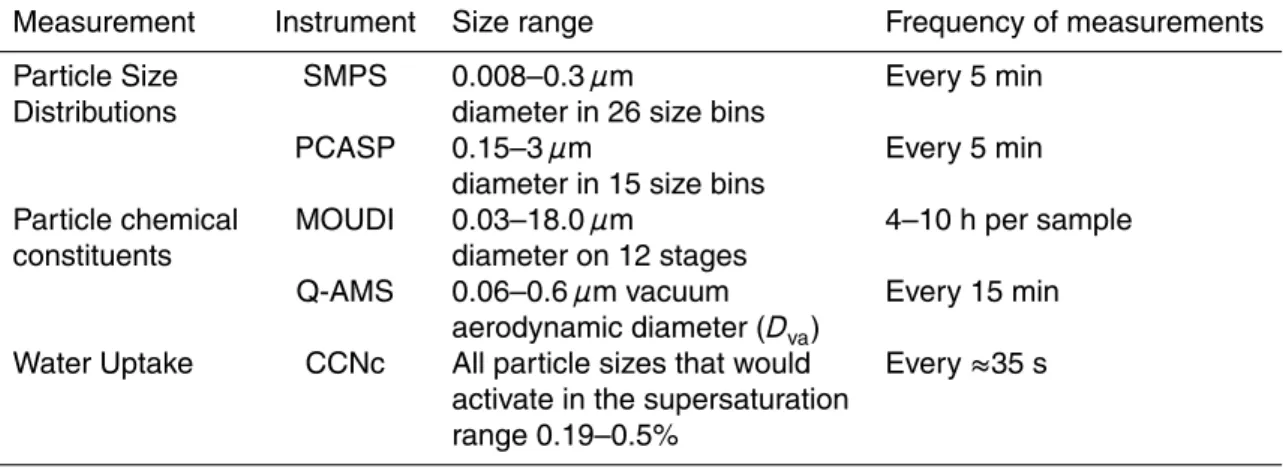
2.2 Particle chemical constituents
During the C-SOLAS study, a Quadrupole Aerodyne Aerosol Mass Spectrometer (Q-AMS, see Jayne et al., 2000) provided the size distribution of sulphate, nitrate, am-monium, methanesulphonic acid (MSA) and total organics in the aerosol. In the Q-AMS, the particles are focused into a narrow beam and directed into an oven, which
5
vapourises the particles. The vapourised components of the particles are ionized by electron impact. The resulting ion fragments are detected with a quadrupole mass spectrometer. A comprehensive table of fragmentation patterns is used to combine the fragments over 300 amu into mass concentrations of the above major compounds. The MSA fragmentation patterns were first implemented in this study and were determined
10
in laboratory experiments (Phinney et al., 2006). In addition to the total sampled par-ticle masses, the composition is also determined as a function of parpar-ticle size. The particles are sized based on the time it takes for a particle to travel from the inlet to the detection point. This size is measured as a vacuum aerodynamic diameter (Dva).
A comprehensive description of the design of the Q-AMS, its operation, quantification
15
methods and calibration procedures are given elsewhere (Alfarra et al., 2004; Allan et al., 2003a; Allan et al., 2003b; Jayne et al., 2000; Jimenez et al., 2003).
Also during C-SOLAS, a Micro-Orifice, Uniform-Deposit Impactor (MOUDI) was used to collect particles for major ion analysis using ion chromatography (IC). This was done using Teflon filters on each of the 12 stages of the MOUDI. Despite its name, the
20
MOUDI was operated in a static mode as opposed to rotating mode that gives rise to the uniform-deposit. The static operation was sufficient as the filters were completely extracted in de-ionized water prior to analysis by IC. The MOUDI data in this work was used to determine the contribution from sea salt. The agreement between the Q-AMS measurements and the MOUDI results for chemical species measured using
25
both methods was relatively close (Phinney et al., 2006).
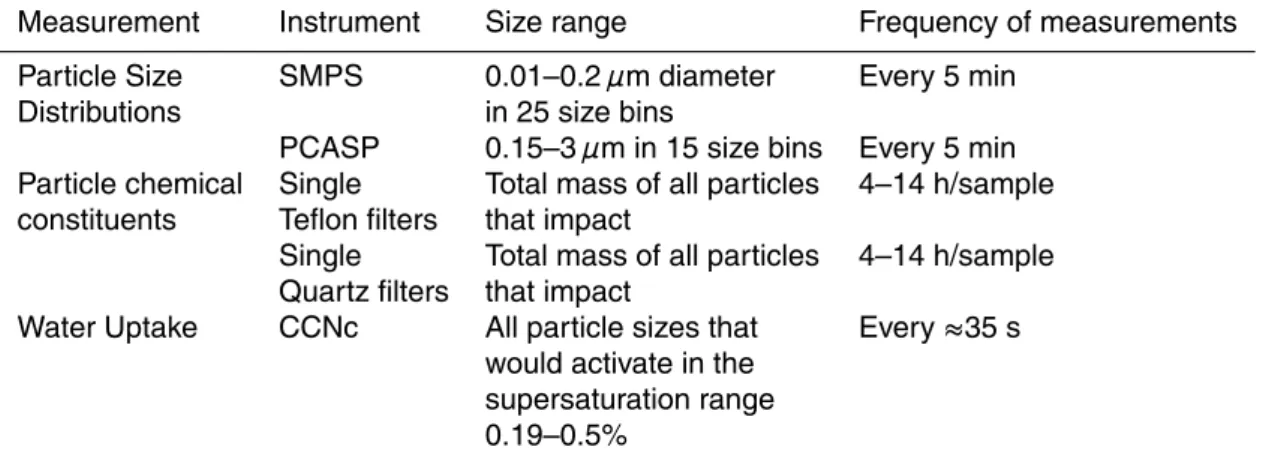
During the GE study (Shantz et al., 2004), particles were collected on single Teflon filters analyzed by IC for information on the total mass concentrations of inorganic
ACPD
8, 8193–8242, 2008 Droplet growth on organic aerosols from field measurements N. C. Shantz et al. Title Page Abstract Introduction Conclusions References Tables Figures ◭ ◮ ◭ ◮ Back CloseFull Screen / Esc
Printer-friendly Version Interactive Discussion
ion constituents (not separated by size) including Na+, Cl−, NH+4, SO=4, NO−3 and K+. Particles for analysis of total mass concentrations of particulate organic carbon (OC), black carbon (BC) and water-soluble organic carbon (WSOC) were collected on single Quartz filters. The BC and OC concentrations were determined by a modified NIOSH method using a Sunset Labs Thermal Optical Transmission Instrument (Lee et al.,
5
2003; Sharma et al., 2002). Water-soluble organic carbon (WSOC) was also measured in samples from the quartz filters as described by Shantz et al. (2004).
2.3 Water uptake: cloud condensation nucleus counter
A University of Wyoming Model MA100 static thermal gradient cloud condensation nucleus counter (CCNc) was used for the CCN measurements during both studies
10
(Shantz et al., 2003; Snider et al., 2006). Light scattered off the growing droplets within the supersaturated environment of the chamber is detected as a voltage from a photo-diode. This voltage is proportional to both the number concentrations and sizes of the growing droplets. For a given supersaturation, the size of the droplets is dependent on their composition, and thus it is difficult to distinguish the effects of number and size
15
from the voltage measurement unless one is relatively constant. For a given particle composition, the difference between the maximum voltage (which is determined when the droplets are at their largest size prior to falling out of the detection region) and the baseline voltage (the signal prior to the exposure of the particles to a water supersat-uration in the chamber) is proportional to the number concentration of the droplets.
20
Hereafter, this is referred to as “deltaV”.
CCN observations are commonly expressed as the number concentration of parti-cles that activated or CCN number concentration (e.g., Bilde and Svenningsson, 2004; Cruz and Pandis, 1997; Hegg et al., 2001; Leaitch et al., 1999; Snider et al., 2003; Stroud et al., 2007). One could determine the CCN number concentration from a
cal-25
ibration constant applied to deltaV (e.g. Leaitch et al., 1999). Due to the limitations discussed above, it is unreasonable to expect to determine accurate CCN number concentrations using this approach to CCN measurements. Thus, the focus of this
ACPD
8, 8193–8242, 2008 Droplet growth on organic aerosols from field measurements N. C. Shantz et al. Title Page Abstract Introduction Conclusions References Tables Figures ◭ ◮ ◭ ◮ Back CloseFull Screen / Esc
Printer-friendly Version Interactive Discussion
work takes the approach of Shantz et al. (2003) and examines the variation in the light scattered by the particles and growing droplets. The rate of change in the scattered light, represented by the time-resolved voltage, is proportional to the growth rate into cloud droplets.
CCNc supersaturations should be experimentally determined and not assumed to be
5
the theoretical values (Frank et al., 2007). The effective supersaturations (hereafter: Seff) within the CCNc were estimated to be 0.19–0.50% using nearly monodisperse ammonium sulphate particles generated in the laboratory, as discussed in Shantz et al. (2003). All supersaturations discussed here are based on these calibrations. The evaluation of Seffresults in the largest uncertainty in these measurements. The errors
10
in Seff are estimated as approximately ±15%. It is difficult to evaluate how this error affects the growth rates from the observations, and so this uncertainty is applied in a model and reflected as the maximum and minimum limits of Seff.
3 Model description
3.1 Simulations of cloud droplet growth rates in the CCNc
15
An adiabatic cloud parcel model (hereafter called the “ACP model”) described by Leaitch et al. (1986) was modified to include partially soluble material (Lohmann et al., 2004; Shantz et al., 2003) and to simulate the growth rates in the CCNc (hereafter referred to as the “CCNc model”) (Shantz et al., 2003). The difference between the ACP model and the CCNc model is how the supersaturation (S) is calculated. In the
20
ACP model, the rate of cooling of the air parcel is balanced by the rate of water uptake to determine S. In the CCNc model, S is specified by a transient rise (that occurs in the CCNc after the flush of particles into the CCNc chamber) followed by a constant S, in an attempt to mimic the variation of S in the chamber. The transient S is de-termined from comparisons of simulated growth rates with those measured for pure,
25
ACPD
8, 8193–8242, 2008 Droplet growth on organic aerosols from field measurements N. C. Shantz et al. Title Page Abstract Introduction Conclusions References Tables Figures ◭ ◮ ◭ ◮ Back CloseFull Screen / Esc
Printer-friendly Version Interactive Discussion
The mass accommodation coefficient (αc) can have a strong effect on the simulated
condensation rate of water, and this is an outstanding uncertainty in quantifying the indirect effect of aerosols on climate forcing. There are a wide range of αcvalues used
in the literature spanning two orders of magnitude, from 0.01 to 1 (e.g. Davidovits et al., 2004; Laaksonen et al., 2005; Marek and Straub, 2001; Mozurkewich, 1986) and
5
the references therein). For cases where an organic film may form on the surface of the cloud droplet, it has been suggested that the value of αc could be as low as 10
−5
(Chuang, 2003; Feingold and Chuang, 2002). Ruehl et al. (2008) determined αc for field measurements (normalized to αc for laboratory ammonium sulphate) and found
that 60% of ambient CCN grew similarly to ammonium sulphate but a number of cases
10
had a low αccompared to ammonium sulphate. We did not have a measurement of the droplet size from this CCNc as was the case for Ruehl et al. (2008) so we were unable to determine αc using their method. Also, αc can not be determined from the growth
rates here, as attempted by Stroud et al. (2007), because of the uncertainties in these CCNc’s such as turbulence and edge effects. Consequently, αc is assumed to be unity 15
in all of the present simulations as suggested in many of the above references. What this means for this study is that although the effect of the organic on water uptake is represented primarily by the dissolution of the organic, any real impact of the organic could alternatively or in some combination be through effects on αc or the surface
tension.
20
For all model runs outlined here, the thermal accommodation coefficient (αT) are
assumed to be 1. Based on other results (e.g. Chuang, 2006), it is assumed that changing the value for αT will not affect the growth rate significantly. All dry particles are assumed to be spherical. It is also assumed that the compounds present in the particles and droplets do not chemically react with each other.
25
The output of the model includes information about the droplet size, number concen-tration and the scattering efficiency of the growing droplets. For direct comparison of the model output to the first five seconds of light scattering off of the droplets from the CCNc measurements (a detector voltage), the scattering cross-sectional area of the
ACPD
8, 8193–8242, 2008 Droplet growth on organic aerosols from field measurements N. C. Shantz et al. Title Page Abstract Introduction Conclusions References Tables Figures ◭ ◮ ◭ ◮ Back CloseFull Screen / Esc
Printer-friendly Version Interactive Discussion
growing droplets is calculated, using Mie theory.
3.2 Simulations of organics
All the organics in the model are assumed to resemble adipic acid in terms of the phys-ical and chemphys-ical properties, except for solubility. The latter is varied. This assumption is used because the CCN and water uptake properties of adipic acid (Table 1) have
5
been widely studied (e.g., Bilde and Svenningsson, 2004; Broekhuizen et al., 2004; Corrigan and Novakov, 1999; Cruz and Pandis, 1997; Ervens et al., 2004; Hori et al., 2003; Joutsensaari et al., 2001; Prenni et al., 2001; Raymond and Pandis, 2002; Shul-man et al., 1996) and adipic acid has been observed in the atmosphere (Grosjean et al., 1978; Kawamura and Yasui, 2005; Wang et al., 2006). The determination of the
10
hygroscopicity parameter κ (Petters and Kreidenweis, 2007) (Sect. 5) is also a means of evaluating this assumption.
Sensitivity to solubility is examined because the previous laboratory work and simu-lations suggest that solubility is an important factor when dealing with organics (Shantz et al., 2003) and it is better constrained than other properties such as the surface
ten-15
sion and the accommodation coefficient. Thus, the dissolution of the organic in the model depends on its solubility and is based on its equilibrium with the amount of wa-ter present on the particles and droplets at each time step, as described in Shantz et al. (2003). The dissolution kinetics discussed in Asa-Awuku and Nenes (2007), which is more important at low temperatures, was not accounted for in this work. The surface
20
tension is defined according to Ervens et al. (2004) and is shown in Table 1. This does not take into account the possibility of a lower solubility film-forming organic compound (Feingold and Chuang, 2002), the effects of which are uncertain (Kanakidou et al., 2005).
ACPD
8, 8193–8242, 2008 Droplet growth on organic aerosols from field measurements N. C. Shantz et al. Title Page Abstract Introduction Conclusions References Tables Figures ◭ ◮ ◭ ◮ Back CloseFull Screen / Esc
Printer-friendly Version Interactive Discussion
4 Observations and simulations of cloud droplet growth rates in the CCNc
4.1 Pacific Ocean- C-SOLAS field study
The Sub-arctic Ecosystem Response to Iron Enrichment Study (SERIES), an experi-ment of the Canadian Surface Ocean and Lower Atmosphere Study (C-SOLAS), took place in the Pacific Ocean in July 2002. The research platform for the atmospheric
5
aerosol measurements was the Mexican oceanographic vessel El Puma. The majority of the measurements were made near Station Papa, an ocean station located in the sub-arctic northeast Pacific, nearly 1400 km off shore. All times used in the work for C-SOLAS are in Pacific Daylight Savings Time (i.e. not local time in the ocean, which was 1.5 h behind PDT). Table 2 outlines the measurements made during this project.
10
Details of the inlets and measurements can be found in Marshall et al. (2005), Phinney et al. (2006) and Phinney et al., (20081).
Over the oceans, sulphate and methanesulphonic acid (MSA) are formed from the oxidation of dimethyl-sulphide (CH3SCH3) (Seinfeld and Pandis, 1998). Natural
or-ganic material, other than MSA, is also present in fine particles in marine environments
15
(e.g. O’Dowd et al., 2004; Phinney et al., 2006), and ships contribute primary organic particles as well as SO2(e.g. Hobbs et al., 2000). In the absence of significant
anthro-pogenic aerosols, either from long-range transport or from ship emissions, the marine aerosol consists primarily of sulphate, MSA and sea salt as well as low concentrations of organics. This was the scenario for most of the C-SOLAS measurements (Phinney
20
et al., 2006). 1
Phinney, L., Lohmann, U., Leaitch, W. R., and Shantz, N.: CCN observations over the sum-mertime North Pacific Ocean: Contributions from DMS and from ship emissions, in preparation, 2008.
ACPD
8, 8193–8242, 2008 Droplet growth on organic aerosols from field measurements N. C. Shantz et al. Title Page Abstract Introduction Conclusions References Tables Figures ◭ ◮ ◭ ◮ Back CloseFull Screen / Esc
Printer-friendly Version Interactive Discussion
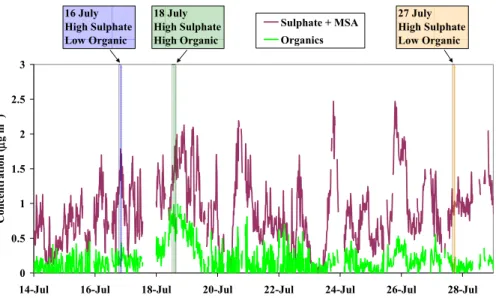
4.1.1 C-SOLAS – time series
The Q-AMS time series of mass concentrations of total particulate sulphur (sulphate + MSA) and total organics for C-SOLAS are shown in Fig. 1. Periods of fumigation from the ship’s exhaust, during times of mooring, have been removed as described by Phinney et al. (2006). With the exception of the 18–19 July period, sulphur dominates
5
the fine particle aerosol. The ammonium mass concentrations (not shown) were low over the time series (on average, the ammonium to sulphate ratio was 0.2) and the sulphate was mostly acidic (Phinney et al., 2006).
For 18–19 July, there was a substantial increase in the organics. The wind speeds were relatively low during this time and the air trajectories looped over the ocean. The
10
Q-AMS mass spectrum for this period resembles a mix of a diesel signature and the background organic (Phinney et al., 2006; Phinney et al., 20081). It is believed that in this case the aerosol was impacted by emissions of ship traffic in the region.
Three periods selected for the present study of CCN droplet growth analysis are highlighted in Fig. 1. On 16 July, the fine particle aerosol is made up of 90% sulphate
15
and MSA and 10% organic material. On 27 July, the organic fraction was <10%. The third case, 18 July, is during the peak of the period of highest organic fraction, up to 30%.
4.1.2 Simulations of 27 July 2002, from C-SOLAS
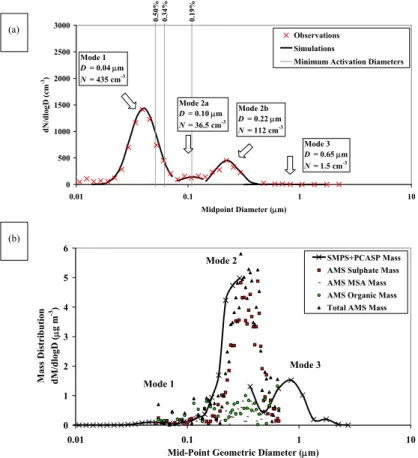
The observed particle number distribution for 27 July is shown in Fig. 2a. It is
approxi-20
mated by three lognormal distributions centred at 0.045 µm (mode 1), 0.16 µm (mode 2), and 0.65 µm (mode 3). The chemical mass size distributions from the Q-AMS are compared with the mass size distribution estimated from the SMPS and PCASP in Fig. 2b. The majority of the mass is in sizes >0.1 µm, and there is reasonable agree-ment between the physical and Q-AMS measureagree-ments for mode 2.
25
The Q-AMS measurements lack sufficient sensitivity to resolve the mass in mode 1, so it is assumed to be 100% sulphuric acid. Both the Q-AMS and the measurements
ACPD
8, 8193–8242, 2008 Droplet growth on organic aerosols from field measurements N. C. Shantz et al. Title Page Abstract Introduction Conclusions References Tables Figures ◭ ◮ ◭ ◮ Back CloseFull Screen / Esc
Printer-friendly Version Interactive Discussion
from the MOUDI indicate the mode 2 particles are composed mostly of acidic sulphate with a smaller amount of MSA. As the Q-AMS total organic is below detection limit in both the time-of-flight and mass measurement modes of the Q-AMS, the organic is assumed to be zero in this case. Assuming that the MSA behaves as sulphate, then mode 2 is modelled as 100% sulphuric acid. Mode 3 was dominated by sea salt
5
(Phinney et al., 2006), and it is assumed to consist entirely of NaCl. Table 3 shows the assumptions of the chemical breakdown for all modes for all of the field case studies.
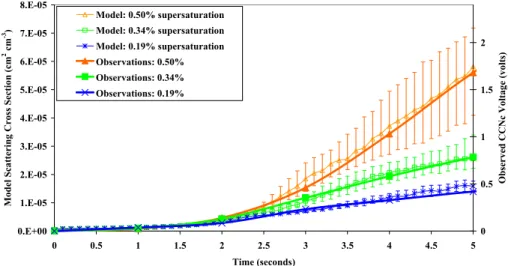
Figure 3 shows the scattering cross-sectional area from the simulations compared with the observed voltage normalized to the base voltage from the CCNc. The scale of the right hand axis has been adjusted to match the simulated growth curves with the
10
observed values. As this is a case of nearly pure polydisperse sulphate, this scaling is used for the remaining cases and provides a reference for the other cases to nearly pure sulphuric acid. The error bars reflect the model runs performed at the Seff±15%, giving the maximum and minimum range in Seff(Sect. 2.3). The minimum activation di-ameters from the simulations are indicated with vertical lines for the different chamber
15
Seff (Fig. 2a). At the lowest Seff, 0.19%, particles in modes 2 and 3 are activated. For Seff=0.34%, a small fraction of particles are activated in mode 1. At Seff=0.50%, just under 50% of the mode 1 particles are activated. Sensitivity tests with the model indi-cate that including up to 15% soluble or insoluble organic or changing the sulphuric acid in mode 1 to ammonium bisulphate slightly decreases the growth rate at Seff=0.34%
20
and 0.50%. These same sensitivity tests for mode 2 do not alter the growth rate at all. Overall, because the organic mass was low and these composition sensitivity tests do not modify the results substantially, we believe that this is a good case to use as a reference for the comparisons between the CCNc observed growth rates and CCNc model results. The next case study (16 July) will be used to verify this reference case.
25
4.1.3 Simulations of 16 July 2002, from C-SOLAS
C-SOLAS 16 July has a similar size distribution (Fig. 4a) and chemical composition (Fig. 4b) as 27 July. One difference with 27 July is that 16 July has a 65% lower
ACPD
8, 8193–8242, 2008 Droplet growth on organic aerosols from field measurements N. C. Shantz et al. Title Page Abstract Introduction Conclusions References Tables Figures ◭ ◮ ◭ ◮ Back CloseFull Screen / Esc
Printer-friendly Version Interactive Discussion
number concentration in mode 1. Note that on 16 July, mode 2 is split into two modes, 2a at 0.1 µm and 2b at 0.22 µm. Both 2a and 2b are assumed to have the same chemical composition.
The Q-AMS measurements for mode 1 are below detection limit. Mode 2 is domi-nated by acidic sulphate, and organics comprise 10% of the mode 2 mass, exclusive
5
of MSA. There were no MOUDI measurements on 16 July, so mode 3 is assumed to be NaCl, as consistent with the rest of the study.
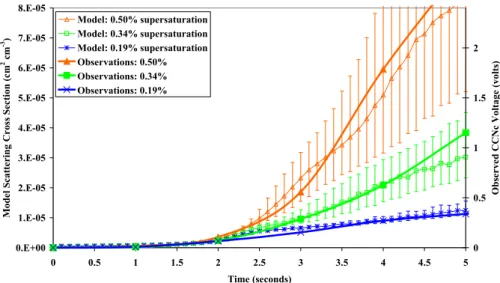
The simulated and observed CCN growth rates for 16 July are shown in Fig. 5. With the same right-hand axis scaling as used in Fig. 3, the simulated and observed growth rates compare closely, lending confidence that this scaling properly reflects a sulphate
10
reference for the remaining cases. It does not matter what solubility is assumed for the organic; soluble and insoluble organics gave the same results.
4.1.4 Simulations of 18 July 2002, from C-SOLAS
The measured and modelled size distributions for 18 July are shown in Fig. 6a, the case with the highest organic mass concentrations. As discussed in Sect. 4.1.1, the mass
15
spectrum of the organic in this case indicates that there was a significant contribution to this organic from diffuse diesel emissions, and the source was possibly from ships crossing the region. The number distribution is represented in the simulations by four modes: mode 1a centred at 0.035 µm, mode 1b at 0.08 µm (hereafter mode 1a and mode 1b will be referred to as “mode 1”), mode 2 at 0.19 µm and mode 3 at 0.65 µm.
20
The observations of Phinney et al. (20081) show that the geometric diameter of mode 1b is larger than the mode diameters on 27 and 16 July due to the sulphate condensing on primary organics from the diesel emissions.
Figure 6b shows the mass distributions. More information about the chemical com-position of mode 1 is available from the Q-AMS for 18 July than 27 or 16 July because
25
mode 1 is larger in size and mass concentration. From the Q-AMS measurements, mode 1 is assumed to be composed of 55% sulphuric acid and 45% organic, and mode 2 is 70% sulphuric acid and 30% organic. These mixtures are assumed to be
ACPD
8, 8193–8242, 2008 Droplet growth on organic aerosols from field measurements N. C. Shantz et al. Title Page Abstract Introduction Conclusions References Tables Figures ◭ ◮ ◭ ◮ Back CloseFull Screen / Esc
Printer-friendly Version Interactive Discussion
internally mixed based on the observations described by Phinney et al. (20081). The MOUDI measurements show mode 3 to be a combination of sulphate, sodium nitrate and sodium chloride. Because all three are quite soluble, the choice is insignificant, and mode 3 is modelled here as pure NaCl.
Figure 7a shows the simulations and the CCNc observations of the droplet growth.
5
The Seff error bars are not shown in this case (for simplicity), but all results fall within that uncertainty. All organics in the distribution are assumed to have the same solubility. The shaded areas encompass the growth rates for assumptions ranging between rela-tively soluble (solubility=200 g L−1) and insoluble organic (solubility=10−6g L−1). The soluble case dissolves readily and accumulates more water early on in the simulation;
10
hence the slightly higher growth curves for the soluble case.
Figure 6a shows the minimum particle diameters activated at the different Seffvalues (the vertical lines) for the insoluble organic case. The soluble organic case activates at the same or very slightly smaller sizes than for the insoluble case.
At Seff=0.19%, all of mode 2 is activating, and there is little difference between the
15
soluble and insoluble organic growth curves because there is only 30% organic in this mode and a small number concentration (the growth is less sensitive to changes in the chemical composition in such a situation). There is slightly more sensitivity to the choice of soluble and insoluble scenarios at Seff=0.34% and 0.5%, because the activa-tion is occurring in regions of the size distribuactiva-tion where the number concentraactiva-tions are
20
changing more rapidly with size and the organic fraction is higher. Still the relative differ-ences are very small and the results from this case agree with those of Abdul-Razzak and Ghan (2005) where any solubility assumption is a close enough approximation as long as the organic is not assumed to behave as an inorganic. To illustrate the effect of assuming the organic is equivalent to an inorganic, and because that assumption has
25
been used in some in previous closure studies (e.g., Conant et al., 2004), the results of Fig. 7a are reproduced for the case where the entire distribution is assumed to be sulphuric acid (Fig. 7b). In this case, the simulated CCN scattering cross sections are significantly higher than the corresponding observations, and most of the simulated
ACPD
8, 8193–8242, 2008 Droplet growth on organic aerosols from field measurements N. C. Shantz et al. Title Page Abstract Introduction Conclusions References Tables Figures ◭ ◮ ◭ ◮ Back CloseFull Screen / Esc
Printer-friendly Version Interactive Discussion
points lie at the edge of or outside the uncertainty defined by the chamber supersatu-ration. This result indicates the significant error that arises from assuming the organic portion behaves similarly to the inorganic portion, and underscores the need to treat the components of the aerosol separately.
The results shown in Fig. 7 indicate that the organic reduces the effectiveness of the
5
individual particle as a CCN compared to pure inorganics. However, compared with the cases from 27 and 16 July, considerably more of the mode 1 particles activate on 18 July at the higher Seff values. This is why the measured growth rates are higher on 18 July than the other two cases. In this case the organic appears to have acted as a substrate for the sulphate to condense upon (e.g. Virkkula et al., 1999; Phinney et al.,
10
20081), redefining the size distribution of the sulphate. Thus, on 18 July the organic appears to be ineffective at water uptake but it contributes to the formation of a broader, more effective CCN distribution by redistributing the sulphate.
4.2 Golden Ears Provincial Park (GE) field study
The GE provincial park study was part of the Pacific 2001 field campaign (e.g. Li, 2004).
15
The park (covered predominantly with tall coniferous trees) is on the north slope (203 m elevation) of the Lower Fraser Valley and about 45 km northeast of Vancouver, British Columbia. Aerosol and trace gas measurements were made in the southern part of the park from 6–11 August 2001. Table 4 summarizes the measurements made during this project that have been discussed previously by Shantz et al. (2004). Note all times
20
mentioned with respect to GE are in local time (i.e. Pacific Daylight Savings Time). The goal of the present study is to examine the cloud-forming properties from this forest aerosol that is also influenced by urban sources.
4.2.1 GE time series
The GE particle chemistry was obtained from open filter samples averaged over 4–
25
ACPD
8, 8193–8242, 2008 Droplet growth on organic aerosols from field measurements N. C. Shantz et al. Title Page Abstract Introduction Conclusions References Tables Figures ◭ ◮ ◭ ◮ Back CloseFull Screen / Esc
Printer-friendly Version Interactive Discussion
shown in Fig. 8. The aerosol was dominated by OC through the sampling period, and increasingly towards the end of the period. The organic aerosol is believed to be a mix of primary and secondary organics from both anthropogenic and biogenic sources; sulphate was likely an ammonium salt (Shantz et al., 2004). Figure 8 also shows water-soluble organic carbon (WSOC) concentration. Because a range of solubilities
5
is tested, WSOC is simply provided as a reference. WSOC is 20–60% of the total OC, which is in the range of what was observed in other studies for polluted, rural and background sites (Carvalho et al., 2003; Decesari et al., 2000; Decesari et al., 2001; Saxena and Hildemann, 1996; Zappoli et al., 1999).
The particulate matter volume for particles >0.1 µm determined from the size
dis-10
tribution measurements is shown in Fig. 8. If we assume a mass density such as 1.0–1.5 g cm−3, there is reasonable agreement between the particulate matter volume and the sum of the OC plus sulphate mass concentrations indicating that most of the OC and sulphate was in the fine particles. The sulphate concentrations at GE were similar or lower than measured over the Pacific Ocean.
15
The CCNc deltaV (proportional to CCN number concentration) at Seff=0.19% switches from being above the particle volume estimate for the first half of the study to being below the particle volume from 9 August onwards (Fig. 8). Although sulphate is low compared to the organic throughout the study, the sulphate to organic ratio is significantly higher during the period prior to 9 August (17%) than after 9 August (4%).
20
The change in the sulphate to organic ratio is a major reason for the change in the correspondence of the CCN with the particle volume, and it indicates a reduced ef-fectiveness of the organic relative to the sulphate as CCN. To examine this further, two periods are selected representing before and after 9 August. These periods are highlighted in Fig. 8 (afternoon of 7 August and morning of 11 August).
25
4.2.2 Simulations of 7 August 2001, from the GE study
The particle number and volume distributions for the period selected from 7 August are shown in Fig. 9a. The fitted size distribution used in the CCNc simulations is matched
ACPD
8, 8193–8242, 2008 Droplet growth on organic aerosols from field measurements N. C. Shantz et al. Title Page Abstract Introduction Conclusions References Tables Figures ◭ ◮ ◭ ◮ Back CloseFull Screen / Esc
Printer-friendly Version Interactive Discussion
to these observations using 3 modes as shown in Fig. 9b. There is one dominant number mode at about 0.034 µm diameter with a very high number concentration, a shoulder mode near 0.07 µm diameter, and a large particle mode at 0.36 µm.
For the purpose of modelling the CCN growth rates in this case, all of the inor-ganic ions (sulphate, ammonium, nitrate, sodium and chloride) are assumed to be
5
ammonium sulphate. All 3 modes are assumed to have the same composition as each other based on the filter measurements from 7 August: 76% organic, 4% BC (an in-soluble organic with molecular weight=12.01 g mol−1, index of refraction=(1.82, 0.74) and density=2 g cm−3) and 20% ammonium sulphate. Particles are assumed to be internally mixed based on hygroscopic growth measurements at this site (Aklilu and
10
Mozurkewich, 2004; Shantz et al., 2004).
Figure 10 shows the scattering cross-sectional area from the model output compared with the voltage from the CCNc observations. Absorption by the BC is included in the calculation, however its influence is negligible because it is present in such small quantities. As for the C-SOLAS 18 July case, the shaded areas encompass the growth
15
rates between relatively soluble and insoluble organic. The vertical lines on Fig. 9b show the minimum particle diameters activated for the organics with a solubility of 10−6g L−1 and at all 3 Seff’s, these fall within the shoulder mode 2. The 200 g L−1 organic activates at slightly smaller sizes (not shown), but still only activates minimum diameters within mode 2. Mode 1 does not activate regardless of the organic solubility.
20
However, the shoulder mode 2 contains a large number of particles (and mass) that may explain the larger growth rates here than during the C-SOLAS cases.
The differences between the modelled soluble (upper curves of shaded sections) and insoluble (lower curves) organic cases are much larger than for the C-SOLAS cases, indicating the importance of organic solubility with increasing organic fraction in the
25
aerosol. For a highly soluble organic, the observations should match the upper curves. The insoluble organic simulation has only sulphate influencing the droplet growth and if the organic does not contribute at all, the observations will match the lower curves. Since the observed growth rates are much higher than the modelled insoluble curves
ACPD
8, 8193–8242, 2008 Droplet growth on organic aerosols from field measurements N. C. Shantz et al. Title Page Abstract Introduction Conclusions References Tables Figures ◭ ◮ ◭ ◮ Back CloseFull Screen / Esc
Printer-friendly Version Interactive Discussion
and are also substantially higher than those observed for the C-SOLAS cases which had similar or higher sulphate concentrations, the organic aerosol makes a significant contribution to the water uptake.
Simulated growth rates for an organic with an effective solubility of about 10 g L−1 best match the observed growth rates for 7 August. Note that if we change our initial
5
assumptions, this effective solubility may be altered, such as the sulphate and organic may not be distributed equally across all sizes or the organic may have affected the surface tension or mass accommodation coefficient in ways that are not properly refer-enced in the model.
In these simulations, with ammonium sulphate internally mixed with organics,
am-10
monium sulphate dissolves initially and dominates the droplet growth until more water collects on the droplets allowing the slightly soluble organics to start to dissolve. At that point the organic may also contribute to the droplet growth.
The WSOC/OC fraction is approximately 25% (Fig. 8). Simulations run with 20% ammonium sulphate, 20% organic with 200 g L−1solubility and 60% insoluble organic
15
to match the WSOC measurements show reasonable agreement between these sim-ulations and the observations. The use of a lower solubility (i.e. <200 g L−1) worsens the agreement.
4.2.3 Simulations of 11 August 2001, from the GE study
Figure 11a shows the number and volume distributions for 11 August. The modelled
20
size distribution, represented by 3 modes, is shown in Fig. 11b. Although the total number concentration is less than on 7 August, there are more particles in mode 2 on 11 August than on 7 August and the volume is substantially higher on 11 August. The increased mass is explained by the condensation of secondary organic aerosol as suggested by the gradual increase in particle mass from 9–11 August. Most of the
ad-25
ditional material on 11 August is suspected to be due to the oxidation of monoterpenes as measured concentrations of a known product of terpene oxidation, cis-pinonic acid, also increased during this period (Cheng et al., 2004; Shantz et al., 2004). Each mode
ACPD
8, 8193–8242, 2008 Droplet growth on organic aerosols from field measurements N. C. Shantz et al. Title Page Abstract Introduction Conclusions References Tables Figures ◭ ◮ ◭ ◮ Back CloseFull Screen / Esc
Printer-friendly Version Interactive Discussion
is assumed to have the same composition, an internal mixture of 85% organic, 2% BC and 13% ammonium sulphate (note that the sum of all inorganic ions is assumed to be ammonium sulphate).
Figure 12 shows the scattering cross-sectional area from the simulations compared with the observations of CCNc droplet growth rates. The vertical lines in Fig. 11b show
5
the minimum activated diameters at the 3 Seff’s (none of the mode 1 particles activate, even when the organic is assumed to be soluble). The growth rates and the number of particles activated are much greater for 11 August than for any of the previously discussed cases.
At Seff=0.50% the observed growth curves are close to the insoluble curve,
suggest-10
ing a smaller contribution from the organics to the water uptake on 11 August than 7 August at this supersaturation. The observed growth rates are higher than the modelled insoluble cases at Seff=0.34%. The difference between the modelled results at these two Seff values is similar to those from 7 August. For Seff=0.5%, there may have been competition of water vapour between the particles in the CCNc at the highest
super-15
saturation. Sensitivity tests suggest that an aerosol composed of soluble inorganics may deplete the supersaturation substantially but slightly soluble organics do not as they don’t take up water to the same extent. If, however, the organics are soluble, com-petition for water vapour may drive the supersaturation to a lower value especially at Seff=0.5%, thus taking up less water, scattering less light and showing a lower voltage.
20
This may indicate a limitation to the growth rate measurement. Overall, the modelled growth rates best agree with the observations for organics with an effective solubility of 5 g L−1, slightly less soluble than 7 August. Keep in mind this is an effective solubility and by changing the initial assumptions, we could find a different value for solubility.
Despite the fact that we found a lower overall effective solubility from the simulations
25
for 11 August compared to 7 August, the WSOC/OC fraction is higher on 11 August compared to 7 August (over 50% – Fig. 8). The WSOC measurements do not give the solubility of the organic, only that it is or is not soluble. Simulations (not shown) are run with 13% ammonium sulphate, 47% organic with 5 g L−1 solubility and 40%
ACPD
8, 8193–8242, 2008 Droplet growth on organic aerosols from field measurements N. C. Shantz et al. Title Page Abstract Introduction Conclusions References Tables Figures ◭ ◮ ◭ ◮ Back CloseFull Screen / Esc
Printer-friendly Version Interactive Discussion
insoluble organic based on the WSOC measurements. Reasonable agreement with the observations is achieved for this situation. However, there are uncertainties in these measurements such as the long filter sampling time, variations in the chemical composition with respect to size and assumptions about the organic. These simulations are fairly sensitive to the amount of sulphate present and if we decrease the amount of
5
ammonium sulphate from 13% to 7%, the WSOC solubility would be higher.
Overall, these results indicate that the organic is less effective as CCN compared to sulphate, but in these situations with relatively low sulphate, the organic particles do act as CCN. Even with lower sulphate masses on 11 August, there is an increase in the number of CCN as there is an increase in the particle number concentration,
10
and similar to C-SOLAS 18 July, it is suspected that the influence of the organic on the sulphate contributes to the increased growth rates. This argument depends on whether the organic coats the sulphate or whether the sulphate is readily available to the water vapour as this model assumes.
5 Implementing a single parameter representing water uptake (κ) 15
Recently Petters and Kreidenweis (2007) discussed the hygroscopicity parameter κ that encompasses water uptake capabilities (both above and below supersaturation) and simplifies the physical and chemical properties needed for aerosols in cloud mi-crophysical models. Because the majority of organic constituents are unknown and thus properties such as molecular weight and solubility are also unknown, a κ value is
20
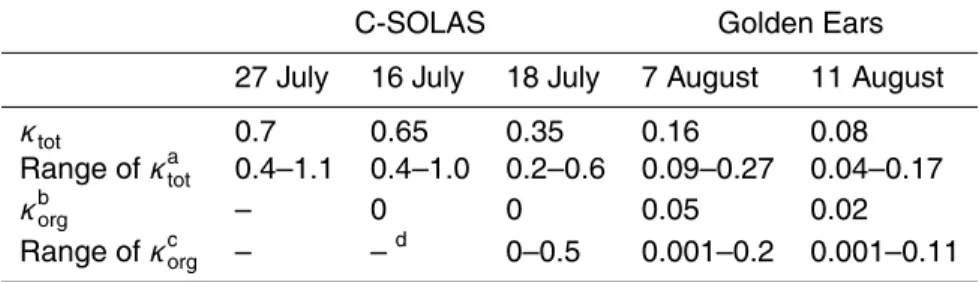
useful in describing the water activity of aerosols from different sources. A version of the present CCNc model using κ was produced (hereafter “κ-CCN model”) in order to compare estimated the total κ values (κtot) for the five case studies discussed above and to determine the organic κ values (κorg) from the field measurements.
For the nearly pure sulphate case from C-SOLAS (27 July), the best agreement
be-25
tween the CCNc model and the κ-CCN model is for κtot=0.7 (see Table 5 for a summary of all κ values determined) and a slightly lower value of κtot=0.65 for 16 July due to the
ACPD
8, 8193–8242, 2008 Droplet growth on organic aerosols from field measurements N. C. Shantz et al. Title Page Abstract Introduction Conclusions References Tables Figures ◭ ◮ ◭ ◮ Back CloseFull Screen / Esc
Printer-friendly Version Interactive Discussion
small amount of organic. These values are slightly below that suggested by Petters and Kreidenweis (2007) for H2SO4 (κ=0.9), which may be due to the differences in the way the water activity is calculated in the CCNc model compared to Petters and Kreidenweis (2007).
In Fig. 13a, the results for modelling C-SOLAS 18 July using κ are shown. This case,
5
with a marine aerosol mixed with organic, shows the best agreement with κtot=0.35.
The κtot can be constrained in this case to 0.2–0.6.
Petters and Kreidenweis (2007) show that for aerosols that consist of a few chemical species, the individual chemical κ values can be weighted by the volume fraction to determine the κtot (using κtot=Pεiκi where εi is the volume fraction and i represents 10
the individual species). Using the measured aerosol composition from the Q-AMS for 18 July (assuming sulphate has κ=0.7 based on 27 July results) and κtot=0.35, then
κorg is found to be zero. In other words, for 18 July over the North Pacific Ocean the organic does not contribute to the water uptake.
GE forest 7 August show the best agreement between the observed and modelled
15
growth rates using κtot=0.16 (Fig. 13b). Assuming the ammonium sulphate has a
κ=0.61 (Petters and Kreidenweis, 2007), κorg is estimated as 0.05. For GE 11 August,
the estimated κtot is 0.08, which falls in the range of κ values provided by Petters and
Kreidenweis (2007) for the oxidation products of monoterpenes. The 11 August κorg
is estimated to be 0.02, lower than the κorg for 7 August. The measurements of water
20
uptake at relative humidities <100% that Aklilu and Mozurkewich (2004) made during the GE study gave values of κtot(called “b” in their paper) in the range of 0.04 to 0.10,
with most values between 0.05 and 0.07. These fall within the uncertainty range of the values determined here. The uncertainties in our measurements do not allow the absolute determination of κ, but based on the time series, it seems that κ is decreasing
25
over time during the GE study based on these 2 case studies (consistent with Aklilu and Mozurkewich, 2004). This could reflect a change in the properties of the organic aerosol over time, or it might be the result of a change in the nature of the mixing of the organic and inorganic components.
ACPD
8, 8193–8242, 2008 Droplet growth on organic aerosols from field measurements N. C. Shantz et al. Title Page Abstract Introduction Conclusions References Tables Figures ◭ ◮ ◭ ◮ Back CloseFull Screen / Esc
Printer-friendly Version Interactive Discussion
6 Summary and conclusions
A cloud condensation nucleus counter (CCNc) is used to investigate the role of or-ganics as CCN by comparing the measured growth rates of cloud droplets to those simulated using a kinetic model (CCNc model). Five cases of ambient measurements of CCN, particle size distribution and particle chemistry are examined, three from the
5
North Pacific Ocean and two from a forest in British Columbia, Canada. One of the marine cases, for which the aerosol was dominated by sulphate (27 July 2002) is used as a reference for the CCNc model. This reference case is verified using a second marine case also dominated by sulphate (16 July 2002). In these cases with the fine particle mass ≥90% inorganic, the organic is of no consequence.
10
The organic fraction is higher in the third marine case (30% of the total mass – 18 July 2002). Evidence suggests that this aerosol was a mix of somewhat aged ship emissions and marine aerosol. The comparison of the observations and simulations indicates that the sulphate in these aerosol particles was responsible for most of the water uptake. However, the organics influenced the CCN growth rates by enhancing the
15
number concentration of particles containing sulphate and redistributing the sulphate to larger and more CCN active sizes.
Two forest cases (from Golden Ears Provincial Park) had higher number concen-trations, much higher organic mass fractions (80–90% of the total mass), and similar or smaller sulphate mass concentrations than the marine cases. The observed CCN
20
growth rates from these two cases are much higher than for the marine cases. This is due to an increase in the number concentrations and some influence of the organic material on the water uptake. The best fits of the simulations to the observations were obtained for organics with solubilities of 5–10 g L−1. This result assumes an accom-modation coefficient of unity and a specified surface tension. Differences in those two
25
quantities from the modelled values might also contribute to the water uptake.
Values of the parameter κ (Petters and Kreidenweis, 2007) are determined for the five cases using the κ-CCN model. For the combined aerosol, the Pacific marine values
ACPD
8, 8193–8242, 2008 Droplet growth on organic aerosols from field measurements N. C. Shantz et al. Title Page Abstract Introduction Conclusions References Tables Figures ◭ ◮ ◭ ◮ Back CloseFull Screen / Esc
Printer-friendly Version Interactive Discussion
are 0.35–0.7 and the organic components are found to be negligible. For the forest aerosol, the total κ value is found to be 0.08–0.16 with an organic κ of 0.02–0.05. The observations suggest that the κ values decreased with time during the GE study as the aerosol accumulated a larger organic mass.
Acknowledgements. For the Golden Ears field study (Pacific 2001), the authors would like to 5
than the BC Ministry of Parks for use of the site, and Y.-A. Aklilu, J. Brook, A. Gaudenzi, D. Halpin, S.-M. Li, N. Lincoln and Y. A. Tham for all of their contributions. For the C-SOLAS field study, the authors thank S. Bacic, D. Lavoue, U. Lohmann, J. Marshall and S. Sharma as well as the scientists and crew onboard the Mexican El Puma research vessel. The authors also thank M. Couture and W. Gong. N. Shantz was supported, in part, by an NSERC PGS-B 10
postgraduate research scholarship. Other financial support was provided by C-SOLAS and CFCAS.
References
Abbatt, J. P. D., Broekhuizen, K., and Kumar, P. P.: Cloud condensation nucleus activity of in-ternally mixed ammonium sulfate/organic acid aerosol particles, Atmos. Environ., 39, 4767– 15
4778, 2005.
Abdul-Razzak, H. and Ghan, S. J.: Influence of slightly soluble organics on aerosol activation, J. Geophys. Res.-Atmos., 110, D06206, doi:10.1029/2004JD005324, 2005.
Aklilu, Y. A. and Mozurkewich, M.: Determination of external and internal mixing of organic and inorganic aerosol components from hygroscopic properties of submicrometer particles 20
during a field study in the Lower Fraser Valley, Aerosol Sci. Technol., 38, 140–154, 2004. Alfarra, M. R., Coe, H., Allan, J. D., Bower, K. N., Boudries, H., Canagaratna, M. R., Jimenez,
J. L., Jayne, J. T., Garforth, A. A., Li, S. M., and Worsnop, D. R.: Characterization of urban and rural organic particulate in the Lower Fraser Valley using two Aerodyne Aerosol Mass Spectrometers, Atmos. Environ., 38, 5745–5758, 2004.
25
Allan, J. D., Alfarra, M. R., Bower, K. N., Williams, P. I., Gallagher, M. W., Jimenez, J. L., McDonald, A. G., Nemitz, E., Canagaratna, M. R., Jayne, J. T., Coe, H., and Worsnop, D. R.: Quantitative sampling using an Aerodyne aerosol mass spectrometer – 2. Measurements of
ACPD
8, 8193–8242, 2008 Droplet growth on organic aerosols from field measurements N. C. Shantz et al. Title Page Abstract Introduction Conclusions References Tables Figures ◭ ◮ ◭ ◮ Back CloseFull Screen / Esc
Printer-friendly Version Interactive Discussion
fine particulate chemical composition in two U.K. cities, J. Geophys. Res.-Atmos., 108, 4091, doi:10.1029/2002JD002359, 2003a.
Allan, J. D., Jimenez, J. L., Williams, P. I., Alfarra, M. R., Bower, K. N., Jayne, J. T., Coe, H., and Worsnop, D. R.: Quantitative sampling using an Aerodyne aerosol mass spectrometer – 1. Techniques of data interpretation and error analysis, J. Geophys. Res.-Atmos., 108, 4090, 5
doi:10.1029/2002JD002358, 2003b.
Alves, C., Pio, C., and Duarte, A.: Composition of extractable organic matter of air particles from rural and urban Portuguese areas, Atmos. Environ., 35, 5485–5496, 2001.
Anttila, T. and Kerminen, V. M.: Influence of organic compounds on the cloud droplet activation: A model investigation considering the volatility, water solubility, and surface activity of organic 10
matter, J. Geophys. Res.-Atmos., 107, 4662, doi: 10.1029/2001JD001482, 2002.
Asa-Awuku, A. and Nenes, A.: Effect of solute dissolution kinetics on cloud droplet formation: Extended K ¨ohler theory, J. Geophys. Res.-Atmos., 112, D22201, doi:10.1029/2005JD006934, 2007.
Bilde, M. and Svenningsson, B.: CCN activation of slightly soluble organics: the importance of 15
small amounts of inorganic salt and particle phase, Tellus Ser. B-Chem. Phys. Meteorol., 56, 128–134, 2004.
Broekhuizen, K., Kumar, P. P., and Abbatt, J. P. D.: Partially soluble organics as cloud con-densation nuclei: Role of trace soluble and surface active species, Geophys. Res. Lett., 31, L01107, doi:10.1029/2003GL018203, 2004.
20
Broekhuizen, K., Chang, R. Y. W., Leaitch, W. R., Li, S. M., and Abbatt, J. P. D.: Closure be-tween measured and modeled cloud condensation nuclei (CCN) using size-resolved aerosol compositions in downtown Toronto, Atmos. Chem. Phys., 6, 2513–2524, 2006,
http://www.atmos-chem-phys.net/6/2513/2006/.
Cantrell, W., Shaw, G., Cass, G. R., Chowdhury, Z., Hughes, L. S., Prather, K. A., Guazzotti, S. 25
A., and Coffee, K. R.: Closure between aerosol particles and cloud condensation nuclei at Kaashidhoo Climate Observatory, J. Geophys. Res.-Atmos., 106, 28711–28718, 2001. Carvalho, A., Pio, C., and Santos, C.: Water-soluble hydroxylated organic compounds in
Ger-man and Finnish aerosols, Atmos. Environ., 37, 1775–1783, 2003.
Chang, R. Y. W., Liu, P. S. K., Leaitch, W. R., and Abbatt, J. P. D.: Comparison between mea-30
sured and predicted CCN concentrations at Egbert, Ontario: Focus on the organic aerosol fraction at a semi-rural site, Atmos. Environ., 41, 8172–8182, 2007.
cis-ACPD
8, 8193–8242, 2008 Droplet growth on organic aerosols from field measurements N. C. Shantz et al. Title Page Abstract Introduction Conclusions References Tables Figures ◭ ◮ ◭ ◮ Back CloseFull Screen / Esc
Printer-friendly Version Interactive Discussion
pinonic acid and n-fatty acids on fine aerosols in the Lower Fraser Valley during Pacific 2001 Air Quality Study, Atmos. Environ., 38, 5789–5800, 2004.
Chuang, P. Y.: Measurement of the timescale of hygroscopic growth for atmospheric aerosols, J. Geophys. Res.-Atmos., 108, 4282, doi:10.1029/2002JD002757, 2003.
Chuang, P. Y.: Sensitivity of cloud condensation nuclei activation processes to kinetic parame-5
ters, J. Geophys. Res.-Atmos., 111, D09201, doi:10.1029/2005JD006529, 2006.
Conant, W. C., VanReken, T. M., Rissman, T. A., Varutbangkul, V., Jonsson, H. H., Nenes, A., Jimenez, J. L., Delia, A. E., Bahreini, R., Roberts, G. C., Flagan, R. C., and Seinfeld, J. H.: Aerosol-cloud drop concentration closure in warm cumulus, J. Geophys. Res.-Atmos., 109, D13204, doi:10.1029/2003JD004324, 2004.
10
Corrigan, C. E., and Novakov, T.: Cloud condensation nucleus activity of organic compounds: a laboratory study, Atmos. Environ., 33, 2661–2668, 1999.
CRC: Handbook of Chemistry and Physics, 54th edition ed., edited by: Weast, R. C., Chemical Rubber Company (CRC) Press, Cleveland, Ohio, 1974.
Cruz, C. N. and Pandis, S. N.: A study of the ability of pure secondary organic aerosol to act 15
as cloud condensation nuclei, Atmos. Environ., 31, 2205–2214, 1997.
Davidovits, P., Worsnop, D. R., Jayne, J. T., Kolb, C. E., Winkler, P., Vrtala, A., Wagner, P. E., Kulmala, M., Lehtinen, K. E. J., Vesala, T., and Mozurkewich, M.: Mass accommo-dation coefficient of water vapor on liquid water, Geophys. Res. Lett., 31, L22111, doi: 10.1029/2004GL020835, 2004.
20
Decesari, S., Facchini, M. C., Fuzzi, S., and Tagliavini, E.: Characterization of water-soluble organic compounds in atmospheric aerosol: A new approach, J. Geophys. Res.-Atmos., 105, 1481–1489, 2000.
Decesari, S., Facchini, M. C., Matta, E., Lettini, F., Mircea, M., Fuzzi, S., Tagliavini, E., and Putaud, J. P.: Chemical features and seasonal variation of fine aerosol water-soluble organic 25
compounds in the Po Valley, Italy, Atmos. Environ., 35, 3691–3699, 2001.
Dick, W. D.: Estimation of water uptake by organic compounds in submicron aerosols measured during the Southeastern Aerosol and Visibility Study, J. Geophys. Res., 105, 1471–1479, 2000.
Ervens, B., Feingold, G., Clegg, S. L., and Kreidenweis, S. M.: A modeling study of aqueous 30
production of dicarboxylic acids: 2. Implications for cloud microphysics, J. Geophys. Res.-Atmos., 109, D15206, doi:10.1029/2004JD004575 2004.
ACPD
8, 8193–8242, 2008 Droplet growth on organic aerosols from field measurements N. C. Shantz et al. Title Page Abstract Introduction Conclusions References Tables Figures ◭ ◮ ◭ ◮ Back CloseFull Screen / Esc
Printer-friendly Version Interactive Discussion
Meszaros, E., Hansson, H. C., Alsberg, T., and Zebuhr, Y.: Partitioning of the organic aerosol component between fog droplets and interstitial air, J. Geophys. Res.-Atmos., 104, 26821– 26832, 1999.
Feingold, G. and Chuang, P. Y.: Analysis of the influence of film-forming compounds on droplet growth: Implications for cloud microphysical processes and climate, J. Atmos. Sci., 59, 2006– 5
2018, 2002.
Fountoukis, C., Nenes, A., Meskhidze, N., Bahreini, R., Conant, W. C., Jonsson, H., Murphy, S., Sorooshian, A., Varutbangkul, V., Brechtel, F., Flagan, R. C., and Seinfeld, J. H.: Aerosol-cloud drop concentration closure for Aerosol-clouds sampled during the International Consortium for Atmospheric Research on Transport and Transformation 2004 campaign, J. Geophys. 10
Res.-Atmos., 112, D10S30, doi:10.1029/2006JD007272, 2007.
Frank, G. P., Dusek, U., and Andreae, M. O.: Technical note: Characterization of a static thermal-gradient CCN counter, Atmos. Chem. Phys., 7, 3071–3080, 2007,
http://www.atmos-chem-phys.net/7/3071/2007/.
Gao, S., Hegg, D. A., Hobbs, P. V., Kirchstetter, T. W., Magi, B. I., and Sadilek, M.: 15
Water-soluble organic components in aerosols associated with savanna fires in south-ern Africa: Identification, evolution, and distribution, J. Geophys. Res.-Atmos., 108, 8491, doi:10.1029/2002JD002324, 2003.
Giebl, H., Berner, A., Reischl, G., Puxbaum, H., Kasper-Giebl, A., and Hitzenberger, R.: CCN activation of oxalic and malonic acid test aerosols with the University of Vienna cloud con-20
densation nuclei counter, J. Aerosol. Sci., 33, 1623–1634, 2002.
Graham, B., Guyon, P., Taylor, P. E., Artaxo, P., Maenhaut, W., Glovsky, M. M., Flagan, R. C., and Andreae, M. O.: Organic compounds present in the natural Amazonian aerosol: Characterization by gas chromatography-mass spectrometry, J. Geophys. Res.-Atmos., 108, 4766, doi:10.1029/2003JD003990, 2003.
25
Grosjean, D., Vancauwenberghe, K., Schmid, J. P., Kelley, P. E., and Pitts, J. N.: Identification of C3-C10 aliphatic dicarboxylic-acids in airborne particulate matter, Environ. Sci. Technol., 12, 313–317, 1978.
Gysel, M., Weingartner, E., Nyeki, S., Paulsen, D., Baltensperger, U., Galambos, I., and Kiss, G.: Hygroscopic properties of water-soluble matter and humic-like organics in atmospheric 30
fine aerosol, Atmos. Chem. Phys., 4, 35–50, 2004,
http://www.atmos-chem-phys.net/4/35/2004/.
ACPD
8, 8193–8242, 2008 Droplet growth on organic aerosols from field measurements N. C. Shantz et al. Title Page Abstract Introduction Conclusions References Tables Figures ◭ ◮ ◭ ◮ Back CloseFull Screen / Esc
Printer-friendly Version Interactive Discussion
Cloud condensation nuclei activation of limited solubility organic aerosol, Atmos. Environ., 40, 605–617, 2006.
Hegg, D. A., Gao, S., Hoppel, W., Frick, G., Caffrey, P., Leaitch, W. R., Shantz, N., Ambrusko, J., and Albrechcinski, T.: Laboratory studies of the efficiency of selected organic aerosols as CCN, Atmos. Res., 58, 155–166, 2001.
5
Henning, S., Rosenorn, T., D’Anna, B., Gola, A. A., Svenningsson, B., and Bilde, M.: Cloud droplet activation and surface tension of mixtures of slightly soluble organics and inorganic salt, Atmos. Chem. Phys., 5, 575–582, 2005,
http://www.atmos-chem-phys.net/5/575/2005/.
Hobbs, P. V., Garrett, T. J., Ferek, R. J., Strader, S. R., Hegg, D. A., Frick, G. M., Hoppel, W. 10
A., Gasparovic, R. F., Russell, L. M., Johnson, D. W., O’Dowd, C., Durkee, P. A., Nielsen, K. E., and Innis, G.: Emissions from ships with respect to their effects on clouds, J. Atmos. Sci., 57, 2570–2590, 2000.
Hori, M., Ohta, S., Murao, N., and Yamagata, S.: Activation capability of water soluble organic substances as CCN, J. Aerosol. Sci., 34, 419–448, 2003.
15
Jayne, J. T., Leard, D. C., Zhang, X. F., Davidovits, P., Smith, K. A., Kolb, C. E., and Worsnop, D. R.: Development of an aerosol mass spectrometer for size and composition analysis of submicron particles, Aerosol Sci. Technol., 33, 49–70, 2000.
Jimenez, J. L., Jayne, J. T., Shi, Q., Kolb, C. E., Worsnop, D. R., Yourshaw, I., Seinfeld, J. H., Flagan, R. C., Zhang, X. F., Smith, K. A., Morris, J. W., and Davidovits, P.: Ambient aerosol 20
sampling using the Aerodyne Aerosol Mass Spectrometer, J. Geophys. Res.-Atmos., 108, 8425, doi:10.1029/2001JD001213, 2003.
Joutsensaari, J., Vaattovaara, P., Vesterinen, M., Hameri, K., and Laaksonen, A.: A novel tandem differential mobility analyzer with organic vapor treatment of aerosol particles, Atmos. Chem. Phys., 1, 51–60, 2001,
25
http://www.atmos-chem-phys.net/1/51/2001/.
Kaku, K. C., Hegg, D. A., Covert, D. S., Santarpia, J. L., Jonsson, H., Buzorius, G., and Collins, D. R.: Organics in the Northeastern Pacific and their impacts on aerosol hygroscopicity in the subsaturated and supersaturated regimes, Atmos. Chem. Phys., 6, 4101–4115, 2006,
http://www.atmos-chem-phys.net/6/4101/2006/.
30
Kanakidou, M., Seinfeld, J. H., Pandis, S. N., Barnes, I., Dentener, F. J., Facchini, M. C., Van Dingenen, R., Ervens, B., Nenes, A., Nielsen, C. J., Swietlicki, E., Putaud, J. P., Balkanski, Y., Fuzzi, S., Horth, J., Moortgat, G. K., Winterhalter, R., Myhre, C. E. L., Tsigaridis, K.,