HAL Id: hal-02958760
https://hal.archives-ouvertes.fr/hal-02958760
Submitted on 22 Oct 2020
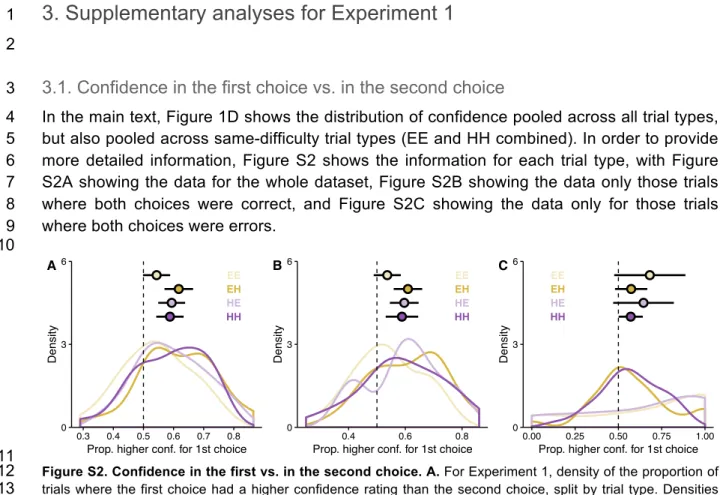
HAL is a multi-disciplinary open access archive for the deposit and dissemination of sci-entific research documents, whether they are pub-lished or not. The documents may come from teaching and research institutions in France or abroad, or from public or private research centers.
L’archive ouverte pluridisciplinaire HAL, est destinée au dépôt et à la diffusion de documents scientifiques de niveau recherche, publiés ou non, émanant des établissements d’enseignement et de recherche français ou étrangers, des laboratoires publics ou privés.
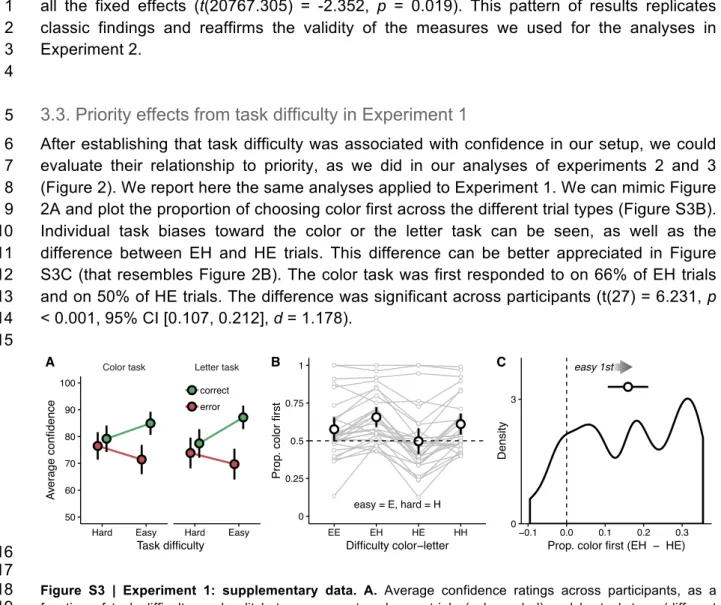
To cite this version:
David Aguilar-Lleyda, Maxime Lemarchand, Vincent de Gardelle. Confidence as a Priority Sig-nal. Psychological Science, Association for Psychological Science, 2020, 31 (9), pp.1084-1096. �10.1177/0956797620925039�. �hal-02958760�
Title: Confidence as a priority signal
1Authors: David Aguilar-Lleyda
1*, Maxime Lemarchand
1, Vincent de Gardelle
22
Affiliations:
31
Centre d’Économie de la Sorbonne (CNRS & Université Paris 1
Panthéon-4Sorbonne), 112 Boulevard de l’Hôpital, 75013 Paris, France
5
2
Paris School of Economics & CNRS
6*corresponding author:
7
email:
[email protected]
8
address: Maison des Sciences Économiques, 112 Boulevard de l’Hôpital,
9
75013 Paris, France
10 11 12
Abstract: When dealing with multiple tasks, we often find ourselves in the problem of 1
establishing the order in which to tackle them. Here we asked whether confidence, the 2
subjective feeling in the accuracy of our decisions, plays an active role in this ordering 3
problem. In a series of experiments, we show that confidence acts as a priority signal when 4
ordering responses about tasks already completed, or ordering tasks that are to be made. In 5
experiments 1-3, participants were engaged in a dual task and categorized perceptual 6
stimuli along two dimensions. We found that they tended to give first the decision in which 7
they were more confident. We also prove that confidence drives prioritization above and 8
beyond task difficulty or response accuracy, and we discard alternative interpretations in 9
terms of response availability or task demands. In experiments 4-6, we show that when 10
participants have to select which of two sets of trials they want to perform first, they engage 11
first in the set associated with higher confidence, and we extend this finding to situations 12
involving non-perceptual (mental calculation) decisions. Our results thus support the role of 13
confidence as a priority signal, thereby demonstrating a new way in which it regulates 14
human behavior. 15
16 17
Keywords: decision-making, confidence, planning, prioritization, metacognition 18
19
Highlights 20
• We show that when having to decide the order in which to approach two tasks, 21
humans prefer to start with the one they feel more confident in. 22
• This holds both when deciding in which order to report two already completed tasks, 23
and when deciding the order in which to tackle two tasks yet to complete. Our results 24
are replicated in perceptual and non-perceptual situations. 25
• The role of confidence on prioritization cannot be reduced to that of task difficulty or 26
response accuracy. 27
• Our findings demonstrate a new way in which confidence regulates human behavior. 28
29 30 31
It is frequent to start a day at work by compiling in a to-do list all the tasks to complete that 1
day. But once the list is written, where do we start? Which task shall we tackle first, and 2
which tasks can be postponed? Of course, this problem is sometimes solved by taking into 3
account external constraints, such as scheduled meetings, imminent deadlines, or the 4
limited availability of specific tools or collaborators. In other circumstances, however, we are 5
free to decide in which order to complete our tasks. In such unconstrained situations, 6
humans may not perform their tasks in a random order, and they might instead exhibit some 7
systematic preference for doing one task before another. Here, we suggest that confidence 8
may play a role in this prioritization problem. In a situation where two tasks have to be done, 9
individuals may address first the one about which they feel more confident. In a situation 10
where two completed tasks have to be reported, individuals may start by the one in which 11
they were more confident. In both situations, confidence would be a priority signal. 12
13
Different considerations make this hypothesis plausible. Firstly, even in the absence of 14
external rewards, the feeling that we have completed a task successfully, and that we can 15
cross an item off our to-do list, may be intrinsically rewarding. Confidence corresponds to 16
this feeling of success in the task. This feeling is generally valid in perceptual1,2 and memory 17
tasks3, where confidence typically correlates with performance (although some dissociations 18
have been documented4–6). Therefore, in order to secure rewards as soon as possible, 19
people could seek to complete first the task in which they are more confident7. Another 20
reason to expect that humans would use confidence as a priority signal is to reduce their 21
mental workload8 before facing the most demanding tasks. Indeed, having multiple pending 22
tasks can diminish our cognitive resources, so to avoid facing the most demanding tasks 23
with a reduced mental workload, agents could complete first the less demanding tasks, in 24
which they are more confident. To do so, they could compare their confidence across the 25
different tasks at hand9,10, and prioritize them accordingly. 26
27
We evaluated whether confidence serves as a priority signal in a series of experiments 28
involving elementary decisions. Our first experiment aimed at evaluating whether confidence 29
would relate to the prioritization of responses between two perceptual decisions already 30
made. On each trial (see Figure 1A), participants (n=28) were presented an array of colored 31
letters and they had to report both the dominant color (orange or blue) and the dominant 32
letter (X or O) in the stimulus. Immediately after they had to give a confidence rating for each 33
choice, on a subjective probability scale of success ranging from 50% (i.e. pure guess) to 34
100% (i.e. completely certain of being correct). By calibrating the stimulus before the main 35
experiment (see methods), we obtained for each task an easy and a hard condition, which 36
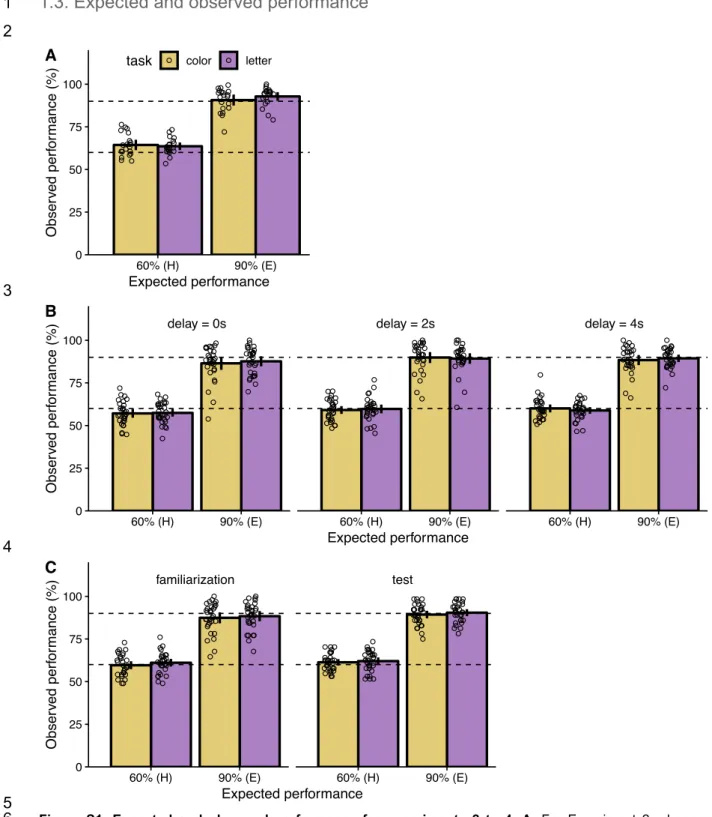
corresponded to an expected 90% and 60% of correct responses, respectively. As Figure 1B 37
shows, observed performance in the experiment closely matched expected performance. 38
39 40
1
Figure 1 | Experiment 1: design and results. A. Overview of a trial. An array of 80 elements appeared for 1s.
2
Each element could be an O or an X, colored blue or orange. After the stimuli disappeared, a response screen 3
appeared. Four boxes were presented, each containing one of the four elements related to the choice. 4
Participants gave their response to the color task by clicking on the box containing either the blue or the orange 5
square, and to the letter task by clicking on the box containing either the O or the X. Next two scales, one for the 6
color task and another for the letter task, appeared on the screen disposed as a cross. Participants could then 7
rate their confidence on each task’s decision, from 50 (total uncertainty) to 100 (total certainty). B. Observed 8
performance as a function of expected performance, both in percentage, split by task type. Bars represent 9
averages across participants, with error bars denoting 95% confidence intervals. Dots represent individual 10
participants. Top and bottom dashed lines help indicate where 90% and 60% observed performance would lay, 11
respectively. C. Average confidence rating given for the second choice within a trial, as a function of that for the 12
first choice. Dots represent individual participants, and the black, solid line represents a linear fit of the data. 13
Participants below the dashed, identity line expressed more confidence in their first choices, and vice versa. D. 14
Density of the proportion of trials where the first choice had a higher confidence rating than the second choice. 15
The black density corresponds to the whole dataset, the green density corresponds only to those EE and HH 16
trials where both choices were correct, and the red density corresponds only to those EE and HH trials where 17
both choices were errors. Densities are drawn by using each participant’s data, with each participant’s average 18
shown as an individual dot at the bottom. Across-participant averages are displayed as big dots with error bars 19
showing 95% confidence intervals. The dashed line corresponds to equal confidence ratings for first and second 20
choices. 21
22
Critically, although participants were not asked to report their judgments in a specific order, 23
we expected that they would report first the judgment associated with a higher confidence. 24
This was indeed the case on average across trials: confidence in the first choice was higher 25
than confidence in the second choice (Figure 1C, t(27) = 6.425, p < 0.001, 95% CI [4.166, 26
8.075], d = 1.214). It was also the case within each trial: as seen in Figure 1D, the proportion 27
of trials in which the confidence associated to the first choice was greater than that 28
associated to the second was systematically greater than 0.5 (t(27) = 4.339, p < 0.001, 95% 29
CI [0.546, 0.628], d = 0.820). Furthermore, this pattern held even when the two perceptual 30
dimensions had the same difficulty level and responses were both correct (green line in 31
Figure 1D, t(27) = 2.400, p = 0.024, 95% CI [0.508, 0.600], d = 0.454) or both incorrect (red 32
line in Figure 1D, t(27) = 2.150, p = 0.041, 95% CI [0.503, 0.643], d = 0.406). Note that, by 33 A 0 25 50 75 100 60% (H) 90% (E) Expected performance Obse rv ed per fo rmance (%)
task color letter
B 50 60 70 80 90 100 50 60 70 80 90 100
Average conf. 1st choice
A ve rage con f. 2nd choice C 0 3 6 0.25 0.50 0.75
Prop. higher conf. for 1st choice
Density D + conf. 2nd + conf. 1st all data EE & HH (errors) EE & HH (correct) o x x o x x o x x o x x o o x x x o x x x o x x x o o x x x o x x o o o o o x o x x o x x x x o x o x x x oo o x x o x x x x x x o x ox x x o x x x x o o o o
Make your choice
58 92
construction, this later analysis confirms that participants’ priority was driven by confidence 1
per se, and not simply by task difficulty or response accuracy. 2
3
To strengthen this point, we conducted four more analyses on this data, which showed that 4
confidence affects priority above and beyond task difficulty (expected accuracy) and actual 5
accuracy. First, in a logistic regression model, we found that responding to the color task first 6
was significantly predicted from the difference in reported confidence between the two tasks 7
(β = 0.045, S.E. = 0.002, p < 0.001), even when the difference in actual accuracy (β = 0.002, 8
S.E. < 0.001, p < 0.001) and in expected performance (β = 0.003, S.E. = 0.001, p = 0.004) 9
between the two tasks were included as predictors in the same regression. Second, we 10
compared this regression model with a simpler one that only included the difference in 11
expected performance and actual accuracy between tasks, and we found that including 12
confidence significantly improved the model (log-likelihood: full model = -6083.624, no 13
confidence model = -6644.367; χ²(1) = 1121.486, p < 0.001). Third, in a different but similar 14
approach, we could predict priority from confidence (p < 0.001) in a regression in which we 15
included as an offset the prediction of priority by expected performance and actual accuracy. 16
These analyses were conducted on the full data and are presented in more details in 17
supplementary information 4. In our last analysis our goal was to pit confidence against 18
accuracy by evaluating whether participants would prioritize an error made with greater 19
confidence over a less confident but correct response. To do so, we focused on a narrow 20
subset of trials where participants made an error for one dimension and a correct response 21
for the other, but expressed a greater confidence in their error than in their correct response. 22
Pooling all participants together (due to the limited number of trials per participant), we 23
performed a binomial exact test and found indeed that the proportion of trials where the error 24
was prioritized was greater than 0.5 (actual proportion = 0.570, n = 1384 trials, p < 0.001). 25
Results were similar if only taking trials where the two dimensions had the same difficulty 26
level (proportion = 0.591, n = 658 trials, p < 0.001). Thus, when confidence and accuracy 27
were dissociated, the former still drove prioritization of responses. This not only reinforces 28
the idea that the role of confidence cannot be reduced to that of accuracy, but also suggests 29
that the role of confidence is preponderant. 30
31
In the experiment described above, participants may have associated their confidence 32
ratings with task priority simply because they had to explicitly report their confidence. Our 33
result (i.e. ‘most confident response first’) would be strengthened if replicated with a 34
paradigm that eliminated this possibility of an implicit demand effect. In our second 35
experiment, thus, we tested our hypothesis without asking for confidence ratings, and we 36
relied instead on task difficulty as a proxy for confidence. Indeed, in our first experiment we 37
observed that reported confidence was greater for easy tasks than for hard tasks, and also 38
greater for correct responses than for errors (for details see supplementary information 3.2.), 39
as typically found in the confidence literature1,3,11. 40
41
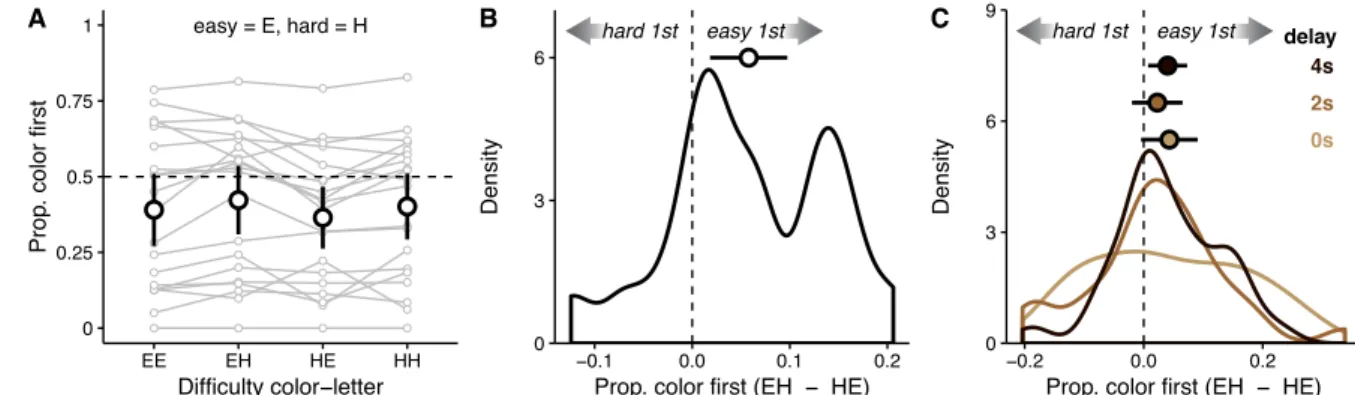
In Experiment 2, we therefore asked a new set of participants (n=20) to perform the same 42
dual task without confidence ratings. Figure 2A depicts the proportion of times the first 43
response was related to the color task, in each of the four possible kind of trials: easy color - 44
easy letter (EE), easy color - hard letter (EH), hard color - easy letter (HE), and hard color - 45
hard letter (HH). If confidence truly guided the priority of the responses, participants should 46
exhibit a bias towards responding to the easy task before the difficult task. We found that, 47
indeed, the color judgment was reported first more in EH trials than in HE trials (42% vs. 48
37% of trials). This difference in proportion was highly consistent across participants (t(19) = 1
3.059, p = 0.006, 95% CI [0.018, 0.097], d = 0.684), as illustrated by Figure 2B. In other 2
words, participants’ task prioritization was affected by task difficulty, as a proxy for 3
confidence, such that participants exhibited an easy-first bias. For completeness, we also 4
confirmed that the same results were obtained in Experiment 1 (see supplementary 5
information 3.3.). 6
7
8
Figure 2 | Experiment 2 & Experiment 3: results. A. For Experiment 2, proportion of trials where the color task
9
was first responded to, as a function of the type of trial (EE = easy color, easy letter; EH = easy color, hard letter; 10
HE = hard color, easy letter; HH = hard color, hard letter). Each set of four dots connected by lines represents 11
one participant. Bigger dots represent average proportions across participants, and error bars denote 95% 12
confidence intervals. The dashed line corresponds to no preference towards responding first to the color or the 13
letter task. B. For Experiment 2, density of the difference between proportion color task chosen first for EH trials 14
and proportion color task chosen first for HE trials. The density is drawn by using the difference of proportions for 15
each participant. The across-participant average is displayed as a big dot with error bars showing 95% 16
confidence intervals. The dashed line corresponds to no difference between EH and HE trials. C. For Experiment 17
3, density of the difference between proportion color task chosen first for EH trials and proportion color task 18
chosen first for HE trials. The three densities, one for each delay, are drawn by using the difference of 19
proportions for each participant. Across-participant averages are displayed as big dots with error bars showing 20
95% confidence intervals. The dashed line corresponds to no difference between EH and HE trials. 21
22
In our third experiment, we wanted to discard one possible interpretation of our results in 23
terms of response availability. Because in our previous experiments the response screen 24
was presented immediately after the stimuli disappeared, one could argue that only the 25
decision for the easy task had been reached by then. If that was true, then the easy-first 26
priority effect could be due to response availability rather than confidence. To tackle this 27
concern, we modified our previous experiment by introducing a delay (0s, 2s, or 4s, 28
randomized across trials) between the stimulus offset and the onset of the response screen. 29
We reasoned that, if the easy-first effect was only driven by response availability at the 30
response screen onset, then it should disappear for long delays. We ran this experiment with 31
new participants (n=30) and then calculated again the proportion of trials in which color was 32
first responded to in EH trials and in HE trials, now for each delay condition. We found that 33
the main effect of trial type was significant overall (F(1,29) = 6.098, p = 0.020, 𝜂!! = 0.174), 34
with an easy-first bias replicating our previous studies. Although the main effect of delay was 35
also significant (F(2,29) = 12.760, p = 0.020, 𝜂!! = 0.306), it did not interact with trial type (p = 36
0.679, see also Figure 2C). This data thus ruled out the concern that participants responded 37
to the easy task first because it was the only task for which a decision was available by the 38
time the response screen was presented. 39 40 easy = E, hard = H 0 0.25 0.5 0.75 1 EE EH HE HH Difficulty color−letter Pro p . color first A 0 3 6 −0.1 0.0 0.1 0.2
Prop. color first (EH − HE)
Density B 0s 2s 4s delay 0 3 6 9 −0.2 0.0 0.2
Prop. color first (EH − HE)
Density
C
The experiments described so far showed that confidence acts as a priority signal at the 1
level of response execution: when engaged in a dual task, participants tend to communicate 2
first the response associated with greater confidence. In what follows, we investigated the 3
prioritization between two tasks, instead of between responses. In other words, in a situation 4
where two tasks have to be completed separately (much like our introductory “to-do list” 5
example), we asked whether participants would engage first in the task that they feel more 6
confident about. In such situations, participants may rely on prospective confidence, that is 7
their anticipation about the probability of success in a task before they actually do it, which 8
can be based for instance on prior experience with the same task12,13. We implemented this 9
idea in our next experiments. First we familiarized participants with two conditions, one 10
eliciting higher confidence than the other. Then in a subsequent test phase, they would face 11
again the same two conditions, in the order they preferred, and we evaluated whether they 12
would prioritize the condition associated with higher confidence. 13
14
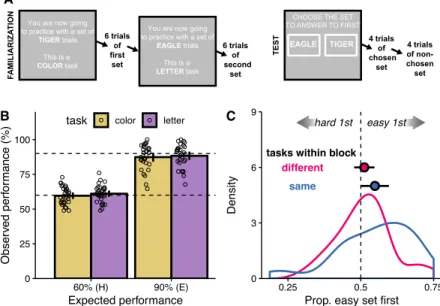
Our fourth experiment was conducted on a new sample of participants (n=31), which 15
completed 32 experimental blocks, each constituted of a familiarization and a test phase 16
(Figure 3A). In the familiarization phase, participants completed two sets of trials. Each set 17
contained 6 trials, and was associated with a name and a task (either color or letter). 18
Importantly, one set contained only hard trials, while the other set contained only easy trials. 19
Difficulty was calibrated before the experiment (Figure 3B), and the order of the easy and 20
hard set in the familiarization phase was random. After completing the familiarization phase, 21
the test phase started: participants were presented with the names of both sets, and they 22
could choose the order in which they wanted to complete 4 trials of each set. They knew that 23
performance in these test trials would determine their final payoff. Critically, participants 24
chose more often to face the easy set first (Figure 3C, t(30) = 2.284, p = 0.030, 95% CI 25
[0.503, 0.557], d = 0.410). These results thus demonstrate that prospective confidence too 26
can establish the priority of one task over another. Interestingly, whether the two sets 27
involved different tasks or the same task did not affect this priority effect (p = 0.256). This 28
suggests that the comparison of the two sets involved relatively abstract representations, as 29
was found for confidence comparison9,14. 30
31
32
Figure 3 | Experiment 4: design and results. A. Overview of one block. The familiarization phase made
33
participants practice with 6 trials of two different sets, with each set introduced by a screen stating its name and 34 0 25 50 75 100 60% (H) 90% (E) Expected performance Obse rv ed per fo rmance (%)
task color letter
B
same
different
tasks within block
0 3 6 9
0.25 0.5 0.75
Prop. easy set first
Density
C A
CHOOSE THE SET TO ANSWER TO FIRST
EAGLE TIGER You are now going
to practice with a set of TIGER trials
This is a COLOR task
You are now going to practice with a set of
EAGLE trials This is a LETTER task 6 trials of first set FAMILIARIZA TION TEST 6 trials of second set 4 trials of chosen set 4 trials of non-chosen set hard 1st easy 1st
the type of task participants would have to respond to. During the test phase participants had to complete 4 trials 1
of each set. At the beginning of the phase, a screen with the names of both sets was presented, and participants 2
clicked on the name of the set they wanted to start with. B. For the familiarization phase, observed performance 3
as a function of expected performance, both in percentage, split by task type. Bars represent averages across 4
participants, with error bars denoting 95% confidence intervals. Dots represent individual participants. Top and 5
bottom dashed lines help indicate where 90% and 60% observed performance would lay, respectively. C. Density 6
of the proportion of blocks where participants chose to complete first the 4 trials from the set with an easy task. 7
One of the displayed densities corresponds to blocks where both tasks were the same, the other to those where 8
they were different. Both densities are drawn by using each participant’s data. Across-participant averages are 9
displayed as big dots with error bars showing 95% confidence intervals. The dashed line corresponds to easy 10
and hard tasks being chosen first equally often. 11
12
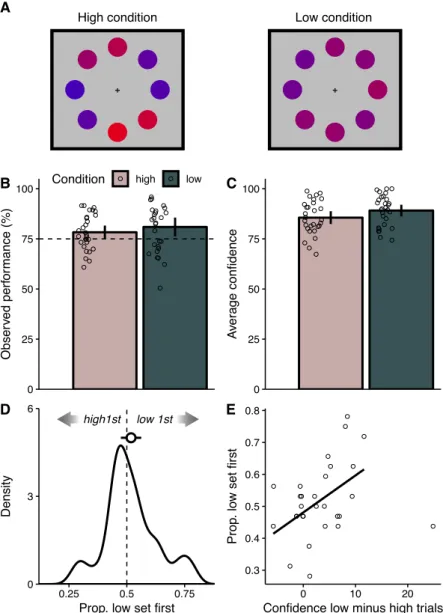
In Experiment 5 (n=29), our goal was to further demonstrate that task prioritization between 13
two sets of trials depends on confidence above and beyond performance. To do so, we 14
reproduced the structure of Experiment 4 while dissociating confidence from performance, 15
by capitalizing on previous work showing that confidence can be biased by the variability of 16
the evidence available for the perceptual decision15–18. On each trial, participants were 17
presented with 8 circles colored between red and blue, and they had to judge whether the 18
average color was closer to red or to blue. We compared two conditions (Figure 4A). Within 19
a block, one set of trials had circles with high mean evidence (the average color was far 20
away from the midpoint between red and blue) and with high evidence variability, while the 21
other set featured trials with low mean evidence (the average color was close to the 22
midpoint) and low variability (more homogeneous hue across circles). These two conditions 23
were matched in terms of decision accuracy (t(28) = -0.993, p = 0.329, 95% CI [-0.080, 24
0.028], d = -0.184, see Figure 4B), but confidence ratings collected after the main 25
experiment confirmed that participants were slightly more confident in the low condition 26
(t(28) = -3.151, p = 0.004, 95% CI [-5.855, -1.242], d = -0.585, see Figure 4C), as found in 27
previous studies with these stimuli16,17. We thus expected to find that participants would 28
prioritize the low condition over the high condition. Overall, this effect was not clear at the 29
group level: the proportion of blocks where the low condition set was chosen first was not 30
different from 0.5 (t-test: t(28) = 0.851, p = 0.402, 95% CI [-0.026, 0.062], d = 0.158, Figure 31
4D). Crucially, however, when looking at the inter-individual heterogeneity, we found that the 32
expected priority effect towards the low condition was more pronounced for participants 33
expressing greater confidence in the low condition when compared to the high condition 34
(Figure 4E). Given the presence of a clear outlier (who always prioritized the first presented 35
set, irrespectively of the condition), the relation between these two effects was confirmed 36
with a robust correlation analysis (r = 0.427, p = 0.021). Of note, prioritization of the low 37
condition was not correlated with a performance advantage towards the low condition (r = -38
0.099, p = 0.611). After excluding the outlier, we could also predict the priority effect from the 39
confidence effect in a regression across participants (β = 0.015, t = 3.399, p = 0.002), even 40
after adding the performance difference between the two conditions as a covariate in the 41
regression (p = 0.253). In sum, Experiment 5 shows that participants who experienced more 42
confidence in the low condition also tended to prioritize this condition in their task planning, 43
even when task accuracy was equal. 44
45 46
1
Figure 4 | Experiment 5: design and results. A. Example stimulus for each of the conditions. The mean
2
evidence generating each sample from the high condition is of high evidence, but across-sample variability is 3
also high. For the low condition, the generative mean is of lower evidence, but variability is also lower. B. For all 4
trials of the experimental part, average observed performance as a function of expected performance, both in 5
percentage, split by condition. Bars represent averages across participants, with error bars denoting 95% 6
confidence intervals. Dots represent individual participants. The horizontal dashed line indicates where 75% 7
observed performance would lay. C. Average confidence ratings across participants, split by condition. Error bars 8
denote 95% confidence intervals. Dots depict individual participants. D. Density of the proportion of blocks where 9
participants chose to complete first the the set whose trials belonged to the low condition. The density is drawn 10
by using each participant’s data. The across-participant average is displayed as a big dot, with error bars 11
showing 95% confidence intervals. The dashed line corresponds to low and high condition sets being chosen first 12
equally often. E. Proportion of blocks where participants chose to complete first the the set whose trials belonged 13
to the low condition, as a function of the difference between the average confidence for low condition trials minus 14
the average confidence for high condition trials. Each dot depicts an individual participant. The line depicts a 15
linear fit of the data excluding the outlier (rightmost dot). 16
17
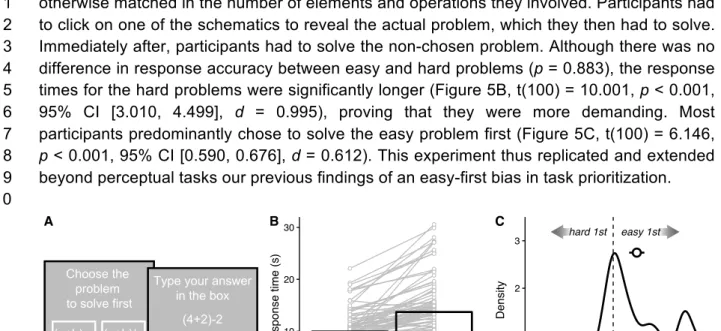
Finally, we aimed at evaluating the generalizability of our findings beyond perceptual 18
decisions. For this, we conducted another experiment to test whether priority towards easier 19
problems would also manifest itself when considering simple mental calculation. On each 20
trial, two schematics of mental calculation problems were presented (Figure 5A). One was a 21
priori more difficult than the other, in the sense that it included a multiplication or a division 22
(e.g. “x+y/z”), instead of only additions or subtractions (e.g. “x+y-z”). The problems were 23 A 0 25 50 75 100 Obse rv ed per fo rmance (%)
Condition high low
B 0 25 50 75 100 A ve rage confidence C 0 3 6 0.25 0.5 0.75
Prop. low set first
Density D 0.3 0.4 0.5 0.6 0.7 0.8 0 10 20
Confidence low minus high trials
Pro p . l o w set first E + + high1st low 1st
otherwise matched in the number of elements and operations they involved. Participants had 1
to click on one of the schematics to reveal the actual problem, which they then had to solve. 2
Immediately after, participants had to solve the non-chosen problem. Although there was no 3
difference in response accuracy between easy and hard problems (p = 0.883), the response 4
times for the hard problems were significantly longer (Figure 5B, t(100) = 10.001, p < 0.001, 5
95% CI [3.010, 4.499], d = 0.995), proving that they were more demanding. Most 6
participants predominantly chose to solve the easy problem first (Figure 5C, t(100) = 6.146, 7
p < 0.001, 95% CI [0.590, 0.676], d = 0.612). This experiment thus replicated and extended 8
beyond perceptual tasks our previous findings of an easy-first bias in task prioritization. 9
10
11
Figure 5 | Experiment 6: design and results. A. Overview of one trial. Two schematics of simple mental
12
calculation problems were presented, one easier to solve than the other. Participants clicked on the one they 13
wanted to solve first. The actual problem was then revealed, and participants had to type their response. Then 14
they had to do the same with the other problem. B. Average response time, in seconds, as a function of the 15
difficulty of the problem. Bars show the average across participants, while dots connected by lines represent 16
each individual participant. C. Density of the proportion of blocks where participants chose to respond first to the 17
easy problem. The density is drawn by using the proportion for each participant. The across-participant average 18
is displayed as a big dot with error bars showing 95% confidence intervals. The dashed line corresponds to easy 19
and hard problems being chosen equally often. 20
21
To summarize, we found that, when having to prioritize responses or tasks, participants 22
exhibited a systematic bias towards engaging first in the response or the task in which they 23
had greater confidence. We replicated this finding in 6 experiments. Converging evidence 24
came from different measures, using task difficulty and observed accuracy as proxies for 25
confidence, but also using actual confidence ratings, and even exploring situations where 26
performance and confidence were dissociated. In terms of generalizability, we demonstrated 27
that this effect was present in both situations involving retrospective confidence (experiments 28
1-3) and prospective confidence (experiments 4-6), and both situations involving perceptual 29
and non-perceptual tasks, such as mental calculation. 30
31
Situations in which we face multiple tasks present a huge diversity, and task prioritization is 32
likely determined by a varied set of factors, most of which were not manipulated in our 33
design. For instance, prioritization can be driven by personal interest and the familiarity with 34
the task19. We did also not manipulate the duration of each task, although there is evidence 35
from real-life situations where people tended to approach first the shortest tasks20. Although 36
in our experiments the two tasks were presented simultaneously, previous research has 37
shown that task prioritization also depends on the time at which task-relevant information is 38
presented21. We therefore only claim that confidence is one among many forces driving task 39
prioritization. In our data, we find a large inter-individual variability in the general tendency to 40
prioritize the color or the letter task (Figure 2A, see also supplementary information 6.1.), 41 A 0 10 20 30 Easy Hard Problem difficulty Response time (s) B 0 1 2 3 0.25 0.5 0.75 1
Prop. easy first
Density C hard 1st easy 1st Choose the problem to solve first (a+b)-c (a+b)/c
Type your answer in the box
...
and we found that the locations of the different choice options on the screen could also bias 1
task priority (see supplementary information 6.2.). Whether this variability is due to strategies 2
or heuristics explicitly chosen by participants, or to differences in their perceptual or decision 3
processes, remains to be investigated. Another factor that deserves more scrutiny is the 4
reward associated with each task, which should affect task priority. In our experiments, we 5
purposefully avoided any difference in reward between both tasks within a trial. We also did 6
not instruct or incentivize participants to prioritize the more confident or the more accurate of 7
the two decisions. In sum, nothing in the instructions or the reward structure pushed 8
participants to prioritize one task over the other. Some of the aforementioned features could 9
be manipulated in future studies, and whether humans change their priorities under such 10
manipulations is an open empirical question. 11
12
Another important issue for future research is whether this strategy of approaching the easy 13
task first is adaptive. A priori, reducing the mental workload before tackling more difficult 14
tasks could be beneficial. In our data, however, we found no clear evidence that addressing 15
the easy task first led to better performance. Overall, participants were neither better nor 16
worse when responding first to the easy task than when responding first to the hard task 17
(see supplementary information 7.1.). To further investigate this issue, we conducted an 18
additional experiment comparing a free response order condition (which replicated 19
Experiment 2) to an imposed order condition in which the choice for the hard task was 20
required either first or second (see supplementary information 7.2.). We found that 21
participants’ performances were similar between these two conditions, suggesting that, in 22
our paradigm, the confidence-driven prioritization does not lead to an advantage in task 23
performance. In other words, while we cannot claim that there is no advantage behind 24
confidence-driven prioritization, our manipulation could not find it. 25
26
Our study highlights a new way in which confidence actively shapes our behavior. It 27
therefore contributes to a growing literature showing how confidence is not a mere 28
commentary on performance but actually affects individual or collective decisions. Previous 29
research showed how, when agents interact, the confidence with which an advice is 30
expressed affects the use of this information by others22–24 and how well the group will 31
perform25. At the individual level, confidence may serve as a teaching signal when feedback 32
is unavailable26–29. It also influences the amount of resources we engage in a task17,30. Here 33
we show that confidence does not only determine how we do a task, but also when we plan 34
to do it. 35
36
Understanding how people decide to perform one task before another may have practical 37
consequences for the management of individuals and organizations. This motivated some 38
studies that focused on different applied scenarios. Some of this previous work already 39
found that individuals address easier tasks first when they can decide their task schedule. 40
For instance, students appear to prioritize easier course assignments over difficult ones31, 41
and the expected easiness of finding the relevant information affects their prioritization of a 42
web-search task over another19. Physicians at an emergency department do prioritize easy 43
patient cases, especially under high workload contexts7. The present study makes several 44
unique contributions to this research topic: we extend this result to situations involving 45
immediate decisions, we link the easy-first bias to confidence, and we offer a strict control 46
over performance in the task via our psychophysical procedures. Finally, although we did not 47
find a clear consequence from the easy-first bias on performance, previous research has 48
shown that in another context this strategy was associated with both short-term benefits and 1
long-term costs. Indeed, prioritizing easy cases allowed physicians to treat more patients per 2
unit of time, but across individuals it was associated with a lower productivity and less 3
revenue for the hospital7. Understanding whether and how similar short-term benefits and 4
long-term costs may arise in other contexts, and in particular in situations where individuals 5
have to perform multiple perceptuo-motor tasks at the same time, constitutes an exciting 6
topic for future research. 7 8
Methods
9Participants
10Participants (Exp1=28, Exp2=20; Exp3=30; Exp4=31; Exp5=29; Exp6=101) were healthy 11
adults recruited from the Laboratoire d’Économie Experimentale de Paris. They reported 12
normal or corrected-to-normal vision, and provided informed consent. Participation was 13
compensated based on performance and duration, at an average rate of 12€ per hour. The 14
Paris School of Economics ethics committee approved the experimental procedures after 15
determining that they complied with all the ethical regulations. Participants were tested in 16
sessions of up to 20 individuals. The number of participants in each experiment depended 17
on the number of people showing up for that particular experiment. We aimed at a minimum 18
of 20 participants in each experiment. 19
Apparatus
20Experiments were run using MATLAB Psychtoolbox32 on a computer screen (17’, 1024x768 21
pixel resolution, 60 Hz refresh rate) viewed from approximately 60 cm. Stimuli appeared on a 22
grey background. 23
Perceptual task (experiments 1-4)
24For experiments 1-4, the task consisted in reporting the dominant letter and the dominant 25
color of an array of 80 letters (Xs or Os), colored blue or orange (see Figure 1A). Each trial 26
started with a 500 ms fixation cross, followed by a 300 ms blank period, and then by the 27
stimulus, which was presented for 1 s. Each letter, in Arial font, occupied approximately 0.5º 28
(degrees of visual angle). Elements were presented within a 10º wide imaginary square. 29
These stimuli were based on the code available at
30
https://github.com/DobyRahnev/Confidence-leak and used in a previous publication33. 31
32
For Experiments 1-3, after the stimuli disappeared, the response screen was presented, 33
which consisted in 4 square boxes that contained a blue square, an orange square, a white 34
O and a white X (see Figure 1A). The 4 boxes were randomly arranged in a 2x2 grid on each 35
trial. Participants gave their response by clicking on a color box and a letter box, in their 36
preferred order. A first response on one dimension (e.g. clicking on the X box) made the 37
corresponding boxes disappear, leaving only the boxes for the other dimension (e.g. the 38
orange box and the blue box), which required a second response. Participants completed 4 39
parts of 4 blocks each, with 25 trials per block. Between block and block, participants could 40
rest for 15 seconds, and at the end of each part they could take self-timed breaks. 41
1
Manipulation of task difficulty (experiments 1-4)
2For each perceptual task, difficulty was manipulated by changing the proportion of the 3
dominant over the non-dominant feature. After a short training, we used psychophysical 4
staircases to estimate, separately for each task, the proportion of items that should be used 5
for responses to be 90% correct (easy condition) or 60% correct (hard condition). Details of 6
the training and staircase procedure are presented in supplementary information 1.1. We 7
then used these parameters in the main experimental part to manipulate difficulty on the 8
letter (easy vs. hard) and color (easy vs. hard) tasks, orthogonally within each participant, in 9
a 2x2 factorial design. For experiments 1-3, we collected 100 trials for each of the 4 10
conditions, with trials of all conditions intermixed within blocks. 11
Experiment 1: confidence ratings
12In Experiment 1, after participants made their two choices, they had to rate their confidence 13
on each of them. Two confidence scales were simultaneously presented, one horizontal for 14
the color task and one vertical for the letter task (see Figure 1A). Each scale featured the 15
two response categories at its ends (which corresponded to 100% confidence) and an empty 16
region at its center (near which confidence was at 50%). The two choices participants had 17
made on that trial were surrounded by a yellow circle. Participants gave their confidence 18
levels on both tasks by clicking on the corresponding scales, and then validated the ratings 19
by clicking at the center of the screen. Participants were told that maximum uncertainty (no 20
preference between their response and the other option within the same task) corresponded 21
to a 50% confidence, and absolute certainty on the choice to a 100% confidence. 22
Experiment 2: choice-only
23Trials in Experiment 2 closely resembled those in Experiment 1, except for the fact that no 24
confidence had to be rated. Thus, the trial finished after participants made a choice for each 25
task on the response screen. 26
Experiment 3: varying delays
27In Experiment 3, we manipulated the time between stimulus offset and the presentation of 28
the response screen, which was set to 0, 2 or 4 seconds (counterbalanced across 29
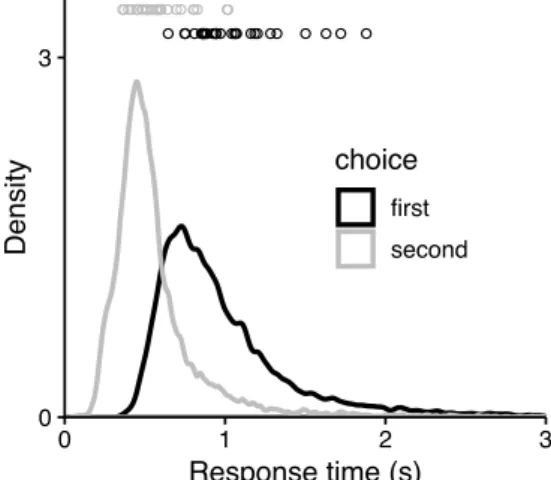
trials).Considering the response times for our previous experiments (see supplementary 30
information 3.4.), 4s ensured that participants had reached both decisions by the time the 31
response screen was presented. 32
Experiment 4: anticipated difficulty in prospective confidence
33In Experiment 4, participants only responded to one task on each trial. Therefore, the 34
response screen uniquely contained the two relevant boxes. The main part was organized in 35
32 blocks. All blocks included a familiarization and a test phase (Figure 3A). During the 36
familiarization phase, participants completed two sets of 6 trials. Each set was associated to 37
a single task (color or letter), a difficulty level (easy or hard), and an animal name (randomly 38
chosen without replacement from a predefined list of common names). Based on staircases 39
ran before the main phase, the proportion for the task-relevant dimension was 40
experimentally controlled, such that for each block, one set contained difficult trials and the 1
other easy trials (for the non-relevant dimension, the proportion was always set at 50%). 2
This manipulation was not revealed to participants but they could learn the difficulty of each 3
set by performing the task during the familiarization phase. After the familiarization, the test 4
phase started. Participants saw a screen with two horizontally aligned boxes presenting (in a 5
random position) the animal names of the two sets just completed. 4 trials of each set had to 6
be completed, with reward in that block depending on performance in that part. Participants 7
decided the order in which to complete the test trials of each set by clicking on the name of 8
the set they desired to complete first. We used animal names to avoid any obvious order 9
bias (set A vs B, or 1 vs 2) for this decision (for the complete list of set names, see 10
supplementary information 9.1.). Across blocks, we manipulated factorially the task 11
(color/letter) used for the first set in the block, the task (color/letter) used for the second set, 12
and the order of the difficulty levels used for the two sets (easy first vs. hard first). This 13
design resulted in 8 conditions, presented in a randomized order as a sequence 4 times per 14
participant. 15
Experiment 5: dissociation between performance and confidence
16For Experiment 5, participants had to categorize the average color of a set of 8 circles as 17
more red or blue. Each trial started with a black fixation cross presented for 400 ms, followed 18
by 8 circles presented simultaneously for 200 ms. Each circle was uniformly colored in RGB 19
space as [255*t, 0, 255*(1-t)] with a color parameter t taking values between 0 (full blue) and 20
1 (full red). The circles, each with an area of 2500 pixels, were regularly spaced on an 21
imaginary circle 120 pixels from fixation. After the stimulus disappeared, the fixation cross 22
turned white and participants had to make a response. For all parts of the experiment, within 23
each block of trials, red was the dominant component (and thus the correct response) for 24
50% of the trials, and blue for the other 50%. Participants had to use the E and R keys of the 25
keyboard to indicate whether the average color was closer to red or to blue. The mapping 26
between each of the two keys and each of the two color responses was randomized across 27
participants. 28
29
On each trial, the color parameter t for each circle was sampled from a standard normal 30
distribution, then multiplied with the standard deviation of the corresponding condition (high: 31
SD= 0.20, low: SD=0.05) and then added to the mean of the corresponding condition, which 32
was determined with a staircase procedure at the beginning of the experiment (see 33
Supplementary Material 1 for details). 34
35
The main part of this experiment greatly resembled that of Experiment 4. On each of its 32 36
blocks, participants were introduced to two sets of trials, each with an animal name: for one 37
set, the generative mean was high, but so was the SD (high condition), whereas for the other 38
both mean and SD were low (low condition). After a familiarization phase where 6 trials of 39
each set were completed, participants had to complete 4 more trials of each set, with these 40
test trials determining payoff at the end of the experiment. However, they could choose the 41
order in which to complete them by clicking on the name of the set they wanted to start with. 42
Apart from the nature of the stimulus, the main difference with respect to Experiment 4 was 43
that the expected difficulty of both sets was always 75%, with the difference between sets 44
laying on the mean and variability of the circles that were generated on each trial. For each 45
participant, we achieved the values leading to a 75% expected performance through an 46
initial staircase procedure for each condition. For more details, see supplementary 1
information 8. 2
3
After the main part of this experiment, participants completed a part where 8 blocks of 24 4
trials were presented. Each trial could have the mean and SD values previously used for the 5
high condition, or those used for the low condition. These two types of trials were interleaved 6
within each block, with each type appearing the same number of times. The crucial feature 7
of this final part was that, after their response, confidence had to be reported. Confidence 8
was given by clicking on a vertical scale that, as in Experiment 1, ranged from 50 to 100. 9
Confidence was only required in this part, and not before, to avoid biasing the participants’ 10
priority choices in the previous part. 11
12
Experiment 6: anticipated difficulty in a mental calculation task
13The stimuli used in Experiment 6 were different from those used in the previous 14
experiments. On each trial, two horizontally aligned boxes appeared (see Figure 5A), each 15
containing a simple formula (e.g. “a+2b”) . Our formulas involved letters connected by basic 16
operators (+, -, *, /) and were sometimes nested by brackets. Both problems were similar 17
except for the operators connecting their respective letters. One of the problems (easy) 18
contained additions and subtractions, while the other (hard) contained multiplications and 19
divisions. The easy and hard box were randomly positioned on the left or the right of the 20
screen on every trial. Participants had to solve both problems in their prefered order. By 21
clicking on one box, the letters of the formula in that box were replaced by one-digit integers. 22
Participants then typed their response, which appeared inside a box below the problem. 23
They could change it as they wanted before pressing the ENTER key to validate it. Then, the 24
non-clicked on problem appeared for participants to give their response through the same 25
method. Each participant completed the same 20 pairs of questions (listed in supplementary 26
information 9.2.), but in a random order. The initial presentations of formulae ensured 27
participants could not try to solve the problems before making a choice. 28
Payoff
29Performance on the main part of the experiments determined the final amount of money 30
participants won. In experiments 2 and 3, for each of the 16 blocks, a random trial was 31
chosen. Within that trial, the choice for either color or letter was also randomly picked. If that 32
choice had been correct, the participant received 1 €, and 0 € otherwise. This payoff method 33
ensured participants kept a stable performance and did not relax their attention or 34
automatized their responses during some trials. 35
36
In Experiment 1, the payoff system was slightly different. Once a trial and a choice had been 37
selected within a block, a number was selected from a uniform distribution between 0 and 38
100. If the number was lower than the confidence given for that choice, the payoff depended 39
on performance. If the number was higher, another random number was sampled from a 40
uniform distribution between 0 and 100. If this number was smaller than the random number 41
previously drawn, 1€ was given, and 0€ otherwise. This system has previously34 been 42
adopted to ensure that participants try to accurately rate their confidence, since their payoff 43
depends on it. On top of this, participants were awarded a fixed 3€ just for the added length 1
reporting confidence gave to the experiment. 2
3
In Experiment 4, payoff was similar to Experiment 2, but given the more numerous and 4
shorter blocks, each of them could be rewarded with only 0.5€. The rest between blocks was 5
also shorter, with a duration of 10 s. 6
7
Experiment 5 had a payoff like Experiment 4, but we also added an extra compensation for 8
the final trials where confidence had to be reported. For each of the 8 blocks in which trials 9
were divided, participants could receive 0.5€ in a procedure like that used in Experiment 1, 10
where reward could depend on performance or on confidence. 11
12
Experiment 6 had a payoff system which mimicked that of the previous experiments. At the 13
end of the experiment, two trials were chosen randomly. For each of these selected trials, 14
the answer to one of the problems was picked. If the answer was correct, participants 15
received 1€, and nothing otherwise. 16
17
Before starting each experiment, participants were carefully informed about the procedure. 18
The payoff structure and its objective were made clear, and the fact that reward did not 19
depend on their response times was also pointed out. 20
Statistics
21All reported t-tests and binomial exact tests are two-tailed. All ANOVA are repeated 22
measures. For t-tests, effect size is reported by using Cohen’s dz, written here as d, which
23
was calculated using Rosenthal’s formula35: the t statistic was simply divided by the square 24
root of the sample size. For ANOVA, effect size is reported by using partial eta squared (𝜂!!). 25
For each factor, this was calculated by taking the sums of squares of the condition, and 26
dividing it by the sums of squares of the condition plus the sums of squares of the error36. 27
Logistic regressions were performed with R’s function glmer, by using maximum likelihood 28
and a logit link function. 29
Code availability
30The code used to produce the analyses and the figures that appear on this study are 31
available from the corresponding author upon reasonable request. 32
33
References
34
1. Peirce, C. S. & Jastrow, J. On Small Differences of Sensation. (1885). 35
2. Fleming, S. M., Dolan, R. J. & Frith, C. D. Metacognition: computation, biology and 36
function. Philos. Trans. R. Soc. Lond. B Biol. Sci. 367, 1280–1286 (2012). 37
3. Dallenbach, K. M. The relation of memory error to time interval. Psychol. Rev. 20, 38
323–337 (1913). 39
4. Wilimzig, C., Tsuchiya, N., Fahle, M., Einhäuser, W. & Koch, C. Spatial attention 40
increases performance but not subjective confidence in a discrimination task. J. Vis. 8, 7 1
(2008). 2
5. Zylberberg, A., Barttfeld, P. & Sigman, M. The construction of confidence in a 3
perceptual decision. Front. Integr. Neurosci. 6, (2012). 4
6. Rahnev, D. A., Maniscalco, B., Luber, B., Lau, H. & Lisanby, S. H. Direct injection of 5
noise to the visual cortex decreases accuracy but increases decision confidence. J. 6
Neurophysiol. 107, 1556–1563 (2012). 7
7. Kc, D. S., Staats, B. R., Kouchaki, M. & Gino, F. Task Selection and Workload: A 8
Focus on Completing Easy Tasks Hurts Long-Term Performance. SSRN Electronic 9
Journal (2017). doi:10.2139/ssrn.2992588 10
8. Moray, N. Mental Workload: Its Theory and Measurement. (Springer Science & 11
Business Media, 2013). 12
9. de Gardelle, V. & Mamassian, P. Does confidence use a common currency across 13
two visual tasks? Psychol. Sci. 25, 1286–1288 (2014). 14
10. de Gardelle, V. & Mamassian, P. Is confidence amodal? Confidence 15
comparison across dimensions of a visual stimulus. J. Vis. 13, 57–57 (2013). 16
11. Kepecs, A., Uchida, N., Zariwala, H. A. & Mainen, Z. F. Neural correlates, 17
computation and behavioural impact of decision confidence. Nature 455, 227–231 18
(2008). 19
12. Wright, G. Changes in the realism and distribution of probability assessments 20
as a function of question type. Acta Psychol. 52, 165–174 (1982). 21
13. Fleming, S. M., Massoni, S., Gajdos, T. & Vergnaud, J.-C. Metacognition 22
about the past and future: quantifying common and distinct influences on prospective 23
and retrospective judgments of self-performance. Neurosci Conscious 2016, niw018 24
(2016). 25
14. de Gardelle, V., Le Corre, F. & Mamassian, P. Confidence as a Common 26
Currency between Vision and Audition. PLoS One 11, e0147901 (2016). 27
15. de Gardelle, V. & Mamassian, P. Weighting mean and variability during 28
confidence judgments. PLoS One 10, e0120870 (2015). 29
16. Boldt, A., de Gardelle, V. & Yeung, N. The impact of evidence reliability on 30
sensitivity and bias in decision confidence. J. Exp. Psychol. Hum. Percept. Perform. 43, 31
1520–1531 (2017). 32
17. Desender, K., Boldt, A. & Yeung, N. Subjective Confidence Predicts 33
Information Seeking in Decision Making. Psychol. Sci. 29, 761–778 (2018). 34
18. Herce Castañón, S. et al. Human noise blindness drives suboptimal cognitive 35
inference. Nat. Commun. 10, 1719 (2019). 36
19. Spink, A., Park, M. & Koshman, S. Factors affecting assigned information 37
problem ordering during Web search: An exploratory study. Inf. Process. Manag. 42, 38
1366–1378 (2006). 39
20. Ibanez, M., Clark, J. R., Huckman, R. S. & Staats, B. R. Discretionary Task 40
Ordering: Queue Management in Radiological Services. Management Science (2017). 41
doi:10.2139/ssrn.2677200 1
21. Sigman, M. & Dehaene, S. Dynamics of the central bottleneck: dual-task and 2
task uncertainty. PLoS Biol. 4, e220 (2006). 3
22. Zalesny, M. D. Rater confidence and social influence in performance 4
appraisals. J. Appl. Psychol. 75, 274–289 (1990). 5
23. Paese, P. W. & Kinnaly, M. Peer Input and Revised Judgment: Exploring the 6
Effects of (Un) Biased Confidence. J. Appl. Soc. Psychol. 23, 1989–2011 (1993). 7
24. Zarnoth, P. & Sniezek, J. A. The Social Influence of Confidence in Group 8
Decision Making. J. Exp. Soc. Psychol. 33, 345–366 (1997). 9
25. Massoni, S. & Roux, N. Optimal group decision: A matter of confidence 10
calibration. J. Math. Psychol. 79, 121–130 (2017). 11
26. Hainguerlot, M., Vergnaud, J.-C. & de Gardelle, V. Metacognitive ability 12
predicts learning cue-stimulus associations in the absence of external feedback. Sci. 13
Rep. 8, 5602 (2018). 14
27. Zylberberg, A., Wolpert, D. M. & Shadlen, M. N. Counterfactual Reasoning 15
Underlies the Learning of Priors in Decision Making. Neuron 99, 1083–1097.e6 (2018). 16
28. Guggenmos, M., Wilbertz, G., Hebart, M. N. & Sterzer, P. Mesolimbic 17
confidence signals guide perceptual learning in the absence of external feedback. Elife 18
5, (2016). 19
29. Daniel, R. & Pollmann, S. Striatal activations signal prediction errors on 20
confidence in the absence of external feedback. Neuroimage 59, 3457–3467 (2012). 21
30. van den Berg, R., Zylberberg, A., Kiani, R., Shadlen, M. N. & Wolpert, D. M. 22
Confidence Is the Bridge between Multi-stage Decisions. Curr. Biol. 26, 3157–3168 23
(2016). 24
31. Puffer, S. M. Task-Completion Schedules: Determinants and Consequences 25
for Performance. Hum. Relat. 42, 937–955 (1989). 26
32. Brainard, D. H. The Psychophysics Toolbox. Spat. Vis. 10, 433–436 (1997). 27
33. Rahnev, D., Koizumi, A., McCurdy, L. Y., D’Esposito, M. & Lau, H. 28
Confidence Leak in Perceptual Decision Making. Psychol. Sci. 26, 1664–1680 (2015). 29
34. Massoni, S., Gajdos, T. & Vergnaud, J.-C. Confidence measurement in the 30
light of signal detection theory. Front. Psychol. 5, 1455 (2014). 31
35. Rosenthal, R. Meta-Analytic Procedures for Social Research. (1991). 32
doi:10.4135/9781412984997 33
36. Lakens, D. Calculating and reporting effect sizes to facilitate cumulative 34
science: a practical primer for t-tests and ANOVAs. Front. Psychol. 4, 863 (2013). 35
Acknowledgements
1
This work was supported by the Agence Nationale de la Recherche [grant ANR-16-CE28-2
0002 to VdG]. We thank Maxim Frolov, Audrey Azerot and Quentin Cavalan for helping in 3
data collection. We thank Mahiko Konishi, Jean-Christophe Vergnaud, Jérôme Sackur, 4
Bruno Berberian and Pascal Mamassian for discussions. We thank Dobromir Rahnev for 5
making available his experiments’ code. 6
Supplementary information
1
2
1. Training and calibration for experiments 1 to 4 21
3
1.1. Procedures 21
4
1.2. Mean and SD of stimulus elements 22
5
1.3. Expected and observed performance 23
6
2. Training and calibration for Experiment 5 24
7
3. Supplementary analyses for Experiment 1 25
8
3.1. Confidence in the first choice vs. in the second choice 25
9
3.2. Confidence as a function of difficulty and accuracy 25
10
3.3. Priority effects from task difficulty in Experiment 1 26
11
3.4. Response times 26
12
4. Logistic regression tables for Experiment 1 28
13
5. Difference in observed accuracy between first and second choice, for experiments 1 14
to 3 30
15
6. Task and position biases 31
16
6.1. Task-related bias 31
17
6.2. Position-related bias 31
18
7. Effect of an easy-first approach on performance 34
19
7.1. Experiments 1 to 5 34
20
7.2. Supplementary experiment controlling response order 36
21
8. Supplementary performance analyses for Experiment 5 38
22
9. Stimulus materials 40
23
9.1. Complete list of animal names used for experiments 4 and 5 40
24
9.2. Complete list of arithmetic problems used for Experiment 6 41
25 10. References 42
26 27 28 29
1. Training and calibration for experiments 1 to 4
12
1.1. Procedures
3
Participants started the experiment with 10 training trials for each task in isolation. During the 4
color training, all the 80 letter elements were either O or X. The color task also started at its 5
easiest, with all the 80 elements being of one color, but it became more difficult at the rate of 6
one element per trial. The predominant color and letter were determined randomly on every 7
trial. After the stimuli, only the two boxes for the color task appeared, and the participant 8
gave a response only for that task. A similar procedure was followed for the letter training 9
block, but with all the elements being one color, and the letter task getting more difficult. The 10
order in which these two training blocks were presented was counterbalanced across 11
participants. 12
13
After the training, participants were told that the real experiment was about to start, 14
composed by 5 parts of 4 blocks each. In the first part, the proportion of elements was 15
manipulated with a staircase procedure that would allow the presentation of performance-16
adjusted easy and hard trials in the subsequent parts. This procedure was not disclosed to 17
participants, to avoid any temptation to manipulate it. The staircase followed a one-up/one-18
down procedure with unequal up and down steps (see e.g. García-Pérez, 1998). 19
Specifically, the initial number of elements in the dominant category was set to 64 out of 80 20
elements (80%-20%) for both tasks, and, it was decreased by one element after a correct 21
response, and increased by four elements after an error. We then used the 100 trials of that 22
first part to estimate for each task a psychometric function, so as to generate parameters for 23
the following parts. For the color task, this function represented the probability of choosing 24
blue as a function of the number of blue elements, and was fit with a cumulative Gaussian; 25
the same for the probability of choosing O for the letter task. To calculate the number of 26
elements corresponding to a 90% performance (our easy condition) in the color task, we 27
used 40 plus or minus the semi-difference between the number of blue elements for which 28
the psychometric curve predicted a 90% and 10% of blue choices, rounded to its nearest 29
integer. Note that by doing so, we assumed that in the main part participants would not be 30
biased towards one response category. Similar procedures were carried out to obtain 31
parameters for the 60% performance (hard condition), and for both difficulties of the letter 32
task. As can be seen in the results section of the main text and in Figure S1, observed 33
performance in the main experiment closely matched the targeted performance. 34
35
In Experiment 4, since each trial only required responding to one task, previous to the main 36
part two staircases were run sequentially, one for the color task and one for the letter task, 37
with a randomized order across participants. Each of them had 100 trials, and the elements 38
of the non-relevant task were kept stable at a proportion of 40/40. These trials were 39
presented to participants as a training part, before the main experiment. 40
41 42