HAL Id: hal-01972351
https://hal.archives-ouvertes.fr/hal-01972351
Submitted on 22 Jun 2020
HAL is a multi-disciplinary open access
archive for the deposit and dissemination of
sci-entific research documents, whether they are
pub-lished or not. The documents may come from
teaching and research institutions in France or
abroad, or from public or private research centers.
L’archive ouverte pluridisciplinaire HAL, est
destinée au dépôt et à la diffusion de documents
scientifiques de niveau recherche, publiés ou non,
émanant des établissements d’enseignement et de
recherche français ou étrangers, des laboratoires
publics ou privés.
Distributed under a Creative Commons Attribution - NoDerivatives| 4.0 International
License
Artificially induced migration of redox layers in a coastal
sediment from the Northern Adriatic
E. Metzger, Dewi Langlet, E. Viollier, N. Koron, B. Riedel, M. Stachowitsch,
J. Faganeli, M. Tharaud, E. Geslin, F. Jorissen
To cite this version:
E. Metzger, Dewi Langlet, E. Viollier, N. Koron, B. Riedel, et al.. Artificially induced migration of
redox layers in a coastal sediment from the Northern Adriatic. Biogeosciences, European Geosciences
Union, 2014, 11 (8), pp.2211-2224. �10.5194/bg-11-2211-2014�. �hal-01972351�
www.biogeosciences.net/11/2211/2014/ doi:10.5194/bg-11-2211-2014
© Author(s) 2014. CC Attribution 3.0 License.
Biogeosciences
Artificially induced migration of redox layers in a coastal sediment
from the Northern Adriatic
E. Metzger1, D. Langlet1, E. Viollier2, N. Koron3, B. Riedel4, M. Stachowitsch4, J. Faganeli3, M. Tharaud2, E. Geslin1, and F. Jorissen1
1Laboratoire des Bio-Indicateurs Actuels et Fossiles, UMR6112 CNRS LPG-BIAF, Université d’Angers, 2 Boulevard Lavoisier, 49045 Angers Cedex, France
2Laboratoire de Géochimie des Eaux, UMR7154 CNRS, Université Paris Diderot, Sorbonne Paris Cité, Institut de Physique du Globe de Paris, 75013 Paris, France
3Marine Biology Station, National Institute of Biology, Fornace 41, 6330 Piran, Slovenia
4Department of Limnology and Oceanography, University of Vienna, Althanstrasse 14, Vienna 1090, Austria
Correspondence to: E. Metzger (edouard.metzger@univ-angers.fr)
Received: 30 June 2013 – Published in Biogeosciences Discuss.: 19 July 2013 Revised: 6 March 2014 – Accepted: 11 March 2014 – Published: 22 April 2014
Abstract. Long-term experimental studies suggest that,
un-der transient anoxic conditions, redox fronts within the sed-iment shift upwards, causing sequential rise and fall of ben-thic fluxes of reduced species (Mn(II), Fe(II) and S(-II)). In-faunal benthic organisms are associated with different re-dox fronts as micro-habitats and must be affected by such changes during natural hypoxia events. In order to document the geochemical evolution of the sediment during prolonged anoxia in the framework of an in situ experiment designed to mimic natural conditions, benthic chambers were deployed on the seafloor of the Northern Adriatic and sampled after 9, 30 and 315 days of incubation. Oxygen and sulfide were measured continuously in the early stages (9 days) of the ex-periment. High-resolution pore water profiles were sampled by DET probes and redox-sensitive species (S(VI), Mn(II) and Fe(II)) and alkalinity were measured.
Starting oxygen saturation was about 80 % within the chamber. After 7 days, anoxia was established in the bottom waters within the chambers. Mn(II) and Fe(II) started dif-fusing towards the anoxic water column until they reached the surficial sediment. Being reoxidized there, Mn and Fe re-precipitated, giving a rusty coloration to the seafloor. Infau-nal species appeared at the sediment surface. After 20 days, all organisms were dead. Decomposition of macro-organisms at the sediment–water interface generated S(-II) within the entire height of the chamber, leading to a down-ward flux of sulfides into the sediment, where they were
quickly oxidized by metallic oxides or precipitated as FeS. S(-II) was below detection in the water column and pore wa-ters at the end of the experiment. Our results suggest that S(-II) enrichment in the water column of coastal systems, which are episodically anoxic, is strongly controlled by the biomass of benthic macrofauna and its decay during anoxia, whereas its residence time in the water column is controlled by iron availability (as solid oxides or as dissolved reduced cations) within the sediment, even without water circulation.
1 Introduction
The increased occurrence of seasonal anoxia and hypoxia in coastal areas reflects a combination of several factors, the most important being nutrient input due to river runoff and stratification of the water column. Since the 1960s a clear in-crease in the occurrence of anoxic events has been observed, often associated with mass mortality of benthic faunas (Diaz and Rosenberg, 2008). In most cases, anoxia occurs in en-vironments that are semi-enclosed, shallow and have fine-grained and organic-rich sediment bottoms. This combina-tion restricts water circulacombina-tion, increases the residence time of water and its solutes, favors stratification and, in areas affected by anthropogenic eutrophication, promotes nutrient accumulation and biomass growth. Oxygen is then depleted by respiration without sufficient resupply. This phenomenon,
2212 E. Metzger et al.: Artificially induced migration of redox layers
however, is not exclusive to semi-enclosed settings. Many es-tuaries where the residence time of water is supposedly rel-atively short also show severe hypoxia (Garnier et al., 2001; Rabalais et al., 2002; Hagy et al., 2004; Lanoux et al., 2013), sometimes leading to fish mortality; this includes estuaries only moderately impacted by anthropogenic eutrophication, such as the Loire River mouth (Abril et al., 2003). Further-more, continental seas such as the Baltic Sea, Black Sea, and the Gulf of Mexico (Rabalais et al., 2002), show an increase in the occurrence and geographic extent of anoxic events. Meire et al. (2013) modeled the evolution of hypoxic events in the Oyster Grounds (central North Sea) and con-cluded that riverine runoff was a key factor influencing the occurrence of hypoxia. In some coastal environments such as Thau Lagoon (French Mediterranean), a decrease of the oc-currence of anoxic events has been reported since the 1990s, which has been interpreted to reflect efficient environmen-tal policies leading to a reduced phosphorus load to the la-goon (Souchu et al., 1998). More recent studies in the same system, however, showed that this trend did not extend into the 2000s. Despite the lower phosphorus loads, a large stock is still available within the sediment of the Thau Lagoon, mainly as shellfish faeces; its recycling under summer con-ditions (i.e., higher temperature and little wind) triggers high benthic fluxes of phosphorus towards the water column, en-hancing primary production and ultimately leading to sea-sonal hypoxia/anoxia as observed in 2003 and 2006 (Mes-nage et al., 2007; Minghelli-Roman et al., 2011). Therefore, coastal systems that experienced decades of eutrophic con-ditions take time to recover. Furthermore, global warming affects oxygen solubility and water stratification worldwide, promoting hypoxia/anoxia. Several authors therefore predict a further increase of the areas affected by anoxia and mass mortality events if no major efforts to decrease nutrient sup-plies to coastal areas are undertaken (Diaz and Rosenberg, 2008; Middelburg and Levin, 2009; Meire et al., 2013).
We conducted a series of in situ experiments in the North-ern Adriatic (Mediterranean Sea), one of the areas repeatedly affected by seasonal hypoxia (Barmawidjaja et al., 1995; Ra-balais, 2010; Giani et al., 2012). They were designed to better understand how anoxia affects benthic macrofauna and meio-fauna survival and how fast the impacted zone attains a new ecological equilibrium. The main objective was to simulate short- to longer-term bottom-water anoxia and to study the survival, resilience and recolonization of different groups of benthic organisms (macrofauna Blasnig et al., 2013; Riedel et al., 2013, 2012), meiofauna such as foraminifera (Lan-glet et al., 2013, 2014), nematodes and copepods (Grego et al., 2013, 2014; De Troch et al., 2013), which are ex-pected to respond differently to anoxia. Seasonal changes in bottom-water oxygenation are known to induce vertical mi-grations of the major redox fronts in the sediment, modifying vertical separation between redox-sensitive elements. The separation between iron and manganese (oxyhydr)oxides in the sedimentary column, for example, is related to
differ-ent kinetics of reduction/oxidation and therefore of disso-lution/precipitation of these metals (Burdige, 2006). Redox oscillations will enhance the accumulation of manganese on top of the sediment. Associated trace metals, including non-redox elements such as cadmium, can also be affected by redox oscillations (Gobeil et al., 1997; Sundby et al., 2004). Experimental studies have shown that cores incubated un-der hypoxic conditions successively released dissolved man-ganese (Mn(II)), iron (Fe(II)) and sulfide S(-II)) to the over-lying water column. This demonstrates that bottom-water oxygenation impacts the vertical extent of redox zones (Kris-tiansen et al., 2002; Sell and Morse, 2006).
In the Northern Adriatic, hypoxic conditions occur sea-sonally in late summer, affecting the recycling of metal ox-ides and bioturbation activity (Faganeli et al., 1985; Hines et al., 1997). Several macrofauna mortality events have been documented (Stachowitsch, 1984, 1991). Moreover, the re-gion is impacted by intense trawl-fishing activities, enhanc-ing the vulnerability to benthic perturbation. The present contribution is part of a multidisciplinary study conducted on a silty-sand bottom at 24 m water depth in the Gulf of Tri-este, Northern Adriatic. It presents the evolution of a series of major chemical species in the bottom waters and surfi-cial sediments during a series of in situ anoxia experiments lasting up to 10 months. Benthic meiofauna and foraminifera preferentially inhabit the top layer of the sediment. Nonethe-less, some of these organisms live in microhabitats that cor-respond to the major redox zones. Those species with a deep infaunal microhabitat can cope better under anoxia (Schön-feld, 2001; Jorissen, 2003). Sulfide, however, seems to be a barrier for vertical migration of foraminifera (Moodley et al., 1998) making the sulfate/sulfide redox front dynamics a key parameter of infaunal survival. Our hypothesis was that, dur-ing our experiment, both the pore-water chemical composi-tion and the vertical distribucomposi-tion of meiofauna would change. Accordingly, the goals of the present study were (1) to de-scribe with high vertical resolution the geochemical evolu-tion of the pore- and bottom waters slightly above and below the sediment–water interface during short- and long-term in-cubation, (2) to better understand the behavior of the main redox species (i.e., oxygen, manganese, iron and sulfur) dur-ing the onset of anoxia, and (3) to provide the geochemical constraints that would potentially explain the response of the benthic fauna to anoxia.
2 Material and methods
2.1 Study area
The study site is located 2.3 km off Piran (Slovenia) in the southern part of the Gulf of Trieste, Northern Adri-atic Sea, at the Marine Biology Station’s hydrographic buoy Vida (45◦32055.6800N, 13◦3301.8900E). This site was se-lected because of a minimal risk of damage to equipment by
commercial fisheries. The Gulf of Trieste covers an area of 600 km2, has a maximal depth of 25 m and is isolated from the rest of the Northern Adriatic by a 100 m-deep shoal. This leads to water residence times of about 250 days (Poulain and Hariri, 2013), which is twice as long as in the Southern Adriatic Sea. The salinity of bottom waters ranges from 36 to 38.5 and bottom-water temperatures range from 8◦C in winter to 20◦C in summer. In late summer, a vertical density gradient can result in bottom-water hypoxia or anoxia (Fa-ganeli et al., 1985). The sediment in the southern part of the Gulf of Trieste is mainly composed of silty sand that is rich in biogenic carbonate (porosity about 0.6, unpublished data). The benthic macrofauna community is dominated by brittle stars, sponges and tunicates (Fedra et al., 1976; Ogorelec et al., 1991) and the sediment is actively bioturbated by poly-chaetes, bivalves and irregular sea urchins. The sedimenta-tion rate, determined by210Pb, is approximately 1.2 mm yr−1 (Ogorelec et al., 1991). The sediment surface is covered by microalgae, mostly diatoms (Bertuzzi et al., 1997), which greatly contribute to the sedimentary organic carbon (OC) input (Ogrinc et al., 2005). The OC content in superficial sediment is about 0.65 wt % (Koron et al., 2013; Ogrinc et al., 2005).
2.2 Experimental setup
A series of benthic chambers was deployed in situ to mimic anoxic events and to isolate the sediment and its overlying waters for different periods of time. We assumed that no ven-tilation occurs during anoxia events and therefore decided against stirring. An abundant literature shows the influence of hydrodynamics on benthic fluxes and suggests that stir-ring is suitable to homogenize the chemical composition of the overlying water and to keep a realistic benthic bound-ary layer in order to determine benthic fluxes (Sundby et al., 1986; Hall et al., 1989; Boudreau, 2001; Viollier et al., 2003). However, since the project was intended to investi-gate whether benthic organisms respond to biogeochemical changes in the surface sediment, the aim of the present study was not to measure benthic fluxes but to describe changes in pore-water chemistry during the development of anoxia. The cubic benthic chambers were made of Plexiglas®, with sides of 50 cm (surface area 0.25 m2, volume 0.125 m3). A sealable aperture on one side enabled inserting and remov-ing probes durremov-ing/after deployment. The three chambers used for our analyses were deployed for 9 days, 1 month and 10 months (Table 1). The “9 days” chamber was equipped with a camera and a set of chemical sensors and has previously been described as an EAGU (Experimental Anoxia Generat-ing Unit, Riedel et al., 2008, 2012; Stachowitsch et al., 2007). In order to optimize the isolation of the benthic chambers (i.e., prevent bioturbation by macroinfauna), the sidewalls were pushed a few centimeters into the sediment; addition-ally, 20 cm-high inox steel plates were pushed into the sedi-ment parallel to the walls. Finally, the area around the
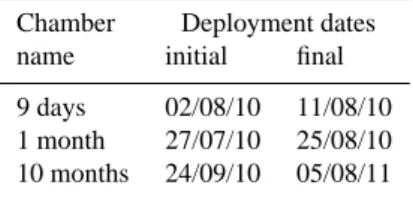
cham-Table 1. Time schedule of deployment for each chamber.
Chamber Deployment dates
name initial final
9 days 02/08/10 11/08/10
1 month 27/07/10 25/08/10
10 months 24/09/10 05/08/11
bers was covered with ceramic tiles to minimize the risk that burrowing could re-ventilate the chambers. In every cham-ber, a series of 8 DET (Diffusive Equilibrium in Thin films) gel probes (Davison et al., 1991; Fones et al., 1998; Metzger et al., 2007) was inserted 24 to 48 h before termination of the experiment, allowing in situ sampling of pore water at a 2 mm resolution (see below, Fig. 6d). DET gel probes were also deployed in an adjacent control area, hereafter referred to as “Normoxic” (Fig. 6a). The distance between the cham-bers did not exceed 10 m and all deployment areas were cho-sen for their visually homogeneous sediment without macro-fauna multi-species clumps.
2.3 Oxygen and sulfide sensors
Two oxygen and two sulfide Clark-type sensors from Unisense® (Revsbech, 1989) were placed within the first chamber, which was opened after 9 days. The four probes were placed at each corner of the chamber. One of each pair was positioned 5 cm above the sediment–water interface, the second one at about 4 mm. Sensors were connected to a spe-cially designed data logger from Unisense®, yielding a mea-surement every 10 min for each of the four sensors.
2.4 DET gel preparation and deployment
For this study, we used a modified version of DGTresearch© perspex probes (Metzger et al., 2007), which minimize probe thickness (3 mm) and vertical channeling. Each probe corre-sponds to 75 cells of 22 µL and a vertical resolution of 2 mm. Probes were rinsed in HCl acid and deionized water before assemblage. A mixture of 1.5 % w/w of ultra-pure agarose (USB Corporation, USA) in deionized water (milli-Q®) was placed in a microwave oven until complete dissolution of the agarose powder. The hot gel was poured into the probe and a glass plate was pressed over it to remove excess hydrogel. After cooling, the remaining excess gel was removed with a Teflon-coated razor blade. Next, the gel was covered with a PVDF hydrophilic membrane (0.2 µm size pore, Millipore, USA). The membrane was fixed onto the probe with com-mercially available PVC plastic tape (Leroy Merlin®), which is sensitive to dissolved H2S (Jézéquel et al., 2007). Gels were stored for at least 24 h in deionized water, which was replaced twice.
Before deployment, DET probes were degassed with N2 overnight and kept under nitrous atmosphere until immersion
2214 E. Metzger et al.: Artificially induced migration of redox layers
28 1
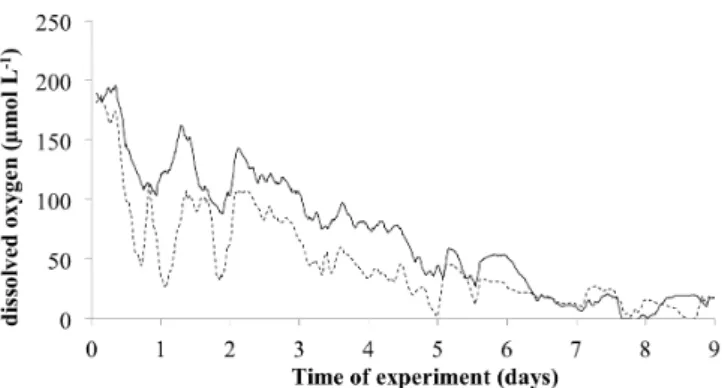
Figure 1: In situ dissolved oxygen concentration inside EAGU chamber (9 days incubation 2
time). Dashed line: oxygen probe 5 cm above SWI. Full line: oxygen probe 4 mm above SWI. 3
Sulfide was always below detection limit for both probes. 4
5
Fig. 1. In situ dissolved oxygen concentration inside EAGU cham-ber (9-day incubation time). Dashed line: oxygen probe 5 cm above SWI. Full line: oxygen probe 4 mm above SWI. Sulfide was always below detection limit for both probes.
to minimize oxygen contamination from the gel to the anoxic sediment during insertion. The DETs were inserted into the sediment of the chamber by Scuba divers through the seal-able aperture in the chamber wall (∅ 20 cm) and then pho-tographed to document their relative position in the chambers as well as the precise location of the sediment–water inter-face. Based on the aperture size and construction, the water exchange during DET insertion was minimal (an estimated 2 L, versus the 125 L content of each chamber). Although the time needed for equilibration of the DET probes is generally only about 4 h (Harper et al., 1997), the gels in the present study were deployed from 24 to 48 h because of operational limitations and to enable the sediment to recover from poten-tial perturbation. The entire retrieval operation (until preser-vation in nitrous atmosphere) took 3 min at most. DETs were sampled and the samples chemically stabilized in the labora-tory within 4 h after retrieval.
2.5 DET preservation and analyses
In total, 8 DET probes were inserted within each incuba-tion chamber. Two probes were dedicated for each type of analysis (e.g., six in total) in order to have two replicates for each chemical profile. The two remaining probes were used as spares.
Gel samples serving for metal determinations were eluted in 5 mL of a 0.01 mol L−1suprapur®nitric acid solution cor-responding to a dilution factor of about 200 of the pore wa-ter (DET gel piece about 25 µL). Dissolved iron and man-ganese were analyzed with a High-Resolution ICP-MS Ele-ment II from ThermoScientific. This ICP-MS enables work-ing in different resolution modes (LR = 400, MR = 4000 and HR=10 000) to better discriminate between elements of in-terest and possible interferences (Krachler, 2007). Mn and Fe were measured at high resolution (HR). At the beginning of each measurement session, the instrument was first tuned to produce maximum sensitivity and stability while also main-taining low oxide formation (UO/U ≤ 5 %). In order to
min-imize analytical time and sample volume, we worked with the SC-FAST automation system coupled to a cyclonic spray chamber (Mahar et al., 2008). A six-port valve rapidly de-livers the sample with a high-flow vacuum pump and rinses the probe sample lines while the sample is analyzed. This allowed us to decrease the analytical time and volume for each sample to 2.5 min and 2 mL. Multiple standard solutions were prepared using 1000 ppm SPEX standard solutions and laboratory-distilled suprapur® nitric acid, and the accuracy and precision of measurements were checked using SLRS-4 and 5 certified standards (NRC-CNRC). The overall uncer-tainty was estimated to be below 6 %.
Gel samples dedicated to sulfate determination were stored in 1 mL of a 0.01 mol L−1zinc acetate solution in or-der to fix all sulfide present in the solution as ZnS, avoiding oxidation into sulfate. Before ionic chromatography analysis, samples were diluted to a final dilution of 800. Standard so-lutions were prepared with filtered subsurface seawater from the Bay of Biscay with a salinity of 34. Sulfate and chlo-ride were measured using a Metrohm 792 Basic IC with a 100 mm Metrosep A supp 5 column. Precision was about 2 %. In order to point out ongoing biogeochemical processes, SO2−4 values are normalized to Cl−and shown as the result of the calculation: (SO2−4 / Cl−)sample × Cl−overlying water. Because Cl− is considered to be a conservative chemical species, variations of normalized sulfate with depth cannot be due to mixing processes.
Gel samples used to determine alkalinity were stabilized directly in 1 mL of the colorimetric reagent that was used for spectrophotometric measurement. A bromophenol blue formic acid reagent was prepared according to Metzger et al. (2013) following the technique proposed by Sarazin et al. (1999). Standard solutions were made with sodium hy-drogen carbonate salt. Measurements were done after 1 h of equilibration at a wavelength of 590 nm. Precision was about 0.3 mmol kg−1.
3 Results
3.1 Dissolved oxygen and sulfide in the chamber
In situ dissolved oxygen and sulfide concentrations obtained from microsensors are shown in Fig. 1. The data logger was started directly after chamber closure and stopped about 9 days later prior to opening the chamber. The data presented in Fig. 1 are averaged values for 1 h periods (i.e., aver-age of 6 values taken every 10 min). Oxygen probes, which were located at two different edges of the chamber and po-sitioned at different distances from the SWI, both showed the same trend, with initial values of about 190 µmol L−1 (about 80 % oxygen saturation) and with minimal values close to zero reached about 7 days later. Data showed a second-class variation with oscillations of variable ampli-tude, without a clear periodicity. Note that during the first
29
1
2
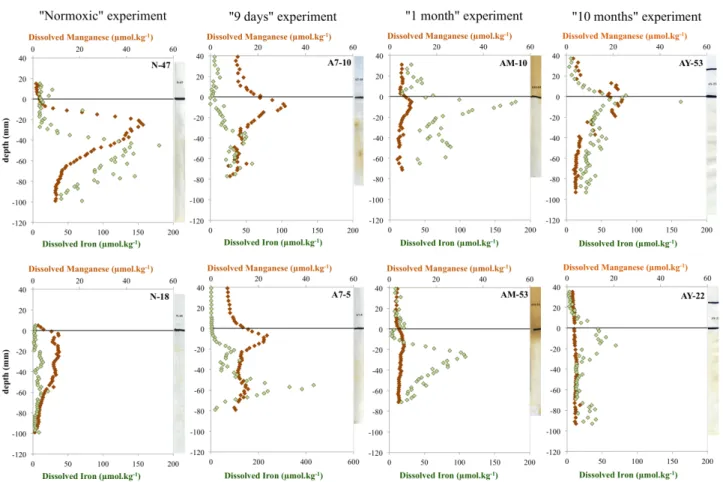
Figure 2: Pore-water dissolved manganese (orange diamonds) and iron (green
3
diamondstriangles
) distribution from DET probes. From left to right: “Normoxic” situation,
4
“9 days” incubation, “1 month” incubation”, “10 months” incubation. White tape sulfide
5
sensor corresponding to the DET probe is shown for each profile.
6
7
Fig. 2. Pore-water dissolved manganese (orange diamonds) and iron (green triangles) distribution from DET probes. From left to right: “Normoxic” situation, “9 days” incubation, “1 month” incubation”, “10 months” incubation. White tape sulfide sensor corresponding to the DET probe is shown for each profile.
5 days of the experiment, probe 2, situated 4 mm above the SWI (full line on Fig. 1), showed a higher oxygen content than the probe located 5 cm above SWI (dashed line). A linear regression yields an estimated oxygen consumption rate about 10 mmol m−2d−1. Sulfide concentration for both probes was below detection limit during the whole experi-ment (< 0.3 µmol L−1).
3.2 Dissolved manganese and iron
Figure 2 shows the vertical distribution of Mn(II) and Fe(II) between 4 cm above the SWI and 10 cm depth in the sed-iment, for four different treatments. From left to right: the profiles from a reference sediment (“Normoxic”) and for the “9 days”, “1 month” and “10 months” experiments. Results from different probes are shown separately, yielding eight profiles (two replicates for each treatment, upper and lower panel). In the “Normoxic” profiles, Mn(II) and Fe(II) show contrasted results between the two replicates. Profiles from DET N47 (upper panel) show large peaks of Mn(II) and Fe(II), while profiles from DET N-18 (lower panel) show smaller variations. Manganese peaks develop from 0 to 6 cm depth with maxima of 47 and 11 µmol kg−1, respectively, at
about 2 cm depth. Iron peaks develop from 2 to 10 cm depth with maxima of 180 and 22 µmol kg−1at about 4.5 and 6 cm depth, respectively. After 9 days of incubation, the vertical distribution of Mn and Fe is different. Mn profiles show sim-ilar trends for both replicates (A7-10 and A7-5), with ele-vated values from 2 cm above the SWI to 3 cm below. Max-ima occur about 1 cm below the SWI, with values of 31 and 24 µmol kg−1, respectively. Iron profiles show peaks devel-oping between 1 and 8 cm below the SWI, with maxima of 58 and 423 µmol kg−1at 5.5 and 6.5 cm depth, respectively. At the end of the “9 days” experiment, relatively elevated Mn concentrations are present in the overlying water com-pared to the “Normoxic” profile (7 to 12 µmol kg−1instead of 1 µmol kg−1). In the “1 month” experiment, Mn in the overlying waters decreases to about 4 µmol kg−1. The pore-water distribution shows relatively weak maxima compared to the “9 days” experiment (9 and 6 µmol kg−1around 1 cm below the SWI for DET AM-10 and AM-53, respectively). Iron peaks have their maxima at 0.5 and 2.5 cm below the SWI, with concentrations of about 179 and 108 µmol kg−1, respectively. A secondary Fe peak is visible directly above the SWI in both profiles. DET AY-53 from the “10 months”
2216 E. Metzger et al.: Artificially induced migration of redox layers
30
1
2
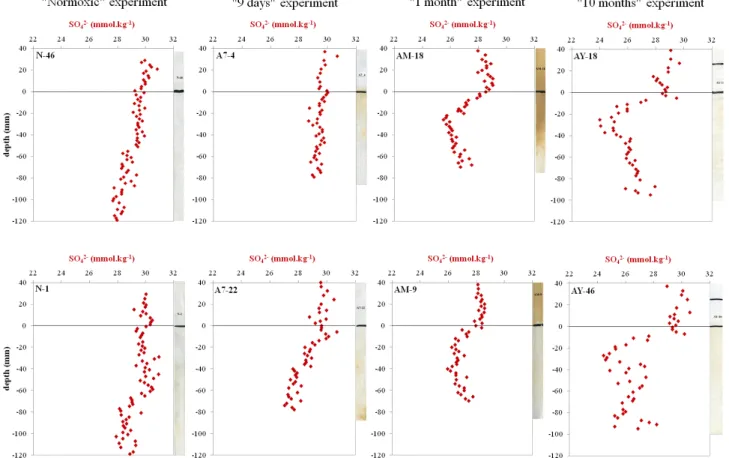
Figure 3: Normalized dissolved sulfate distribution in pore water from DET probes.
3
4
Fig. 3. Normalized dissolved sulfate distribution in pore water from DET probes.
experiment (upper panel) shows concomitant peaks of Mn and Fe, with maximum values at the SWI (23 µmol kg−1for Mn and 80 µmol kg−1 for Fe). The second profile, AY-22 (lower panel), shows a fairly constant Mn concentration with low values (around 3 µM), whereas Fe peaks around 1 cm depth with a maximum concentration of 70 µmol kg−1.
3.3 Sulfate
The vertical distribution of sulfate concentrations in the pore waters is presented in Fig. 3. “Normoxic” profiles show rather constant values of about 30 mmol kg−1 down to 5 cm below the SWI. Deeper down, sulfate slightly decreases by about 2 mmol kg−1 until the bottom of the profiles (12 cm depth). Spatial variability is apparently higher for the “9 days” DETs. DET A7-22 (lower panel) shows a decrease of sulfate from 1 cm below the inter-face (slope = 0.04 mmol/mm; r2=0.83), whereas no de-creasing trend is present in DET A7-4 (upper panel, slope = 0.0052 mmol mm−1; r2=0.15). Minimal SO4(II) concentrations are about 29 and 27 mmol kg−1 for DET AW-4 and AW-22. The “1 month” DETs show lower sul-fate concentrations (28–29 mmol kg−1)in the overlying wa-ter than those described above. Below the SWI, the sul-fate concentration decrease is more important than before
(about 3 mmol kg−1), reaching 26 mmol kg−1at 2 cm depth, and apparently increases slightly deeper down, to reach 27 mmol kg−1at the bottom of the profile (i.e., 6.5 cm depth). The sulfate profiles of the “10 months” experiment are very similar to those of the “1 month” DETs. However, the decrease below the SWI is sharper and stronger (about 4 mmol kg−1). The sulfate gradients below the SWI seem to be sharper and shallower depending on incubation duration.
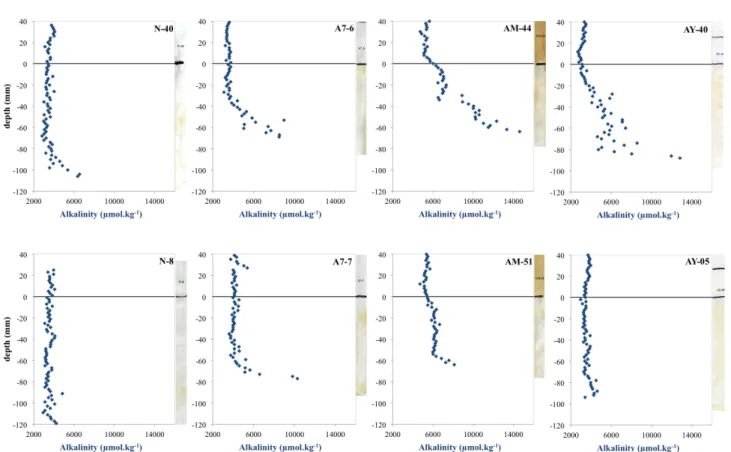
3.4 Alkalinity
The alkalinity measurements of pore waters from the four ex-periments are shown in Fig. 4. The “Normoxic” profiles sug-gest little variation of alkalinity in the overlying waters and downwards through the SWI (3.5 mmol kg−1). Nonetheless, a downward alkalinity increase is evident in both replicates, starting at 7 cm depth for DET N-40 and 11 cm depth for DET N-8. The two “9 days” DETs show similar profiles with constant values in overlying waters and in the upper part of the sediment (3.5 and 4 mmol kg−1for DETs 06 and A7-07), and increasing concentrations in the deeper part of the sediment (starting at 4 and 6 cm below SWI, respectively). Values reach 8.5 and 11 mmol kg−1 in the two replicates. The “1 month” DETs show a relatively large variability be-tween the two replicates. The overlying waters have a higher
31
1
Figure 4:
Pore Pore-
water alkalinity distribution from DET probes.
2
3
Fig. 4. Pore-water alkalinity distribution from DET probes.
alkalinity than before (about 5 mmol kg−1 instead of 3.5– 4 mmol kg−1in “Normoxic” and “9 days” chambers). From 1 cm above the SWI to the first cm below, alkalinity increases slightly to 7 and 6 mmol kg−1 for DETs 44 and AM-51. Values remain more or less consistant downward until a rapid increase starting at 3.5 and 5.5 cm depth, respectively. Alkalinity, respectively between DET AM-44 and AM-51 mentionned just above reaches 14 and 8 mmol kg−1at 7 cm depth. The “10 months” profiles show contrasting patterns between the two replicates. DET AY-40 (upper panel) shows an alkalinity increase, with depth starting 2 cm below the SWI and peaking at 13 mmol kg−1. Conversely, DET AY-05 shows little variation with depth and values fluctuate only within a range of 1 mmol kg−1. The overlying waters of both replicates show alkalinity concentrations of about 3.5 mmol kg−1, comparable to the “Normoxic” values.
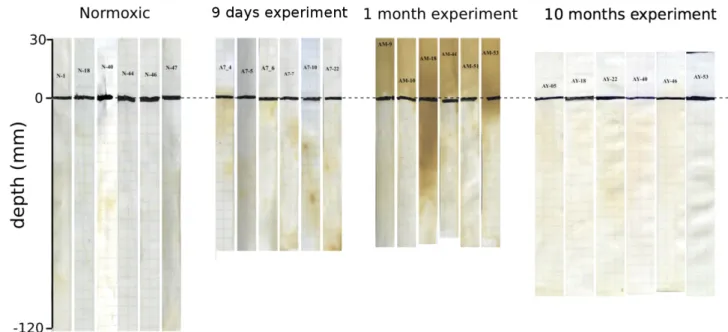
3.5 H2S-sensitive white tape coloration
Figure 5 shows the collection of the originally white PVC tapes used for each different DET probe at each experi-ment (6 DET × 4 experiexperi-ments). The tapes are shown together with the respective pore-water profiles to facilitate discus-sion. After retrieval, the tapes were glued in a notebook
at half-centimeter height (visible in the figure). The “Nor-moxic” tapes are predominantly white below the SWI. The “9 days” tapes show dispersed brownish areas within the sed-iment, indicating the release of H2S into the pore waters. The “1 month” tapes show much more continuous dark-brown zones below the SWI, but the pore-water variability seems to be very high. Contrary to the previous experiments, the “1 month” tapes also show a very dark coloration above the SWI. Finally, the “10 months” tapes are mostly whitish, com-parable to the “Normoxic” tapes.
4 Discussion
4.1 Sedimentary geochemistry under summer
“Normoxic” conditions
According to oxygen electrode profiles measured in the “9 days” chamber (Fig. 1, Table 2), the oxygen consumption rate in our study site is about 10 mmol m−2d−1. This rate corresponds in the Adriatic to an oxygen penetration depth of about 5 mm (Epping and Helder, 1997). Manganese pro-files from the “Normoxic” DETs show a gradient across the SWI, indicating that Mn(II) diffuses upward towards the SWI
2218 E. Metzger et al.: Artificially induced migration of redox layers
32
1
Figure 5: Dissolved H
2S occurrence during DET deployment as indicated by PVC white
2
tapes (brown coloration).
3
4
Fig. 5. Dissolved H2S occurrence during DET deployment as indicated by PVC white tapes (brown coloration).
and the overlying waters and is oxidized there. Reduced iron, however, remains confined within the sediment as suggested by the deep location of iron peaks in Fig. 2 (from 2 to 10 cm depth). These results suggest that there is little chance for Fe(II) to react directly with free oxygen because its pene-tration would not exceed a few millimeters. Therefore, iron oxidation, which under “Normoxic” conditions takes place in deeper sediment layers, is probably due to other oxidants such as manganese oxides or nitrate (measured in the pore waters by Koron et al., 2013). An earlier study investigated the seasonal evolution of metabolic pathways of mineral-ization processes in the same area (Hines et al., 1997). In September 1993, when bottom waters were hypoxic and the water column was stratified, Hines and coworkers demon-strated that anaerobic mineralization processes were as im-portant as aerobic processes. They suggested that consider-able benthic oxygen consumption was due to the upward diffusion of reduced components such as Mn(II) and Fe(II) towards the water column. They were, however, unable to observe the efflux of reduced metals at the centimeter resolu-tion they used. The present study improved the vertical res-olution of profiles. Despite considerable lateral heterogene-ity, it provides evidence of Mn(II) diffusion towards the bot-tom water even while the water column was well oxygenated. In the next section we discuss the further evolution of man-ganese and iron mobility during anoxia in order to verify the hypothesis of Hines et al. (1997) that manganese and iron are important consumers of oxygen during strong hypoxia and/or anoxia. Sulfate concentrations (Fig. 3) decrease below 5 cm depth, showing very slight gradients (at most ≤ 10 % of sulfate was consumed 12 cm below the SWI). The white tapes were very slightly discolored only in scattered zones
Table 2. Oxygen uptake estimated from previous studies in the Northern Adriatic and corresponding organic carbon percentage when available. Reference mmol m−2d−1 OC (%) This study −9.93 0.7 Riedel et al. (2008) −77.17 – Stachowitch et al. (2007) −40 to −80 – Epping et al. (1997) −3 to −30 0.3 to 1.7 Bertuzzi et al. (1996) −5 to −30 0.5 to 1.8
within the sediment. In other shallow-water environments these qualitative probes turned dark grey/brown when sulfide concentrations reached millimolar amounts, a few centime-ters below SWI (e.g., Thau Lagoon, Jézéquel et al., 2007; Metzger et al., 2013; Arcachon Basin, Metzger, unpublished data).
The “Normoxic” samples were taken in early August 2010, when temperature was lower than the monthly aver-age. In this area, marine snow events are common, occur-ring almost every summer (Malej, 1995). In 2010, marine snow first developed in late August, suggesting that the sedi-ment at the sampling station was not yet under “late summer conditions”, characterized by considerable input of fresh or-ganic material. During our experiment we estimated an oxy-gen uptake of about 10 mmol m−2d−1. This value is very low compared to those obtained at other sites for the same season and region. A previous study in the Gulf of Trieste showed a summer oxygen uptake approaching 30 mmol m−2 d−1(Bertuzzi et al., 1997). This large difference can be ex-plained by the fact that the sediment at their station had much
higher organic carbon content (1.7 % at the surface) than our sites (0.65 %, Koron et al., 2013; Hines et al., 1997). After a marine snow deposit, oxygen consumption rates should be higher, although no measurements are available for our study area. The time needed to completely consume all oxygen in the benthic chamber (7 days, Fig. 1) in our “9 days” exper-iment is very long compared to previous observations with the same device in the same period of the year (Stachow-itsch et al., 2007; Riedel et al., 2008). In those experiments, respiration of the enclosed macrofauna led to a rapid oxy-gen decrease in the chamber (i.e., anoxia after maximum 4 days), with calculated oxygen uptake varying from 40 to 80 mmol m−2d−1(Table 2). Those studies also showed sul-fide production less than 1 day after oxygen depletion. This indicates a rapid total consumption of all oxidants other than sulfate (e.g., nitrate, Mn and Fe oxides) in the surface sedi-ment and the water column, which did not occur in our ex-periment.
The main difference between the present experiment and all previous ones is that the latter were conducted over macro-/megafaunal multi-species slumps, whereas for the present experiment, areas without visible macrofauna were selected. In our opinion, the large differences in oxygen con-sumption and the time needed to reach total anoxia mainly reflect the highly contrasting respiration by and decay of macrofauna, or enhanced deposition of labile carbon by fauna.
In summary, in our “Normoxia” sediments, diagenetic pro-cesses are not very intense for summer conditions in a coastal area of the supposedly eutrophic Northern Adriatic. Sulfate reduction rates reported by Hines et al. (1997) were lower at our study station than at their station in the Bay of Piran, lo-cated a few kilometers southeast of the buoy (our station) and closer to shore (Hines et al., 1997). This may reflect a larger sediment grain size and a lower organic carbon content at our station. Note, however, that those authors showed that, in late summer (September 1993), when the water column was stratified and oxygen saturation at the bottom was 45 %, sulfate reduction rates near the buoy increased from about 0 to 300 nmol cm−3d−1in the top sediment layer. In our “9 days” experiment, the oxygen concentration at the sea floor was about 200 µmol kg−1, corresponding to a saturation de-gree of about 80 %; this suggests very low sulfate reduction rates, especially near the SWI.
4.2 Vertical redox fluctuations versus lateral heterogeneity
Previous EAGU deployments in the nearshore area off Piran by Stachowitsch and co-workers Riedel et al. (2008, 2012) and Stachowitsch et al. (2007) showed a typical pattern of oxygen and sulfide concentrations within the chamber. After closure, oxygen was quickly depleted and sulfide began to accumulate (see above). Also, laboratory experiments using cores sampled in other environments showed a clear
relation-ship between oxygen concentration in the bottom waters and sediment-to-water-column fluxes of Mn(II), Fe(II) and S(-II) (Kristiansen et al., 2002; Sell and Morse, 2006). The kinetics experiment performed by Kristiansen and co-workers clearly showed that reduced compounds accumulated more in the overlying water during more severe hypoxia. They showed that long-term reductive dissolution of manganese and iron (oxyhydr)oxides under hypoxic conditions ultimately leads to their exhaustion, allowing the upward diffusion of sulfides and their flux into the overlying waters. Therefore, a tempo-ral succession in the release of Mn(II), Fe(II) and S(-II) is generally interpreted as an upward migration of redox layers after exhaustion of all free oxygen and other possible oxi-dants (e.g., Balzer, 1982; Sundby et al., 1986; Aller, 1994; Skoog and Arias-Esquivel, 2009). Following this conceptual model, we expected that, after total oxygen consumption in the EAGU chambers, a flux of Mn(II) and Fe(II) into the chamber would occur due to the upward migration of redox fronts. After approximately 3 days, metallic oxides should have been consumed and S(-II) should have started diffusing into the chamber as it has occurred in previous EAGU exper-iments. Considering the Mn(II), Fe(II), SO4(-II) and alkalin-ity profiles (Figs. 3 to 5), our data set supports this model. Manganese maxima occur 2 cm below SWI in the “Nor-moxic” profiles and shift upwards to 1 cm below SWI after 9 days (“1 week” profiles). After “1 month”, the position of the Mn(II) maxima does not change, but their intensity decreases from about 30 µmol kg−1to less than 10 µmol kg−1, strongly suggesting that sediment Mn-oxides become exhausted due to reduction. After “10 months”, the two profiles contrasted: one is nearly straight, suggesting that all solid manganese oxides have been consumed, whereas the second profile still shows a maximum of about 60 µmol L−1near the SWI. This important difference points to considerable lateral hetero-geneity within the sediment of our chambers, complicating the interpretation of the temporal trends. Nonetheless, de-spite this spatial heterogeneity, the overall upward shift of manganese redox front during the experiment is evident.
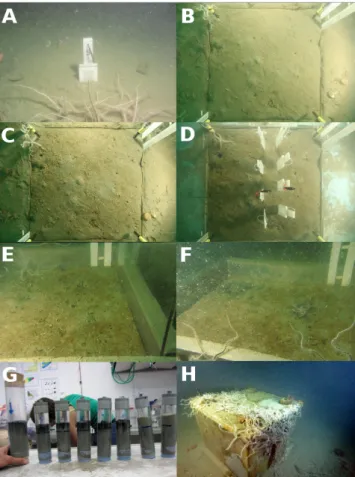
Reduced iron profiles show a more complex picture, with some profiles showing a double peak, indicating a more com-plex sedimentological history. For instance, double Fe(II) peaks may occur after rapid sediment deposits, burying a surficial sediment enriched in metal oxides (Deflandre et al., 2002). In our data, Fe(II) maxima are located 6 cm below SWI after 9 days and have migrated to the SWI in one of the “1 month” profiles. Evidence of iron diffusion into the chamber is given by the progressive orange coloration of the seabed (Fig. 6, photos A to F), which indicates reoxidation of upwardly diffusing Fe(II) by oxidants such as oxygen or nitrate.
Sulfate profiles point to sulfate reduction below 6 cm depth in the “Normoxic” profiles. After “9 days”, SO4(-II) reduc-tion appears to occur only a few millimeters below the SWI. In the following weeks, the sulfate gradient becomes steeper, with a decrease of about 3 and 5 mmol kg−1in the first 2 cm
2220 E. Metzger et al.: Artificially induced migration of redox layers
33 1
Figure 6: A: “Normoxic” DET probe on seabed. B: “9 days” chamber (EAGU) directly after
2
chamber closure. C: “9 days” chamber after 8 days. D: “9 days” chamber directly before 3
opening of chamber. E: “1 month” chamber on 10 August. F: “1 month” chamber on 17 4
Fig. 6. (A): “Normoxic” DET probe on seabed. (B): “9 days” cham-ber (EAGU) directly after chamcham-ber closure. (C): “9 days” chamcham-ber after 8 days. (D): “9 days” chamber directly before opening of the chamber. (E): “1 month” chamber on 10 August. (F): “1 month” chamber on 17 August. (G): six cores on the left sampled inside the “1 month” chamber. Two cores on the right sampled outside the “1 month” chamber. (H): photo of “10 months” chamber 1 month before opening (photo: T. Makovec).
in the “1 month” and “10 months” profiles, respectively. The sulfide probes (white tapes; Fig. 5) show a very large spa-tial variability of the free sulfide distribution in the benthic chambers, confirming the considerable heterogeneity of the sediment. In fact, the DET probes point to minimal concen-trations of free sulfide within the sediment: only a few DETs show brown-grey patches.
Summarizing, our data set strongly suggests that the suc-cessive redox layers, which can be interpreted as microhab-itats for infaunal meiofauna communities (Jorissen, 2003), shifted upwards during the experiment. Nonetheless, this up-ward shift was slower than expected because no S(-II) release was observed during the first 9 days of the experiment, un-like previous studies in the area using the same analytical ap-proach (Riedel et al., 2008, 2012; Stachowitsch et al., 2007). These results support the model of successive release of re-duced compounds towards the water column under anoxic conditions (e.g., Balzer, 1982; Sundby et al., 1986; Aller,
1994; Skoog and Arias-Esquivel, 2009), and underline the importance of manganese and iron recycling under anoxic conditions in different coastal settings.
The upward shift of redox layer documented here seems to have constrained the temporal evolution of the macro- and meiofauna. Copepods drastically decreased with anoxia du-ration: no living individuals were found after 1 month (Grego et al., 2014). The foraminifera, however, retained high densi-ties throughout the experiment (Langlet et al., 2013), under-lining that copepods were more sensitive to redox conditions than foraminifera. The foraminiferal abundance of the first half-centimeter was affected by anoxia, while the deeper mi-crohabitats did not change over time, suggesting that shifts of redox zonation did not affect infaunal organisms. The next section gives an explanation of what controlled foraminifera dynamics as discussed in detail in Langlet et al.(2013, 2014).
4.3 Unexpected sulfide feature
Surprisingly, the overlying waters show a different pattern for free sulfide (S(-II)) from what we expected (i.e., an in-creasing efflux of sulfide from the sediment during anoxia). Although most chambers show no S(-II) in the overlying wa-ters, the tapes on all the DETs deployed in the “1 month” chamber were intensely discolored above the SWI; this strongly contrasts with the absence of S(-II) in the sediment of four of the DET probes. Only two of the DETs demon-strate sulfide penetration into the sediment, about 2 cm in DET AM-53, and about 5 cm in DET AM-18. This con-trast between sulfide-rich overlying waters and sulfide-poor sediment strongly suggests that FeS precipitation limits S(-II) accumulation and therefore that deep sediment is not a source of sulfides(-II), as indicated by the Kristiansen model and other studies on seasonally anoxic basins (Brüchert et al., 2003; Metzger et al., 2013). Rather, S(-II) is produced at the SWI or slightly above. Figure 6f shows the black coloration produced by the decomposition of several brittle stars after 3 weeks of incubation. These were introduced in the chambers at the beginning of the experiment as “visible anoxia probes” because most chambers were not equipped with sensors. We consider the presence of this introduced epifauna to have had a negligible influence on the sedi-mentary processes because its biomass is small (particularly compared with the infauna). These individuals represent a minimum contribution of the otherwise dominant macroepi-fauna (which we rigorously avoided when positioning our chambers in order to focus on developments within the sed-iment). Importantly, the presence (and decomposition) of a full macroepifauna in “natural” anoxia events supports and strengthens our interpretations about the influence of de-caying organic material on the sediment surface. Figure 6g shows that all cores sampled in the “1 month” chamber had a very dark layer at the SWI, versus the homogeneous grey coloration in cores taken outside the chamber. These macro-scopic observations strongly suggest that the decomposition
of infaunal macroorganisms has generated a thin layer of dark sediment at the SWI, probably rich with iron sulfide pre-cipitates. The visual analysis of time-lapse photographs taken with the EAGU indicates that, during the first week of the experiment, brittle stars were still alive; they tiptoed (“arm-tipping”) in order to raise their respiratory organs higher in the progressively oxygen-depleted overlying waters, as shown in previous studies (Riedel et al., 2013). After a few days of incubation (while oxygen decreased), infaunal organ-isms migrated to the sediment surface and died at the SWI when oxygen disappeared. The organic carbon (OC) con-tent in the “1 month” cores showed no clear vertical trend and no significantly higher contents that would suggest any organic matter supply due to macrofaunal mortality (Koron et al., 2013). Since the OC content of the sediment is con-trolled by the balance between input and mineralization pro-cesses, the absence of a clear Corg signal does not mean there is no Corg input; it can suggest a rapid remineralization of dead organisms. The presence of S(-II) in the overlying wa-ters, accompanied by the presence of a very dark layer at the SWI around the remains of dead organisms, is probably due to the decomposition of these organisms, mainly by sulfate-reducing bacteria. In fact, during hypoxic events, Hines et al. (1997) observed maximum sulfate reduction rates in the top of their sediment cores, corroborating our hypothesis. Be-cause macrofaunal remains are mainly decomposed on top of the sediment, produced S(-II) can diffuse into the overlying waters without being oxidized by sedimentary metal oxides. This would explain the intense brown coloration of the white tapes above the SWI (Fig. 5). Accordingly, the sediment col-umn acts as a sink rather than a source for S(-II) formed at the SWI, as indicated by the brownish color on the upper part of the PVC tapes of two of the DETs. The deep penetration of sulfide in two of the profiles could be explained by the pres-ence of relict burrows. For DET AM-53, such a burrow could explain why no dissolved iron was measured in pore waters shallower than that depth, whereas the maximum concentra-tion occurred at the SWI for the other replicate (AM-10).
Importantly, after prolonged anoxia this source of S(-II) at the SWI disappears: no S(-II) was observed in the “10 months” probes. Note here that DET probes were inserted immediately before opening the chambers and are repre-sentative of chemical conditions within the chamber at the end of the incubation. Between 1 month and 10 months of incubation, all produced S(-II) apparently diffuses into the sediment and disappears by precipitation together with re-duced iron and manganese, or is oxidized by the iron and manganese (oxyhydr)oxides from the sedimentary lattice. Within the sediment, sulfate reduction continues, but the produced S(-II) is never detected (i.e., no discolored PVC tapes). Accordingly, sandy sediment apparently behaves as an auto-depurative system, where metallic (oxyhydr)oxides limit the residence time of S(-II) within the sediment and in overlying waters. Indeed, the iron concentration within the sediment is about 350 µmol g−1 at the surface and a
few decimeters below (Hines et al., 1997). This stock of iron is mainly coated onto the surface of silicates as Fe2O3 (Arˇcon et al., 1999) and constitutes a large reservoir of re-ducible iron. Langlet et al. (2013) reported that foraminifera survived 10 months of anoxia. Abundant literature has re-ported foraminiferal survival under anoxic conditions, but this is the first time that in situ long-term experiments were conducted. Langlet et al. (2013) suggest that the additional input of Corg at 1 month led to an increase of top-layer foraminiferal density. S(-II) is a toxin that, even at micro-molar concentrations, impairs biological processes necessary for organisms’ metabolism, meaning that the sulfate/sulfide redox layer act as a bottom barrier for infaunal foraminifera microhabitats (Bagarinao, 1992; Giere, 2008; Moodley et al., 1998). Nonetheless, it seems that the control of pore-water S(-II) content by the (oxyhydr)oxides of the sedimentary lat-tice prevented foraminifera to be poisoned and was, in conse-quence, a key parameter enabling long-term survival of ben-thic foraminifera under anoxia.
4.4 Representativeness of the in situ experiments
Do our long-term (up to 10 months), in situ, closed benthic chambers realistically show how anoxia impacts the chemi-cal conditions of the bottom waters and the superficial sed-iment layers, as well as the response of the living organ-isms? The lack of bottom-water renewal (ventilation) is a key factor leading to hypoxia in bottom waters (Middel-burg and Levin, 2009). In “natural” anoxia, considerable or-ganic matter input to the sediment – due to high primary production and subsequent phytodetritus deposition – in-creases the sedimentary oxygen demand. This, in turn, trig-gers anoxic events, leading to mass-mortality events, causing an even higher oxygen demand (Deslous-Paoli et al., 1998; Souchu et al., 1998; Stachowitsch, 1984, 1991). Our exper-imental design does mimic the stratification-related block-age of bottom-water ventilation and organic and mineral in-put into the sediment. It does not, however, mimic mixing in the sub-pycnocline layer, although bi-directional (tidal) and circular bottom-water currents during “natural” anoxia would be expected to have a homogenizing effect rather than in themselves governing benthic processes. Another poten-tial bias is the entrapment of organisms, since some might be able to migrate to less hostile environments. We can ex-clude this as a substantial issue because we deployed our chambers on sediment without visible macroepifauna. More-over, successful longer-distance migration or escape of such epifauna and infauna is unlikely in anoxia events extending across hundreds to thousands of square kilometers. Despite the inherent problems in extrapolating from the small to the large scale, our system successively (1) stopped water ex-change, (2) led to a total benthic oxygen consumption and a concomitant upward migration of redox zones, (3) induced mortality of the macroinfauna, and (4) produced significant amounts of S(-II) at the sediment–water interface due to the
2222 E. Metzger et al.: Artificially induced migration of redox layers
anaerobic decomposition of the freshly emerged organisms. Summarizing, our experimental setup, despite certain con-straints, satisfactorily mimicked the course of events in the natural ecosystem. The setup also provided new results that indicate the prominent role of benthic biomass and the sed-imentary content of metallic (oxyhydr)oxides in controlling S(-II) residence time in (1) the pore waters which probably allowed meiofauna long-term survival and, more important regarding epifauna survival, in (2) the anoxic water column of sandy coastal settings.
5 Conclusions
The long-term incubation experiment conducted on the silty sand sediment in the Northern Adriatic Sea near Piran en-abled us to document, under realistic in situ conditions, how prolonged anoxia changes the geochemistry of the pore ters of the superficial sediment and the overlying bottom wa-ters. Despite the apparent upward migration of several re-dox species (Fe(II), Mn(II), SO4(-II)), there is no obvious release of sulfide from the sediment into the overlying wa-ters. On the contrary, sulfides are apparently produced at the sediment–water interface, after the death and subsequent anaerobic degradation of macrofaunal organisms. Our exper-iment shows that, despite an important sulfide release to the water column (i.e., saturation of H2S sensors above the SWI), its residence time within the chamber is limited due to iron present either as oxide minerals that oxidize sulfide or as dis-solved reduced components that precipitates as iron sulfide minerals. This suggests that sandy sediments can act as effi-cient sinks for sulfide during anoxia events.
Acknowledgements. We would like to thank the director and staff of the Marine Biology Station in Piran for their support during this project. Alexandra Haselmair and Ivo Gallmetzer provided considerable support (diving and otherwise) during the fieldwork and took several sets of photographs for the longer-term aspect. Nadège Blon provided access to the ionic chromatograph from the Department of Chemistry of the University of Angers and provided technical assistance in analyses. In addition, we would like to thank Peter Kraal and the anonymous referees for their help in improving this manuscript. The present study was financed by the Austrian Science Fund (FWF; project P21542-B17) and supported by the OEAD Bilateral French Austrian Scientific Technical Cooperation project FR 13/2011.
Edited by: J. Middelburg
The publication of this article is financed by CNRS-INSU.
References
Abril, G., Etcheber, H., Delille, B., and Borges, M. F. A. V.: Car-bonate dissolution in the turbid and eutrophic Loire estuary, Mar. Ecol. Prog. Ser., 259, 129–138, 2003.
Aller, R. C.: The sedimentary Mn cycle in Long Island Sound: Its role as intermediate oxidant and the influence of bioturbation, O2, and Corg flux on diagenetic reaction balances, J. Mar. Res., 52, 259–295, 1994.
Arˇcon, I., Ogrinc, N., Kodre, A., and Faganeli, J.: EXAFS and XANES characterization of sedimentary iron in the Gulf of Tri-este (N. Adriatic), J. Synch. Radia., 6, 659–660, 1999.
Bagarinao, T.: Sulfide as an environmental factor and toxicant: tol-erance and adaptations in aquatic organisms, Aquat. Toxicol., 24, 21–62, 1992.
Balzer, W.: On the distribution of iron and manganese at the sed-iment/water interface: thermodynamic versus kinetic control, Geochimica et Cosmochimica Acta, 46, 1153–1161, 1982. Barmawidjaja, D. M., van der Zwaan, G. J., Jorissen, F. J., and
Puskaric, S.: 150 years of eutrophication in the northern Adriatic Sea: Evidence from a benthic foraminiferal record, Mar. Geol., 122, 367–384, 1995.
Blasnig, M., Riedel, B., Zuschin, M., Schiemer, L., and Stachow-itsch, M.: Short-term post-mortality predation and scavenging and longer-term recovery after anoxia in the northern Adriatic Sea, Biogeosciences, 10, 7647–7659, doi:10.5194/bg-10-7647-2013, 2013.
Boudreau, B.: The Benthic Boundary Layer?: Transport Processes and Biogeochemistry: Transport Processes and Biogeochemistry, Oxford University Press, Oxford, 2001.
Brüchert, V., Jørgensen, B. B., Neumann, K., Riechmann, D., Schlösser, M., and Schulz, H.: Regulation of bacterial sulfate reduction and hydrogen sulfide fluxes in the central Namibian coastal upwelling zone, Geochimica et Cosmochimica Acta, 67, 4505–4518, 2003.
Burdige, D. J.: Geochemistry of marine sediments, Princeton Uni-versity Press, Princeton, 2006.
Davison, W., Grime, G. W., Morgan, J. W., and Clarke, K.: Distri-bution of dissolved iron in sediment pore waters at submillimetre resolution, Nature, 352, 323–325, 1991.
Deflandre, B., Mucci, A., Gagné, J.-P., Guignard, C., and Sundby, B.: Early diagenetic processes in coastal marine sediments dis-turbed by a catastrophic sedimentation event, Geochimica et Cosmochimica Acta, 66, 2547–2558, 2002.
De Troch, M., Roelofs, M., Riedel, B., and Grego, M.: Structural and functional responses of harpacticoid copepods to anoxia in the Northern Adriatic: an experimental approach, Biogeo-sciences, 10, 4259–4272, doi:10.5194/bg-10-4259-2013, 2013. Deslous-Paoli, J.-M., Souchu, P., Mazouni, N., Juge, C., and
Da-gault, F.: Relations milieu-ressources: impact de la conchyli-culture sur un environnement lagunaire méditerranéen (Thau), Oceanol. Ac., 21, 831–843, 1998.
Diaz, R. J. and Rosenberg, R.: Spreading Dead Zones and Conse-quences for Marine Ecosystems, Science, 321, 926–929, 2008. Epping, E. H. G. and Helder, W.: Oxygen budgets calculated fromin
situ oxygen microprofiles for Northern Adriatic sediments, Con-tin. Shelf Res., 17, 1737–1764, 1997.
Faganeli, J., Avˇcin, A., Fanuko, N., Malej, A., Turk, V., Tušnik, P., Vrišer, B., and Vukoviˇc, A.: Bottom layer anoxia in the central
part of the Gulf of Trieste in the late summer of 1983, Mar. Pollut. Bull., 16, 75–78, 1985.
Fedra, K., Ölscher, E. M., Scherübel, C., Stachowitsch, M., and Wurzian, R. S.: On the ecology of a North Adriatic benthic com-munity: Distribution, standing crop and composition of the mac-robenthos, Mar. Biol., 38, 129–145, 1976.
Fones, G. R., Davison, W., and Grime, G. W.: Development of con-strained DET for measurements of dissolved iron in surface sed-iments at sub-mm resolution, Sci. Total Environ., 221, 127–137, 1998.
Garnier, J., Servais, P., Billen, G., Akopian, M., and Brion, N.: Lower Seine River and estuary (France) carbon and oxygen bud-gets during low flow, Estuaries, 24, 964–976, 2001.
Giani, M., Djakovac, T., Degobbis, D., Cozzi, S., Solidoro, C., and Umani, S. F.: Recent changes in the marine ecosystems of the northern Adriatic Sea, Estuarine, Coast. Shelf Sci., 115, 1–13, 2012.
Giere, O.: Meiobenthology: The Microscopic Motile Fauna of Aquatic Sediments, Springer, 2008.
Gobeil, C., Macdonald, R. W., and Sundby, B.: Diagenetic separa-tion of cadmium and manganese in suboxic continental margin sediments, Geochimica et Cosmochimica Acta, 61, 4647–4654, Grego, M., Stachowitsch, M., De Troch, M., and Riedel, B.:
CellTracker Green labelling vs. rose bengal staining: CTG wins by points in distinguishing living from dead anoxia-impacted copepods and nematodes, Biogeosciences, 10, 4565– 4575, doi:10.5194/bg-10-4565-2013, 2013.
Grego, M., Riedel, B., Stachowitsch, M., and De Troch, M.: Meio-fauna winners and losers of coastal hypoxia: case study harpacti-coid copepods, Biogeosciences, 11, 281–292, doi:10.5194/bg-11-281-2014, 2014.
Hagy, J. D., Boynton, W. R., Keefe, C. W., and Wood, K. V.: Hy-poxia in Chesapeake Bay, 1950–2001: Long-term change in re-lation to nutrient loading and river flow, Estuaries, 27, 634–658, 2004.
Hall, P. O. J., Anderson, L. G., van der Loeff, M. M. R., Sundby, B., and Westerlund, S. F. G.: Oxygen uptake kinetics in the benthic boundary layer, Limnol. Oceanogr., 34, 734–746, 1989. Harper, M. P., Davison, W., and Tych, W.: Temporal, Spatial, and
Resolution Constraints for in Situ Sampling Devices Using Dif-fusional Equilibration:00Dialysis and DET, Environ. Sci. Tech-nol., 31, 3110–3119, 1997.
Hines, M. E., Faganeli, J., and Planinc, R.: Sedimentary anaerobic microbial biogeochemistry in the Gulf of Trieste, northern Adri-atic Sea: Influences of bottom water oxygen depletion, Biogeo-chemistry, 39, 65–86, 1997.
Jézéquel, D., Brayner, R., Metzger, E., Viollier, E., Prévot, F., and Fiévet, F.: Two-dimensional determination of dissolved iron and sulfur species in marine sediment pore-waters by thin-film based imaging. Thau lagoon (France), Estuarine, Coast. Shelf Sci., 72, 420–431, 2007.
Jorissen, F. J.: Benthic foraminiferal microhabitats below the sediment-water interface, in Modern Foraminifera, Springer Netherlands, 161–179, available at: http://link.springer.com/ chapter/10.1007/0-306-48104-9_10 (last accessed: 21 October 2013), 2003.
Koron, N., Ogrinc, N., Metzger, E., Riedel, B., and Faganeli, J.: Diagenesis and benthic fluxes of nutrients and metals during experimentally induced anoxia in the Gulf of Trieste
(north-ern Adriatic Sea), Biogeosciences Discuss., 10, 11729–11755, doi:10.5194/bgd-10-11729-2013, 2013.
Krachler, M.: Environmental applications of single collector high resolution ICP-MS, J. Environ. Monit., 9, 790–804, 2007. Kristiansen, K. D., Kristensen, E., and Jensen, E. M. H.: The
Influ-ence of Water Column Hypoxia on the Behaviour of Manganese and Iron in Sandy Coastal Marine Sediment, Estuarine, Coast. Shelf Sci., 55, 645–654, 2002.
Langlet, D., Baal, C., Geslin, E., Metzger, E., Zuschin, M., Riedel, B., Risgaard-Petersen, N., Stachowitsch, M., and Jorissen, F. J.: Foraminiferal species responses to in situ experimentally in-duced anoxia in the Adriatic Sea, Biogeosciences, 10, 7463– 7480, doi:10.5194/bg-10-7463-2013, 2013.
Langlet, D., Geslin, E., Baal, C., Metzger, E., Lejzerowicz, F., Riedel, B., Zuschin, M., Pawlowski, J., Stachowitsch, M., and Jorissen, F. J.: Foraminiferal survival after long term ex-perimentally induced anoxia, Biogeosciences, 11, 1775–1797, doi:10.5194/bg-11-1775-2014, 2014.
Lanoux, A., Etcheber, H., Schmidt, S., Sottolichio, A., Chabaud, G., Richard, M., and Abril, G.: Factors contributing to hypoxia in a highly turbid, macrotidal estuary (the Gironde, France), Environ. Sci. Proc. Impacts, 15, p. 585, 2013.
Mahar, M., Tyson, J. F., Neubauer, K., and Grosser, Z.: High throughput sample introduction system for the analysis of drink-ing waters and wastewaters by ICP-MS, J. Anal. At. Spectrom., 23, 1204–1213, 2008.
Malej, A.: Gelatinous aggregates in the northern Adriatic Sea, Bul-letin de l’Institut océanographique, 149–157, 1995.
Meire, L., Soetaert, K. E. R., and Meysman, F. J. R.: Impact of global change on coastal oxygen dynamics and risk of hypoxia, Biogeosciences, 10, 2633–2653, doi:10.5194/bg-10-2633-2013, 2013.
Mesnage, V., Ogier, S., Bally, G., Disnar, J.-R., Lottier, N., Dedieu, K., Rabouille, C., and Copard, Y.: Nutrient dynamics at the sediment–water interface in a Mediterranean lagoon (Thau, France): Influence of biodeposition by shellfish farming activi-ties, Mar. Environ. Res., 63, 257–277, 2007.
Metzger, E., Simonucci, C., Viollier, E., Sarazin, G., Prévot, F., Elbaz-Poulichet, F., Seidel, J.-L., and Jézéquel, D.: Influence of diagenetic processes in Thau lagoon on cadmium behavior and benthic fluxes, Estuarine, Coast. Shelf Sci., 72, 497–510, 2007. Metzger, E., Viollier, E., Simonucci, C., Prévost, F., Langlet, D., and
Jézéquel, D.: Millimeter-scale alkalinity measurement in marine sediment using DET probes and colorimetric determination, Wa-ter Res., 47, 5575–5583, 2013.
Middelburg, J. J. and Levin, L. A.: Coastal hypoxia and sediment biogeochemistry, Biogeosciences, 6, 1273–1293, doi:10.5194/bg-6-1273-2009, 2009.
Minghelli-Roman, A., Laugier, T., Polidori, L., Mathieu, S., Lou-bersac, L., and Gouton, P.: Satellite survey of seasonal trophic status and occasional anoxic “malaïgue” crises in the Thau la-goon using MERIS images, Int. J. Remote Sens., 32, 909–923, 2011.
Moodley, L., Heip, C. H. R., and Middelburg, J. J.: Benthic activity in sediments of the northwestern Adriatic Sea: sediment oxygen consumption, macro- and meiofauna dynamics, J. Sea Res., 40, 263–280, 1998.
2224 E. Metzger et al.: Artificially induced migration of redox layers
Ogorelec, B., Mišiˇc, M., and Faganeli, J.: Marine geology of the Gulf of Trieste (northern Adriatic): Sedimentological aspects, Mar. Geol., 99, 79–92, 1991.
Ogrinc, N., Fontolan, G., Faganeli, J., and Covelli, S.: Carbon and nitrogen isotope compositions of organic matter in coastal ma-rine sediments (the Gulf of Trieste, N Adriatic Sea): indicators of sources and preservation, Mar. Chem., 95, 163–181, 2005. Poulain, P.-M. and Hariri, S.: Transit and residence times in
the surface Adriatic Sea as derived from drifter data and La-grangian numerical simulations, Ocean Sci. Discuss., 10, 197– 217, doi:10.5194/osd-10-197-2013, 2013.
Rabalais, N. N.: Eutrophication of estuarine and coastal ecosystems, in Environmental Microbiology, John Wiley & Sons., 115–134, 2010.
Rabalais, N. N., Turner, R. E., and Jr., W. J. W.: Gulf of Mexico Hypoxia, a.k.a. “The Dead Zone,” Ann. Rev. Ecol. System., 33, 235–263, 2002.
Revsbech, N. P.: An oxygen microsensor with a guard cathode, Lim-nol. Oceanogr., 34, 474–478, 1989.
Riedel, B., Zuschin, M., Haselmair, A., and Stachowitsch, M.: Oxy-gen depletion under glass: Behavioural responses of benthic macrofauna to induced anoxia in the Northern Adriatic, J. Ex-perim. Mar. Biol. Ecol., 367, 17–27, 2008.
Riedel, B., Zuschin, M., and Stachowitsch, M.: Tolerance of ben-thic macrofauna to hypoxia and anoxia in shallow coastal seas: a realistic scenario, Mar. Ecol. Prog. Ser., 458, 39–52, 2012. Riedel, B., Pados, T., Pretterebner, K., Schiemer, L., Steckbauer,
A., Haselmair, A., Zuschin, M., and Stachowitsch, M.: Effect of hypoxia and anoxia on invertebrate behaviour: ecological per-spectives from species to community level, Biogeosciences, 11, 1491–1518, doi:10.5194/bg-11-1491-2014, 2014.
Sarazin, G., Michard, G., and Prevot, F.: A rapid and accurate spec-troscopic method for alkalinity measurements in sea water sam-ples, Water Res., 33, 290–294, 1999.
Schönfeld, J.: Benthic Foraminifera and Pore-Water Oxygen Pro-files: A Re-Assessment of Species Boundary Conditions at the Western Iberian Margin, J. Foramin. Res., 31, 86–107, 2001.
Sell, K. S. and Morse, J. W.: Dissolved Fe2+ andPH2S Behavior
in Sediments Seasonally Overlain by Hypoxic-to-anoxic Waters as Determined by CSV Microelectrodes, Aquat. Geochem., 12, 179–198, 2006.
Skoog, A. C. and Arias-Esquivel, V. A.: The effect of induced anoxia and reoxygenation on benthic fluxes of organic carbon, phosphate, iron, and manganese, Sci. Total Environ., 407, 6085– 6092, 2009.
Souchu, P., Gasc, A., Collos, Y., Vaquer, A., Tournier, H., Bibent, B., and Deslous-Paoli, J.: Biogeochemical aspects of bottom anoxia in a Mediterranean lagoon (Thau, France), Mar. Ecol. Prog. Ser., 164, 135–146, 1998.
Stachowitsch, M.: Mass Mortality in the Gulf of Trieste: The Course of Community Destruction, Mar. Ecol., 5, 243–264, 1984. Stachowitsch, M.: Anoxia in the Northern Adriatic Sea: rapid death,
slow recovery, Geological Society, London, Special Publications, 58, 119–129, 1991.
Stachowitsch, M., Riedel, B., Zuschin, M., and Machan, R.: Oxy-gen depletion and benthic mortalities: the first in situ experimen-tal approach to documenting an elusive phenomenon, Limnol. Oceanogr., 5, 344–352, 2007.
Sundby, B., Anderson, L. G., Hall, P. O. J., Iverfeldt, Å., van der Loeff, M. M. R., and Westerlund, S. F. G.: The effect of oxygen on release and uptake of cobalt, manganese, iron and phosphate at the sediment-water interface, Geochimica et Cosmochimica Acta, 50, 1281–1288, 1986.
Sundby, B., Martinez, P., and Gobeil, C.: Comparative geochem-istry of cadmium, rhenium, uranium, and molybdenum in con-tinental margin sediments, Geochimica et Cosmochimica Acta, 68, 2485–2493, 2004.
Viollier, E., Rabouille, C., Apitz, S. ., Breuer, E., Chaillou, G., Dedieu, K., Furukawa, Y., Grenz, C., Hall, P., Janssen, F., Mor-ford, J. ., Poggiale, J.-C., Roberts, S., Shimmield, T., Taillefert, M., Tengberg, A., Wenzhöfer, F., and Witte, U.: Benthic biogeo-chemistry: state of the art technologies and guidelines for the future of in situ survey, J. Experimen. Mar. Biol. Ecol., 285/286, 5–31, 2003.