Development and Application of Management Tools within a High-Mix,
Low-Volume Lean Aerospace Manufacturing Environment
By
Kevin McKenney
S.B. Mechanical Engineering, Massachusetts Institute of Technology (2000) Submitted to the Department of Mechanical Engineering and the Sloan School of
Management in Partial Fulfillment of the Requirements for the Degrees of Master of Science in Mechanical Engineering and
Master of Business Administration MASSACHUSETTS INST E OF TECHNOLOGY
In Conjunction with the Leaders for Manufacturing Program at the
J
Massachusetts Institute of TechnologyJune 2005 LIBRARIES
@2005 Massachusetts Institute of Technology. All rights reserved.
Signature of Author
Department of Mechanical EngiiYeering Sloan School of Management May 6, 2005 Certified by
DavidHardt, Thesis Supervisor Professor of Mechanical Engineering
Certified by
Stephen Graves, Thesis Supervisor Abraham Siegel Professor of Management
Accepted by
David CapodiJatpoxeciti Director of Mastof's Prowgram Slan School of Management
Accepted by____
LallBRa rnt Mehancal um ttee BARKER Department of Mechanical Engineering
Development and Application of Management Tools within a High-Mix, Low-Volume Lean Aerospace Manufacturing Environment
By
Kevin McKenney
Submitted to the Department of Mechanical Engineering and the Sloan School of Management on May 6, 2005 in partial fulfillment of the Requirements for the Degrees of Master of Science in Mechanical Engineering and Master of Business Administration
Abstract
The design and implementation of a lean production system is a complex task requiring an intimate understanding of the fundamental lean principles. Much of the published lean literature is written at a high level of abstraction and contains very basic examples. When lean tools are applied blindly to complex, highly constrained systems, lean
implementation becomes challenging and often ineffective. This thesis develops a set of management tools that emphasize the fundamental lean principles and the importance of an overarching value stream level management perspective in an effort to drive
appropriate system design decisions and management behavior in such an environment. This thesis proposes the design of a high-mix, low-volume (HMLV) lean production system for implementation at Hamilton Sundstrand, a global supplier of technologically advanced aerospace and industrial products. The system establishes a series of mixed model flow lines based upon the principles of cellular manufacturing. The flow lines operate in a true pull fashion with an optimally sized finished goods supermarket and a
strategic, continuous review incoming material ordering policy. In addition, a capacity planning tool, a long term resource cross-training planning tool, and a series of leading metrics and management levers are developed in order to help steer management decisions.
Thesis Supervisor: David Hardt
Title: Professor of Mechanical Engineering Thesis Supervisor: Stephen Graves
Acknowledgements
I would first like to thank the Leaders for Manufacturing program for its support of this
work. The LFM faculty and my classmates have, both intellectually and socially, made the past two years of my life incredibly enjoyable and fulfilling.
I would like to give a special thanks to my thesis advisors: Stephen Graves and David
Hardt for helping me to establish credibility and for mentoring me through many of the challenges I faced throughout my internship.
In addition, I would like to thank Hamilton Sundstrand for sponsoring this work. In particular, I would like to acknowledge the following individuals for their contributions:
John Boyd, Mark Wellard, and Eric Rohrbacher for their continued sponsorship of the LFM program.
Jorge Laires for welcoming me into his organization, allowing me the opportunity to contribute, and emphasizing the importance of a functionally integrated
leadership mentality.
Joe Shiver for treating me as a peer and encouraging me to participate as a member of the management team.
Tony Grasso and all of the assembly and test technicians for treating me like one of the guys and helping me to understand and appreciate their work.
The rest of the MES team who taught me along the way: Lance Bartosz, Dave Bedson, Larry Brodsky, Bob Collins, Ricky Dunne, Tim Gaudet, Bob Gleason, Russ Hubley, Mike Kuhns, Skip Murray, and Armand Mercier.
I would also like to give a special thanks to the Operations Transformation Team that I
toiled with day in and day out. Michael Butt, William Schnepp, and Robert Jennett accepted me as part of their team and continually encouraged me to challenge the status quo and try out new ideas. Much of my success I credit to them. It's been fun.
Finally, I would like to thank Kate for braving a long distance relationship while I fulfilled my internship obligation and gained invaluable career experience. We now begin the next chapter in our lives together.
Hamilton
Sundstrand
"""""
""
Table of Contents
Abstract ... 3
Acknow ledgem ents ... 5
Table of Contents ... 7 List of Figures ... 9 List of Tables...10 Chapter 1. Introduction... 11 1.1 H am ilton Sundstrand... 11 1.2 Setting: M ES Introduction ... 14
1.3 Product Line: JFC/GTA A ssem bly and Test... 15
1.4 Approach ... 16
1.5 Literature Review ... 17
1.6 O verview of Chapters and Appendices... 19
Chapter 2. Challenges at H am ilton Sundstrand ... 20
2.1 Low -V olum e, H igh-M ix ... 20
2.2 Slow Product Life Cycle ... 20
2.3 Resource A llocation Constraints... 21
2.4 Scheduling ... 21
2.5 Part Shortages... 22
2.6 Poor Test Y ields ... 23
2.7 Organizational Resistance in a Mature Aerospace Company ... 25
2.7.1 Strategic D esign Lens... 25
2.7.2 Political Lens... 26
2.7.3 Cultural Lens ... 29
Chapter 3. Manufacturing System Design and Analysis ... 31
3.1 G oals and M etrics... 31
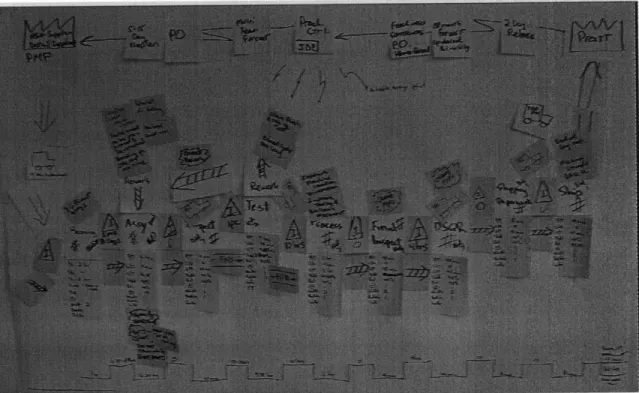
3.2 V alue Stream M apping...31
3.3 Product 80/20 Analysis ... 35
3.4 Product Fam ily M atrix ... 36
3.5 Takt Tim e Calculations ... 39
3.6 Actual W ork Contents ... 40
3.7 Process Flow Redesign ... 42
3.8 Capacity Planning and Resource A llocation... 43
3.9 Cross-Training... 50
3.10 Flow Line Configuration... 56
3.11 Continuous Im provem ent... 58
Chapter 4. Incom ing M aterials Strategy ... 59
4.1 Inventory Review Frequency ... 61
4.2 Econom ic Order Q uantity ... 61
4.3 Reorder Point ... 62
4.4 Expected Inventory Level ... 63
4.5 Service Level... 64
4.6 D istribution by V alue ... 65
4.7.1 M odel A djustm ents ... 68 4.7.2 Objective Function ... 68 4.7.3 D ecision V ariables ... 68 4.7.4 Constraint Equations ... 69 4.8 D ata M anipulation... 70 4.9 M odel Setup ... 72
4.10 Future State Solution... 73
4.11 Sensitivity A nalysis... 75
4.12 Im plem entation ... 77
4.13 M etrics to D rive Im provem ents ... 80
4.14 Bin Stock Policies ... 82
4.15 Supplier K itting ... 85
Chapter 5. Pull Production With Finished Goods Supermarket ... 86
5.1 M odel D evelopm ent... 86
5.2 D ata M anipulation... 88
5.3 Future State Solution... 88
5.4 Sensitivity Analysis... 89
5.5 M etrics to D rive Im provem ents ... 90
Chapter 6. Results and Recom m endations ... 92
6.1 Lean Principles... 92
6.2 Analysis to Q uantify Constraints ... 93
6.3 M etrics Drive Behavior... 93
6.4 Leadership and Organizational Change ... 94
6.5 System s Perspective ... 97
6.6 Conclusions ... 97
Appendix A . Acronym Glossary ... 98
Appendix B . EO Q D erivation... 99
Appendix C . Inventory Control Policy V isualization...101
Appendix D. Service Level Constraint Equation Validation...103
List of Figures
Figure 1. Hamilton Sundstrand Business Unit Organizational Chart. ... 13
Figure 2. Hamilton Sundstrand Engine & Control Systems Product Line...14
Figure 3. Picture of Two Fully Processed Jet Fuel Controls...16
Figure 4. MES One Month Test Yield Chart...24
Figure 5. Current Stakeholder Map for MES...27
Figure 6. MES Current State Value Stream Map...32
Figure 7. MES Current State Process Flow Diagram...33
Figure 8. Current State Lead Time Ladder. ... 34
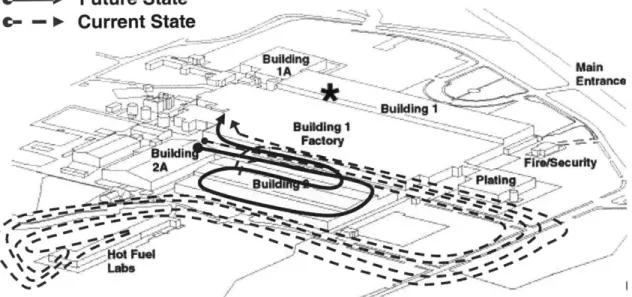
Figure 9. Spaghetti Diagram Comparing Current and Future States. ... 35
Figure 10. MES 80/20 Product Load Analysis. ... 36
Figure 11. MES Product Family Matrix...38
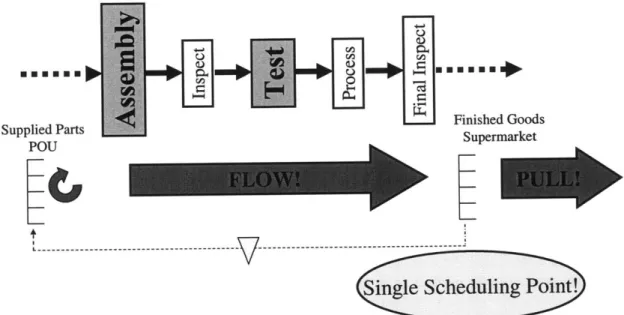
Figure 12. MES Future State Process Flow Diagram. ... 42
Figure 13. Overall Monthly Resources Required for MES Assembly and Test...47
Figure 14. MES 2005 Monthly Direct Labor Plan...48
Figure 15. Shop Experience Retention Plan...50
Figure 16. Marginal Benefit of Additional Cross-Training. ... 53
Figure 17. Part Shortage System Dynamics...60
Figure 18. Graphical Representation of
Q
R Ordering Policy. ... 62Figure 19. Distribution by SKU Value. ... 66
Figure 20. DBV with Overdue Scatter...67
Figure 21. Non-conforming Material Flow Diagram and Probability Tree...71
Figure 22. D BV with NCM Scatter...72
Figure 23. Efficient Frontier Between Inventory and Parts Availability...74
Figure 24. Optimized Distribution by Value Comparison...75
Figure 25. $E[I] Sensitivity to Normalized Model Variables...76
Figure 26. Future State Transition Inventory Dynamics...78
Figure 27. Assembly Cell Stockout Probability...79
Figure 28. Supplied Parts On-Time Delivery Histogram... 82
Figure 29. Kanban Replenishment Material Flow. ... 83
Figure 30. Finished Stores Replenishment Cycle. ... 84
Figure 31. Finished Goods Inventory DBV. ... 87
Figure 32. Finished Goods Efficient Frontier. ... 89
Figure 33. Normalized Variable Sensitivity Analysis...90
Figure 34. Proposed Stakeholder Map...96
Figure 35. Graphical Representation of EOQ...100
Figure 36. Reorder Policy Control Plot for 5 Day Replenishment. ... 101
Figure 37. Reorder Policy Control Plot for 10 Day Replenishment. ... 102
List of Tables
Table 1. UTC Segm ent Review ... 13
Table 2. Product Group #3 Assembly Work Content Analysis. ... 40
Table 3. Net Available Shop Hours Per Month Calculation for 2005. ... 43
Table 4. Monthly Actual Takt Time... 43
Table 5. Group #3 Yearly Capacity Planning with Excel Grid... 44
Table 6. Monthly Resources Equation Variables... 46
Table 7. Group #3 Yearly Capacity Planning with Overtime Balancing...47
Table 8. Qualitative Comparison of POU and Kitting...57
Table 9. Reorder Point V ariables ... 63
Table 10. Inventory M odel Setup... 72
Table 11. Inventory Optimization Results for One Flow Line. ... 75
Table 12. Theoretical Relationship Between o- and $E[I]...77
Table 13. Leading Metrics Summary for Operations Transformation...94
Table 14. Sam ple EOQ Calculation...100
Table 15. Visual Control Policy Table for Replenishments of 5, 10, and 15 days...101
Table 16. Comparison Between Visual Control Policy and SIP Model Output...102
Chapter 1.
Introduction
Practicing continuous improvement within a given manufacturing framework is necessary to drive out waste, to maintain flexibility as markets shift, and in general to sustain operational efficiency. However, there comes a point where a radical step change is needed to shake a manufacturing cell, a company, an industry, or even a nation from its current manufacturing mentality and to help facilitate the evolution towards a more globally optimal manufacturing system. Lean manufacturing has been such a step change. Over the past 60 years, lean implementation has shifted the manufacturing culture across many industries to allow companies and even countries to achieve new levels of manufacturing efficiency, far beyond what they currently believed possible. In 2003, the leaders of United Technologies Corporation (UTC) gathered in an offsite conference to kick off a new corporate initiative, Operations Transformation. The initiative was not limited solely to manufacturing, but instead spanned across all corporate functions and divisions. Operations Transformation was identified as a top priority in order for UTC to retain its status as a world class manufacturer and to maintain competitiveness in an ever-changing, post 9/11 world economy.
Over the past several years, Operations Transformation has swept across the company one manufacturing cell at a time. In June 2004, the spotlight fell upon the jet fuel control assembly and test facility at Hamilton Sundstrand's Engine and Control Systems
Division. Hamilton Sundstrand is a subsidiary of UTC. This internship and thesis work will present the management tools developed to help the division along its path towards Operations Transformation. These management tools will emphasize the fundamental principles supporting a lean production system and help enable successful
implementation in a complex manufacturing environment.
The design of a high-mix, low-volume (HMLV) lean production system is proposed in this thesis. The system establishes a series of mixed model flow lines based upon the principles of cellular manufacturing. The flow lines operate in a true pull fashion with an optimally sized finished goods supermarket and a strategic, continuous review incoming material ordering policy. In addition, a capacity planning tool, a long term resource cross-training planning tool, and a series of leading metrics and management levers are developed in order to help steer management goals and decisions.
1.1 Hamilton Sundstrand
United Technologies Corporation, UTC, (NYSE: UTX) is a "global provider of high technology products and services to the building systems and aerospace industries."' In its 2003 10-K, UTC is classified into 5 principle segments:
* Otis (the world's largest elevator and escalator manufacturing, installation and
service company),
* Carrier (the world's largest manufacturer and distributor of commercial and
residential HVAC systems and refrigeration equipment),
* Chubb (a global provider of security and fire protection products and services), * Pratt & Whitney (a world leading supplier of commercial, general aviation, and
military aircraft engines), and
* Flight Systems consisting of
o Hamilton Sundstrand (provider of aerospace and industrial products and aftermarket services for diversified industries worldwide) and
o Sikorsky (one of the world's largest manufacturers of military and commercial helicopters that also provides aftermarket helicopter and aircraft products and services).
In addition, UTC operates a Research Center that works with the business to develop new technologies and processes as well as UTC Power, which is leading efforts to meet customers' needs for distributed generation and is a leader in the production of fuel cells for commercial, space, and transportation applications.
In 2003, UTC had operating revenues of $31 billion and employed more than 205,000 employees worldwide. It is the 51't largest US corporation (1 4 1st in world) and operates
in more than 180 countries. UTC has been named by Fortune Magazine as the "most admired" aerospace company in 2001, 2002, 2003, and 2004.2
Hamilton Sundstrand, a subsidiary of UTC, is among the largest global suppliers of technologically advanced aerospace and industrial products. The company designs and manufactures aerospace systems for commercial, regional, corporate, and military aircraft, and is a major supplier for international space programs.3 Most recently, Hamilton Sundstrand was selected to supply eight major systems for the Boeing 7E7 Dreamliner. The systems' total value is estimated at up to $6 billion over the life of the
7E7 Program.4
Hamilton Sundstrand has an impressive history with roots dating back to the Sundstrand Corp (1905) and Hamilton Standard (1919). On June 10, 1999, UTC acquired
Sundstrand Corporation and merged it with its Hamilton Standard Division. The world headquarters is located at the Windsor Locks, Connecticut plant which opened in 1952. In 2003, Hamilton Sundstrand had annual sales of $3.4 billion and employed 16,700 people worldwide. Table 1 shows UTC's revenue and profit data broken out by business segment.
2 http://www.utc.com/profile/facts/index.htm
3 http://www.hamiltonsundstrandcorp.com/hsc/details/0,3797,CLILDIV22_ET3023,00.html
Table 1. UTC Segment Review.
Segment Review
Revenues O ratin Profits 0 eratin Profit Mar in
in millions of dollars the Hamil21 Sda b ineuit o n 2001 n 2001
Otis e$8h was focu$ e47 in to 6p338 13 4%
Carrier 59098. 90 6.6%
Chubb
-Pratt & Whitney 765 7,679 122 1,3O8 1&% 17.0%
Flight Systems 5,292 741 6701 33 12.7%
Figure 1 shows the Hamilton Sundstrand business unit organizational chart. This
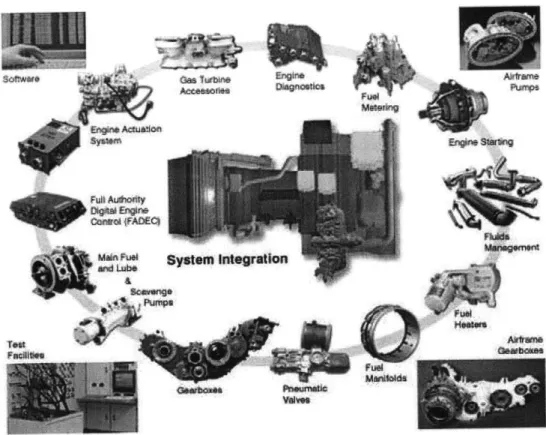
internship was focused in the Mechanical Engine Systems Division (MEfS) of the Engine Systems business unit. Engine Systems provides engine controls, starters, gearboxes, fuel pumps, lubrication systems, and scavenge pumps to jet engine manufacturers. The product categories across the Engine & Control Systems division are shown in Figure 2. Hamilton Sundstrand had traditionally supplied engine externals on a component level while the customer (Pratt & Whitney) was responsible for the systems integration and assembly. On January 1st, 1991, Pratt & Whitney decided to push the systems integration
responsibility up the supply chain to Hamilton Sundstrand so that Hamilton Sundstrand would be able to expand the customer base and sell directly to Pratt & Whitney's competitors (i.e. Rolls Royce, General Electric) without a major conflict of interest. Because Pratt & Whitney and Hamilton Sundstrand were both subsidiaries of UTC, this shift in responsibility could be accomplished without any substantial loss in power or control. The Engine & Control Systems group has since occupied a building on the Windsor Locks campus and acts as a procurement intermediary and systems integrator between its customers (jet engine manufacturers) and over 100 suppliers, including Hamilton Sundstrand.
Aerospace Industrial Space.
Engine & Control Systems rspace Poer yem [light Systes & Servies
Engine Systems Dynamic Controls HS HS Marston
Figure 2. Hamilton Sundstrand Engine & Control Systems Product Line.
5
1.2
Setting: MES Introduction
The Mechanical Engine Systems (MES) Division at Hamilton Sundstrand assembles and tests Jet Fuel Controls (JFCs), Gas Turbine Accessories (GTAs), and Starters. MES employs nearly 50 assembly and test technicians and accounts for roughly $40M in revenue per year.
In 2003, senior management at UTC gathered for an offsite conference to kick off what has been known as "Operations Transformation." The goal was to initiate a major three facetted overhaul of all UTC operations: to modify the infrastructure, to rationalize the manufacturing scope, and to improve the operations execution.6
Rationalizing the manufacturing scope using a core / non-core criteria has caused
Hamilton Sundstrand to shift its make-buy momentum from nearly 60% make in 2000 to a goal of 40% make by 2008. This resulted in a significant reduction in direct labor hours, which in turn has caused an increase in the overhead percentage spread across the remaining manufacturing facilities. This, of course, is coupled with an increasing cost of benefits, which only accelerates the overhead absorption problem. In order to
5 http://www.hamiltonsundstrandcorp.comhsc/details/o,,CLI1_DIV22_ET3028,00.html
6 Operations Transformation video with excerpts from Operations Transformation Conference, held
counterbalance the effects of the increasing overhead rate, Hamilton Sundstrand has undergone and will continue to undergo significant footprint reductions.
In order to boost productivity, Hamilton Sundstrand has begun to adopt lean principles and value stream mapping (VSM) as a means to develop more efficient operations. The efforts have cut across the value stream including supply management, manufacturing effectiveness, and demand management. There is a plan for a reduction in the number of suppliers to foster more intimate (lean) relationships with those that remain. There are also efforts to establish more of a design for manufacture and assembly culture within the engineering organization and an overall effort towards digitization.
There had recently been a push for MES to embrace Operations Transformation;
however, the lean culture shift was still in its infancy. Prior to the author's internship, a VSM event had been held and a trial product flow line had been set up. Unfortunately, because of the clear priority on production throughput and the lack of enthusiasm on the shop floor, the trial flow line had neither been fully implemented nor given the
opportunity to succeed.
Fortunately, in late July, 2004, the funding was approved to move the MES assembly facility to another building to be collocated with test in April, 2005. The purpose of this move was to both reduce the travel distance between operations as well as to reduce the overall factory footprint. Arguably, from an Operations Transformation perspective, the most significant direct impact of the move was to create a sense of urgency both with management and technicians that change was imminent. The idea was to lump the changes (and pains) associated with the move together with the changes (and pains) associated with implementing lean. Management especially wanted the old culture and the old way of doing things to be left behind after the move. The move date served as a line in the sand to establish priority for Operations Transformation and motivation to change. An Operations Transformation team of four dedicated resources, including the author, was established to lead the effort.
1.3
Product Line: JFC/GTA Assembly and Test
Jet fuel controls (JFCs) are complex hydro-mechanical systems that meter fuel flow to jet engines. Although many are now integrated with digital feedback control systems, JFCs are calibrated such that they also have the ability to act as hydraulic computers (even with the electronics turned off) to meet the following general engine control requirements:
- Maintain safety of engine for all power lever movements and changing inlet conditions;
- Limit engine rotation speed and turbine inlet temperature; - Avoid compressor surge or stall;
- Avoid rich blowout and lean blowout;
- Provide thrust proportional to the thrust lever angle.7
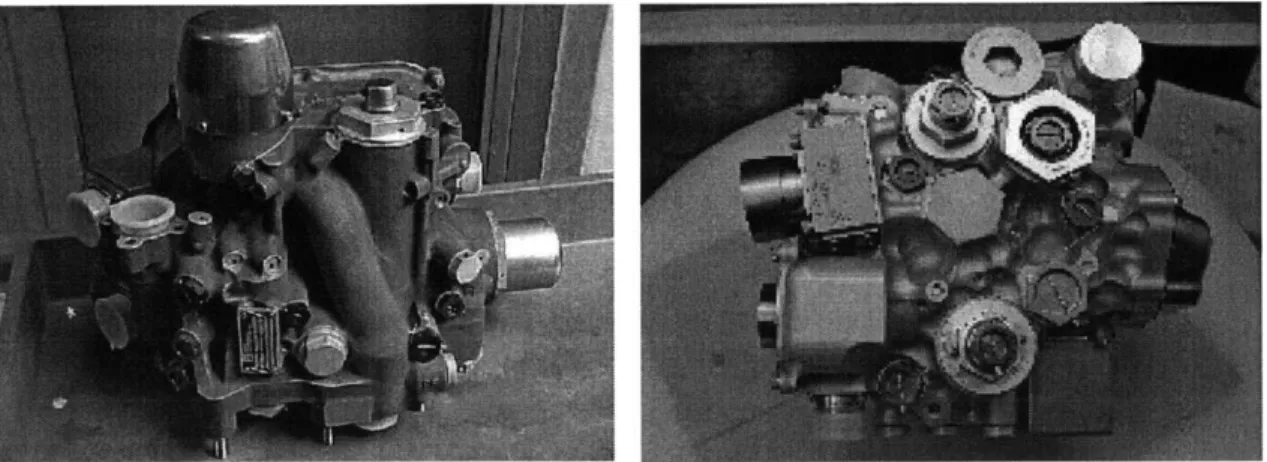
Like all aerospace systems, performance and weight are critical design parameters. As a result, JFCs are very difficult to manufacture and require senior technicians and support staff. In addition, JFCs have extremely tight manufacturing specifications that translate into high variability and often low test yields. Two completed JFC models are shown in Figure 3. In addition to JFCs, MES also manufactures starters, which provide the power for initial engine start-up, and GTAs, ranging in function from fuel distribution to oil cooling.
Figure 3. Picture of Two Fully Processed Jet Fuel Controls.
MES is a low-volume, high-mix production environment with a significant amount of
processing time variation and rework. Most work takes place at either an assembly bench or at a test rig and capacity is primarily labor resource constrained. In addition to being very skilled, technicians are required to be certified for each model they build.
Certification is very costly and time consuming and, as a result, there is limited
technician cross-training. The lack of cross-training limits the flexibility to accommodate surge capacity and technician absence. This is further complicated by the fact that it is a union environment with a high resistance to change.
1.4
Approach
Many of the challenges that MES faces are not unique. However, there is rarely a cookie cutter solution that will allow a flawless lean implementation and address all the
intricacies of a business. The internship began with an in-depth analysis of the business. Several topic areas were identified early on as key challenges including vision
communication, supplier management, strategic inventory placement, manufacturing systems design and analysis, and quality control.
The most important step in enabling change was the introduction of a value stream management view of the system. This value stream perspective utilizes the value stream mapping tool, which will be discussed in Section 3.2, to enable a cross-functional team to understand the process at a detailed level. Given this information, value stream mapping also provides a framework for stepping back and looking at the entire process as a whole. In doing this, the team will have a concrete understanding as to how improvements in
individual areas impact the entire system. This allows the team to focus resources on areas with the most significant potential impact or greatest "bang for buck" and ensures the implementation of global improvements. This thesis attempts to leverage this value stream perspective by addressing issues at both a systems level as well as at a detailed implementation level.
1.5 Literature Review
In describing the process for designing and implementing a lean production system, this thesis covers a vast array of topics including lean manufacturing, value stream mapping, strategic inventory placement, and more. This section will provide the reader with a brief review of relevant literature including text books and prior Leaders for Manufacturing (LFM) theses. A full list of references can be found in the Bibliography at the end of this thesis.
There has been much literature published on lean manufacturing in the last two decades. Some of the most well known works include The Machine that Changed the World, The Design of the Factory with a Future,9 A Study of the Toyota Production System,10 and Lean Thinking." Each of these books discusses the Toyota Production System and the emphasis on banishing waste. The Machine that Changed the World is a groundbreaking analysis performed by the MIT International Motor Vehicle Program of the worldwide move from mass production to lean production. The Design of the Factory with a Future outlines a 10 step strategy towards an "integrated manufacturing production system" methodology that is analogous to the Toyota Production System and is founded on two basic concepts: elimination of waste and respect for people. A Study of the Toyota Production System details the Toyota Production System from an industrial engineering viewpoint. Lean Thinking defines the five principles of lean as: 1) specify value, 2) identify the value stream, 3) make value flow, 4) let customers pull, and 5) pursue perfection. These lean books are complemented by works including The Goal, which introduces the "theory of constraints" and The Fifth Discipline,13 which introduces the
concept of the "learning organization."
Value stream mapping is a key to the bridging the gap between lean theory and lean implementation. This thesis heavily references Learning to See,14 Training to See,15 and
Creating Mixed Model Value Streams.16 Learning to See and Training to See teach value
8 Womack, James P., and Daniel T. Jones, and Daniel Roos, The Machine that Changed the World, New York: Harper Perennial, 1991.
9 Black, J T., The Design of the Factory with a Future, New York: McGraw-Hill, 1991.
1 Shingo, Shigeo, A Study of the Toyota Production System, Portland: Productivity Press, 1989. " Womack, James P., and Daniel T. Jones, Lean Thinking, New York: Free Press, 2003.
12 Goldratt, Eliyahu M., The Goal: A Process of Ongoing Improvement. Great Barrington: The North River Press, 1992.
13 Senge, Peter, The Fifth Discipline: The Art and Practice of the Learning Organization. New York: Currency Doubleday, 1990.
14
Rother, Mike, and John Shook, Learning to See, Brookline: The Lean Enterprise Institute, 2003.
15 Rother, Mike, and John Shook, Training to See, Brookline: The Lean Enterprise Institute, 2000. 16 Duggan, Kevin J., Creating Mixed Model Value Streams, New York: Productivity Press, 2002.
stream mapping at the facility level to show where to introduce flow and pull while removing waste. Creating Mixed Model Value Streams translates theoretical lean into practical guidance moving beyond basic value stream mapping to selecting product
families, scheduling, and handling customer demand.
There have been many LFM theses written on lean implementation over the years.
Within this set, a high percentage specifically address the challenge of implementing lean in a high-mix, low-volume environment. One reason for this high percentage is that implementing lean in a high-mix, low-volume environment (or more generally, a highly constrained environment) is difficult. Therefore, companies typically reach out and ask for assistance with these implementations whether it be in the form of an LFM internship or other consulting exposure.
Nonetheless, the challenge is surmountable as evidenced by the LFM theses exploring applications in various industries. Matthew Gates'7 and Jonathan Rheaumel8 have
demonstrated success in high-mix, low-volume environments at Hamilton Sundstrand. Matt explored Operations Transformation in aircraft air-conditioning system rotor manufacturing while Jon analyzed Operations Transformation in heat exchanger core assembly. Both manufacturing cells fall within the Air Management Systems Division at Hamilton Sundstrand.
Vida Killian19 explored the impact on manufacturing that Intel faced as it expanded into the telecommunications space. The integrated circuits required in the communications industry were high-mix, low-volume products relative to the memory and
microprocessors making up the historical semiconductor product mix. Matthew Joing researched the impact of Lean and an alternative manufacturing methodology called Quick Response Manufacturing on high-mix, low-volume circuit card assembly at Raytheon. As a final example, Ankur Goel21 discussed the impact of low volume on the development and manufacturing of organic light-emitting diodes at Kodak.
A significant portion of this thesis is dedicated to the integration of strategic inventory
22
placement into a lean production system. Supply Chain Management is a
comprehensive textbook that covers strategy, planning, and operation. It not only covers high-level supply chain strategy and concepts, but also gives the reader a solid
understanding of the analytical tools necessary to solve supply chain problems. Chapter
17 Gates, Matthew D., "Lean Manufacturing System Design and Value Stream Management in a High-Mix, Low-Volume Environment," Masters Thesis, MIT Leaders for Manufacturing Program, June 2004. 1 Rheaume, Jonathan M., "High-Mix, Low-Volume Lean Manufacturing Implementation and Lot Size Optimization at an Aerospace OEM," Masters Thesis, MIT Leaders for Manufacturing Program, June 2003.
19 Killian, Vida, "The Impact of High-Mix, Low-Volume Products in Semiconductor Manufacturing," Masters Thesis, MIT Leaders for Manufacturing Program, June 2003.
2 0
Joing, Matthew, "Application of Lean Manufacturing and Quick Response Manufacturing in a High-Mix Low-Volume Environment," Masters Thesis, MIT Leaders for Manufacturing Program, June 2004. 21 Goel, Ankur, "Chemical Development and Lot Size Optimization for Low-Volume, High Value OLED Chemicals," Masters Thesis, MIT Leaders for Manufacturing Program, 2003.
8 discusses how to manage uncertainty in a supply chain utilizing safety stock. Many of
the equations used in the inventory optimization models of this thesis are developed in more detail in this chapter.
Many LFM theses have also been written on the topics of strategic inventory placement and material ordering policy. Daniel Wheeler2 3 and Garret Caterino24 both address issues
pertaining to the integration of inventory modeling and supply chain management within a high-mix, low-volume environment at Instron.
1.6 Overview of Chapters and Appendices
This thesis began with an introduction to Hamilton Sundstrand and the Mechanical Engine Systems Division, discussing the manufacturing setting and the Operations Transformation initiatives championed by executive leadership. Chapter 2 will discuss the major challenges MES faces with its current production process in order to both justify the need for change and identify the targeted areas for improvement. Chapter 3 details the manufacturing system analysis and redesign utilizing many standard lean design concepts as well as some developed specifically to accommodate the highly-constrained environment at MES. Chapter 4 and Chapter 5 develop an incoming material
and a finished goods supermarket replenishment strategy based on continuous review optimization models. Finally, Chapter 6 presents the results and key learnings. Appendix A provides the reader with an acronym glossary. Appendix B presents an
EOQ derivation. Appendix C elaborates on the proposed inventory control policy from a
visualization standpoint. Appendix D presents a simulation that validates the service level constraint equation. Lastly, the Bibliography provides a summary of the sources cited throughout this thesis.
23 Wheeler, Daniel H., "Pulling a Job Shop into Supply Chain Management," Masters Thesis, MIT Leaders
for Manufacturing Program, June 2000. 2 4
Caterino, Garret J., "Implementation of Lean Manufacturing in a Low-Volume Production Environment," Masters Thesis, MIT Leaders for Manufacturing Program, June 2001.
Chapter 2.
Challenges at Hamilton Sundstrand
This section describes some of the challenges that the MES division of Hamilton
Sundstrand faced while designing and implementing a lean production system. Many of these challenges, however, are not unique to MES. The management tools developed in this thesis can easily be transferred to other companies and industries with similar business characteristics. This chapter will discuss these current state challenges at a relatively high level of abstraction. A detailed analysis of the current state will be presented in Chapter 3.
2.1
Low-Volume, High-Mix
One challenge faced by the MES Division at Hamilton Sundstrand is that its production is high-mix and low-volume (HMLV). There are over 60 products manufactured in MES with an average annual demand of only 40 units per product. The maximum annual demand for any product is just over 300 units per year. The products are characterized by long, variable processing times ranging from 1 to 90 hours per unit at both assembly and test and often require a significant amount of rework. In addition, there is little to no modularity or part commonality between products.
Although an HMLV manufacturing environment causes lean implementation to be more complex and difficult, it can still be justified. In fact, Hamilton Sundstrand is not unique in this regard. HMLV lean production systems are prevalent across aerospace companies and extend into many other industries.
The most famous example of HMLV is the transition of the auto industry over the last half century. Henry Ford is often credited with saying that customers could buy a Model T in "any colour, so long as it's black." The Toyota Production System proved that greater manufacturing efficiencies could be attained even with lower volumes and higher product mix. Additionally, within the LFM community there are many examples of successful HMLV lean production systems. Some of these were discussed in the Literature Review in Section 1.5.
2.2
Slow Product Life Cycle
Another prevalent challenge to lean implementation in the aerospace industry is a result of the slow product lifecycles. It is important to note here that Operations
Transformation permeates the entire organization. It is not targeted solely at
manufacturing. Engineering is also a crucial component of Operations Transformation because much of the product cost and manufacturability is determined in the design phase of the product lifecycle. Engineering and design determines such characteristics as modularity, design robustness, and quality.
Although it is relatively easy to transform the manufacturing portion of the business to adopt lean, a company cannot always go back and redesign the product because of the cost of such an undertaking. Because of the long product life cycle, many of the legacy products were designed ten or more years ago in a very different market where there was
far less focus on cost and products were not expected to meet today's stringent quality standards. Instead, the design focus was on performance, and incentives were geared towards designing the next new gadget.
As a result, the manufacturing operation has been given the task of implementing lean and creating flow with a set of products that do not always lend themselves to flow. In particular, the main inhibitors are the lack of modularity and part commonality between products. In addition, the stringent performance requirements combined with poor product design robustness result in low test yields, cause variability in the manufacturing process, and generally disrupt the manufacturing product flow.
2.3
Resource Allocation Constraints
As previously mentioned, JFCs are complicated assemblies that require experienced technicians and support staff to produce. The average technician age is 48 with an average experience of 22 years at UTC. Because of the seniority regulations of the union, layoffs tend to affect the younger technicians. In other words, the last to be hired are the first to be let go - a last-in, first-out (LIFO) system. This results in a gradual increase in the average employee age specifically within MES and more generally throughout Hamilton Sundstrand. The effect of the aging work force is further amplified
by the general consolidation efforts of Hamilton Sundstrand operations.
Because cross-training is so time consuming and costly, management tends to train the older, more experienced technicians because they are less likely to be affected by layoffs. Consequently, the core knowledge is contained with the older employees who may be nearing retirement.
In addition to the aging workforce dilemma, the lack of sufficient cross-training seriously limits the flexibility of the existing work force. Often times, if a technician is absent, the production of a certain product may halt because there is no one else available who is certified to build or test that particular product.
Because of this constraint, shop floor supervisors are forced to micromanage both the production schedule and resource allocation. At the same time, technician utilization is considered a vital metric. When time is lost, it cannot be recovered by applying more resources. In many cases, there may not be any certified technicians available. The end result is a constant reshuffling of resources and production priorities, which leads to suboptimal and inefficient operation.
2.4
Scheduling
Currently, production is scheduled using an Materials Resource Planning (MRP) system. Parts are ordered to arrive prior to the production start date, which is based upon the MRP demand forecast. The demand data, projected out six months, is generally firm, but component lead times can be far greater. As a result of part shortages, many builds do not start on time, causing the factory to operate in an expediting mode.
Once started, the production is scheduled by the shop floor supervisor at every step of the process based on the urgency of that particular unit. This requires a significant
management effort. In addition, because orders are pushed through the system, there is an excessive amount of inventory in queue and inflated manufacturing order cycle times. In order to improve the actual customer on-time delivery metric, further material and time buffers are built into the system. Still, the customer on-time delivery metric is below the Hamilton Sundstrand target.
A final note regarding scheduling is that overtime is not reserved as an additional buffer.
Instead, it is planned into the daily work schedule and yearly capacity planning. It is not uncommon for overtime to exceed 30% of standard work time. At the same time, technicians have begun to expect overtime and have adjusted their lifestyles accordingly. It is suspected that technicians often slow down their output in periods of low demand to ensure overtime.
2.5
Part Shortages
Inventory is a crucial financial operating metric. On a fundamental level, inventory ties up capital that could be reinvested elsewhere in the business. Traditionally, inventory has been used to smooth out production and buffer against system variability in order to ensure product availability to the customer. Lean thinking, however, considers inventory
to be a double-edged sword. Not only does inventory tie up capital, but it also clogs up the production system and lengthens production lead time, thus reducing the ability to respond to the customer.
Hamilton Sundstrand has drastically reduced inventory over the years by passing down corporate goals through the ranks of the organization. Individual manufacturing cells are
given yearly inventory targets and are encouraged to lower the water level (reduce the inventory) in order to discover the rocks (problems) with the cell's performance. This water level analogy is developed by Black.25 Inventory, when used strategically, is a
management tool that can be used to buffer against the stochastic behavior of a system. However, if applied blindly, it can actually hide solvable problems, which may continue to crop up time and again. Reducing inventory forces the company to focus on fixing these problems, leading to further inventory reductions and more efficient operations. It is the author's belief that MES has reduced the inventory levels without accounting for the trade-offs between inventory costs and opportunities for component stockouts. In this extreme state, there are too many rocks exposed to adequately address on a continual improvement basis. As inventory is reduced, unnecessary stresses are placed on the system resulting in an increase in part shortages. In an effort to keep pace with the production schedule, technicians are forced to build short. Building short implies that the technician has skipped the operation that involved the missing part and moved on to the next step in the process, thus deviating from the standard work. Building short is
inherently inefficient and results in technicians racing simply to ship units. Therefore, lowering the water level too fast will undermine the potential benefits of lowering the water level in the first place. Historically, at Hamilton Sundstrand, when the water level drops too far too fast, a tsunami has been sure to follow. In other words, when
management gets frustrated with part shortages, they flood the shop floor with inventory to help ship units.
Part shortages are by far the biggest problem facing MES. When units get behind schedule, the root cause is most often directly or indirectly related to part shortages. In addition to the implications of shutting down a production line, part shortages also lead to serious morale issues with the technicians. Technicians come to work to build. Part
shortages slow them down and prevent them from developing a production rhythm. When they are constantly being stopped because a part needs to be tracked down, they get frustrated and discouraged. In addition, building short forces technicians to deviate from standard work and assemble components out of order. This causes a breakdown in the inspection checks and balances and can lead to quality problems. Finally, part
shortages lead to a lack of trust and respect for management who is ultimately responsible for maintaining parts availability.
Part shortages also lead to burnout within the procurement organization. With excessive part shortages, the procurement department finds itself chasing too many parts and cannot possibly keep up. It may make sense to buffer the cheaper parts so that procurement can focus their time and effort on the high value items that most significantly affect the inventory costs and that warrant management attention. Said another way, it does not make sense for procurement to spend hundreds of dollars in labor to track down a $1 part.
2.6
Poor Test Yields
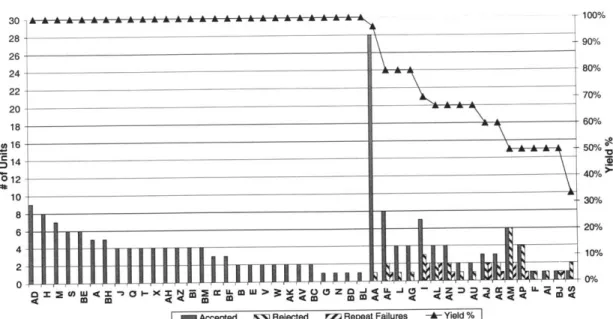
After part shortages, the greatest source of production system variability and impediment to flow is the poor test yield of MES products. Figure 4 shows a pareto chart comparing the first time test yield (FTTY) for a representative subset of JFC and GTA products for a given month. FTTY is the percentage of time that a given unit passes its certification test at the end of the manufacturing process in the first attempt. For each product listed along the x-axis, the bars represent the number of units tested as well as the number of units that failed test on the first or second attempt. The curve represents the FTTY metric for each product.
When a unit fails test, it enters a rework loop cycling between assembly and test until it finally passes. Typically, rework requires a technician to rebuild the unit by substituting out defective parts. For this reason, rework can often take as long if not longer than the original assembly time. Not only does this require the production system to
accommodate this rework loop, but it also creates significant uncertainty in the order cycle time and requires additional production system buffers.
30 28 26 24 22 20 18 u 16 14 012 10 8 6 4 2
MIES One Month Test Yield
_________________________________100% 900% 80% 70% 60% 50% 40% 300/ 20% 10%
no-OZW4Z)L1 <X-XZ >~OZ~JU coL0 M Accepted &N Rejected GZn Repeat Failures -A- Yield %
Figure 4. MES One Month Test Yield Chart.
As can be inferred from Figure 4, F1TY ranges anywhere from 30 to 100%. For some products not shown here, the FTY can be as low as 0%. The average FY for MES on a unit basis is around 85%. In other words, if 100 units were built with the current
product mix, 15 would be expected to fail test on their first pass. This metric is tracked by senior management. This metric, however, can be deceiving. Products with short order cycle times tend to also be the products with the highest test yields. This means that if the FTTY metric is weighted by the labor content required to build each product, the weighted FTTY is reduced to 66%. This means that 34% of the work performed by MES fails at test and enters a rework loop. It is also worth noting that this statistic is highly dependent on product mix. As product mix changes from year to year, it is important to understand the impact on FTTY.
Even more disconcerting is the fact that second time test yield is lower than FTTY. In other words, if a unit has already failed test, it is more likely to fail again after it is rebuilt than another unit that has yet to be tested. Because test failures are not well understood, a failed unit is torn down and components are replaced until it finally passes. Engineers are involved in the process; however, in many instances, failure modes are very similar for
different types of problems and difficult to diagnose in the first attempt.
Although a full diagnosis of test yields is beyond the scope of this thesis, it is important to understand the complications that arise when implementing a flow production system. Value stream mapping typically assumes a future state with perfect quality (FTTY =
A A
100%). If there are processes with less than perfect quality, the problems are highlighted
and kaizen26 events are initiated to solve the problems.
However, achieving perfect quality in the case of MES may in fact be a longer term problem. As previously discussed, JFCs are complex systems with extremely tight specifications. They were designed for performance, not necessarily manufacturability. There is much work yet to be done with statistical process control and designed
experiments to develop robust processes that might overcome the test yield
manufacturing constraints. The challenge is compounded by the fact that test rigs are large, capital intensive equipment with analog gauges and no system for automated data acquisition.
In a sense, rework is built into the manufacturing process. The question becomes: How do we proceed with lean in the near term while anticipating quality improvements in the future? The proposed solution, which will be discussed in subsequent sections, is to hold an appropriately sized finished goods supermarket. Nonetheless, it is important to note that the costs associated with poor test yields are not simply the cost of rebuilding the units, but also the costs of holding more inventory to buffer the system from variability.
2.7
Organizational Resistance in a Mature Aerospace
Company
It is far easier to implement a lean production system in a greenfield environment where there are not well established processes and norms. Hamilton Sundstrand is instead a mature aerospace company with rich roots, an advanced MRP system, and engrained tacit knowledge. There has been significant effort and investment in the current
manufacturing system, and historically, Hamilton Sundstrand has been quite successful. Organizational change in this environment can be quite difficult.
This section will evaluate these organizational challenges using three lenses: the strategic design lens, the political lens, and the cultural lens. "Each lens is a perspective on the organization that distills the essence of related theories that share ideas about human nature, the functions of organizations, the meaning of organizing, and the information needed to make sense of an organization."27 The section is by no means a complete and thorough analysis of the organization. The objective, instead, is to capture some of the key organizational factors impacting Operations Transformation such that they can be appropriately addressed.
2.7.1 Strategic Design Lens
"[The strategic design lens] views the organization as a kind of machine that has been designed to achieve goals by carrying out tasks. The designers of the organization, the 26 Kaizen means continuously improving in incremental steps. Duggan, supra, note 16, p180. A Kaizen
Event is a designated period of time set aside for a cross-functional team to focus on implementing incremental improvements in the production system.
27 Carroll, John S. "Introduction to Organization Analysis: The Three Lenses." MIT Sloan School of
Board of Directors and senior managers, have a strategy or purpose for the organization based on rational analysis of opportunities and capabilities."28
The aerospace industry has evolved significantly over the last 10 years moving away from a focus on performance and out designing the competition to more of a focus on product cost and total cost of product ownership and operation. This is one of the most compelling justifications for the executive embracement of Operations Transformation. However, there are organizational hurdles that Hamilton Sundstrand must overcome to fully embrace the new lean strategy. First of all, the organizational structure at Hamilton Sundstrand has many management layers. Although this is due in part to the sheer size of the company, it is the author's opinion that Hamilton Sundstrand is a hierarchical
organization. This attribute creates the potential for communication gaps both up and down the management chain.
A second attribute of the organizational structure is the functional nature of the resource
groupings. At the very top of the organization, executive management has a matrix like structure with some Vice Presidents responsible for product families or manufacturing facilities and other Vice Presidents responsible for a particular customer or group of customers. Below the director level, however, the organization is functionally siloed. This structure has enabled Hamilton Sundstrand to excel in the past, but may not be sufficient to enable effective Operations Transformation going forward.
Because of the functional organizational structure, employees at Hamilton Sundstrand have become quite proficient at optimizing on a local level. If a system is not
appropriately structured and incentives effectively aligned, this can lead towards a trend of sub-optimization. Additionally, if a problem arises that can not be directly addressed
by an individual functional group, the tendency is to point fingers and place blame
instead of tracking the issue across functional boundaries, working through the root cause analysis, and collaborating to develop a mutually beneficial solution.
Significant operational improvements can only be obtained by approaching problems with a systems perspective. For this reason, Operations Transformation requires an organizational structure that enables cross-functional coordination and supports paradigmatic change.
2.7.2 Political Lens
"People who use the political lens view the organization as a contested struggle for power among stakeholders with different goals and underlying interests. Whereas the strategic design lens groups and links units that must work together to accomplish tasks, the political lens combines units with similar interests and goals into coalitions that advocate their side of important issues."29
2 Ibid. 29
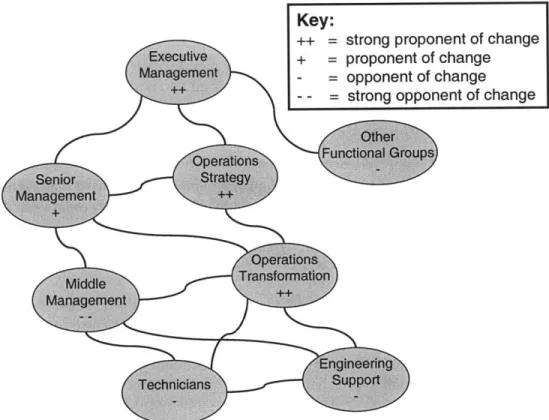
As with any change initiative of this magnitude that requires the coordination of multiple functional groups at many levels of the organization, there are an overwhelming number of stakeholders. Figure 5 is a stakeholder map for MES. To simplify matters and to help draw generalizations, certain groups have been lumped together. Connecting lines between groups represent effective communication links and the ability of each group to influence the other. It should be noted that even within one of the designated groupings there can often be many views. It should also be noted that these opinions are not
reflective of individuals within the organization. Instead, these political groupings should be interpreted as the byproduct of the organizational structure and incentive system. In other words, it is not enough to simply replace individuals to solve problems within the system. Anyone placed in a given group will face these same general political pressures. In fact, these political perspectives are not unique to Hamilton Sundstrand or to MES. Instead, they can be generalized for many different organizations. That being said, one
important quality of individual leaders within the organization is the ability to effectively navigate the political landscape and to break down these organizational barriers.
Key:
++ = strong proponent of change
Executive + = proponent of change
Management - opponent of change
++- - = strong opponent of change
Other Operations FunctionalGroups Senior Strategy Mg t anagement ++ OperationsOperations Middle Transformation Management ++ Engineering Technicians Support
Figure 5. Current Stakeholder Map for MES.
The first group of stakeholders is executive management who are strong advocates of Operations Transformation. This is the group that has defined Operations
Transformation as a part of the long term corporate strategy. They look beyond the near term implementation challenges and maintain a vision of achieving new levels of operational efficiency.
Senior management is the set of managers who are responsible for UTC business at a divisional level. This group understands the corporate initiative and how it might transform their respective business, but are more reluctant to commit time and resources because they are concerned about the potential short term negative impact. At the end of the day, they are responsible for production output and change is viewed as risky.
The middle managers, who are ultimately responsible for change implementation, are in a very tough political situation. On the one hand, they report to senior management who are driving Operations Transformation. On the other hand, these middle managers are responsible for the shop floor assembly and test technicians as well as the engineering and quality shop floor support functions who adamantly oppose change. Middle managers are left with the difficult task of balancing these conflicting interests and maintaining these relationships while at the same time implementing change and shipping product. Often, middle management can be the hardest group to persuade to change because maintaining the status quo is far less controversial. In the long run, Operations Transformation is very much aligned with the local objectives of middle management. The challenge is to overcome, in the short term, the uncertainty that is inherent in the change process.
The technicians and engineering support functions generally resist change because they have been working in the current state for many years and do not appreciate the economic justification for change. In addition, they equate "lean" with "layoffs" and
"outsourcing," feeling that there is nothing to gain from Operations Transformation and everything to lose.
The operations strategy group is a team of people appointed by executive management to facilitate Operations Transformation across the company. While they are proponents of change, they have loose connections with many of the other stakeholders on the map. It is important that they take the time to strengthen these relationships and to understand, appreciate, and influence systems changes.
There are many other functional groups who are stakeholders in Operations Transformation including procurement, engineering, and others. Because of the hierarchical and functional organizational structure, it is difficult to develop effective links between the operations stakeholders and other functional groups. Senior management has identified this as a challenge and begun to promote interdisciplinary meetings and collaboration.
Lastly, there is the Operations Transformation team that is focused on change at a very local level. Much of this thesis work was developed in conjunction with the efforts of this team. This group has direct ties with many of the stakeholders on the map, and it is very important to continue to develop these relationships. The Operations
Transformation team has two main responsibilities. The first is to spearhead the design of the new production system. The second, and perhaps more difficult responsibility, is to implement change. This requires the team to communicate with and coordinate between all of the other stakeholders.
2.7.3 Cultural Lens
"[The cultural lens] assumes that people take action as a function of the meanings they assign to situations. More broadly, the cultural elements, symbols, stories, and
experiences from which meanings are derived, are shared among members of a culture and transmitted to new members. Cultures develop over time as groups solve important problems and pass on their traditions."30
Hamilton Sundstrand (in most US locations) operates in a union environment with a very rigid labor-management relationship, which can often be an impediment to change. In order to manage successful change in a union environment, the union and its members must be included early on in the decision making process. Additionally, the Operations Transformation teams should practice interest based negotiation3' wherever possible to develop a strong relationship and to promote buy-in with all of the stakeholders. This negotiation method emphasizes four main points: "1) separate the people from the problem; 2) focus on interests, not positions; 3) invent options for mutual gain; and 4) insist on using objective criteria."32
An additional source of resistance is derived from past experiences at Hamilton
Sundstrand with lean implementation and general change management. Technicians tend to retain roles far longer than their supervisors. They have seen many management styles and operating philosophies come and go over the years. New change initiatives are deemed "management fads" and are temporary nuisances that will likely come to pass without benefit to them. As a result, technicians are willing to wait out management. If technicians resist for long enough, management will either give up or be transferred and production will revert back to the way it was.
There is a very interesting bargaining power dynamic between management and the technicians. Because of their high level of skill and experience, the technicians are often the only ones who really know the fuel controls. Management is mindful of this and very careful not to upset the technicians with policy changes. At the end of the day, if
technicians become frustrated and refuse to work, management is left with very few options. This phenomenon was articulated by one of the engineers as "the tail wagging the dog."33
Hamilton Sundstrand and UTC have had mixed results with Operations Transformation. There are some areas that have fully embraced lean and are rewarded with improved performance and employee morale. On the other hand, there are areas where technicians feel that "nothing was changed except that some furniture was moved around."34 As word travels fast, a failure in one area can result in further lean implementation resistance in another. The fundamental difference between examples of successful and unsuccessful
0 Ibid.
3' Fisher, Roger, William Ury, and Bruce Patton, Getting to Yes, New York: Penguin Books, 1991.
32 Ibid.
3 Quoting Robert Jennett, Manufacturing Engineer, Hamilton Sundstrand.
34 Quoting an anonymous technician at Hamilton Sundstrand. Although this is only the opinion of one technician, it is important to acknowledge that this perspective exists and should be addressed.
lean implementation is whether the Operations Transformation team in the particular area had a vested interest in change and adequate motivation to engage for the long haul. Unsuccessful teams did just enough work to establish a visual perception of change without challenging the process inefficiencies or truly embracing the lean production philosophy.
A final barrier to cultural change is that at Hamilton Sundstrand, lean is associated with
layoffs and outsourcing. During the author's internship, two areas undergoing Operations Transformation were outsourced. The first was the Precision Machining Facility (PMF) who supplied the precision machined valves for many of the MES products. PMF had participated in several value stream mapping and kaizen events to improve operational performance and standardize work. The work was then outsourced to another supplier. In addition, an entire Connecticut based electronics facility was shut down and sent to Hamilton Sundstrand facilities in lower cost geographies. This
electronics facility happened to be a non-union shop and had made significant
advancements in lean manufacturing. As a result, technicians in other areas feel that if they participate in Operations Transformation, they will be contributing to their own demise. Therefore, management must demonstrate that although no one can be promised
job security, embracing Operations Transformation and substantially improving
operational performance will improve the odds of work retention. In fact, resistance to change and acceptance of the status quo may only lead to accelerated outsourcing initiatives.
In summary, Operations Transformation in a mature company requires a significant investment of time and money to overturn the historical processes and norms. More importantly, it requires exceptional leadership to motivate teams and individuals to look beyond the comfort of their everyday roles and challenge them to see the broader picture. At the same time, leaders must maintain the ability to self-reflect and adapt themselves accordingly.