HAL Id: hal-00302961
https://hal.archives-ouvertes.fr/hal-00302961
Submitted on 11 Jul 2007HAL is a multi-disciplinary open access
archive for the deposit and dissemination of sci-entific research documents, whether they are pub-lished or not. The documents may come from teaching and research institutions in France or abroad, or from public or private research centers.
L’archive ouverte pluridisciplinaire HAL, est destinée au dépôt et à la diffusion de documents scientifiques de niveau recherche, publiés ou non, émanant des établissements d’enseignement et de recherche français ou étrangers, des laboratoires publics ou privés.
Air-to-sea flux of soluble iron: is it driven more by
HNO3 or SO2? ? an examination in the light of dust
aging
H. Yang, Y. Gao
To cite this version:
H. Yang, Y. Gao. Air-to-sea flux of soluble iron: is it driven more by HNO3 or SO2? ? an examination in the light of dust aging. Atmospheric Chemistry and Physics Discussions, European Geosciences Union, 2007, 7 (4), pp.10043-10063. �hal-00302961�
ACPD
7, 10043–10063, 2007Air-to-sea flux of soluble iron: driven
more by HNO3 or SO2?
H. Yang and Y. Gao
Title Page Abstract Introduction Conclusions References Tables Figures ◭ ◮ ◭ ◮ Back Close Full Screen / Esc
Printer-friendly Version Interactive Discussion Atmos. Chem. Phys. Discuss., 7, 10043–10063, 2007
www.atmos-chem-phys-discuss.net/7/10043/2007/ © Author(s) 2007. This work is licensed
under a Creative Commons License.
Atmospheric Chemistry and Physics Discussions
Air-to-sea flux of soluble iron: is it driven
more by HNO
3
or SO
2
? – an examination
in the light of dust aging
H. Yang and Y. Gao
Department of Earth and Environmental Sciences, Rutgers University, Newark, New Jersey 07102, USA
Received: 15 June 2007 – Accepted: 4 July 2007 – Published: 11 July 2007 Correspondence to: Y. Gao (yuangaoh@andromeda.rutgers.edu)
ACPD
7, 10043–10063, 2007Air-to-sea flux of soluble iron: driven
more by HNO3 or SO2?
H. Yang and Y. Gao
Title Page Abstract Introduction Conclusions References Tables Figures ◭ ◮ ◭ ◮ Back Close Full Screen / Esc
Printer-friendly Version Interactive Discussion
Abstract
Aeolian dust provides the major micronutrient of soluble Fe to organisms in certain regions of the global ocean. In this study, we conduct numerical experiments using the MOZART-2 atmospheric chemistry transport model to simulate the global distribution of soluble Fe flux and Fe solubility. One of the mechanisms behind the hypothesis of 5
acid mobilization of Fe in the atmosphere is that the coating of acidic gases changes dust from hydrophobic to hydrophilic, a prerequisite of Fe mobilization. We therefore include HNO3, SO2 and sulfate (SO2−4 ) as dust transformation agents in the model.
General agreement in Fe solubility within a factor of 2 is achieved between model and observations. The total flux of soluble Fe to the world ocean is estimated to be 731– 10
924×109g yr−1, and the average Fe solubility is 6.4–8.0%. Wet deposition contributes
over 80% to total soluble Fe flux to most of the world oceans. Special attention is paid to the relative role of HNO3 versus SO2and sulfate. We demonstrate that coating by
HNO3 produces over 36% of soluble Fe fluxes compared to that by SO2 and sulfate combined in every major oceanic basin. Given present trends in the emissions of NOx
15
and SO2, the relative contribution of HNO3 to Fe mobilization may get even larger in
the future.
1 Introduction
Iron (Fe) limits primary productivity in oceanic regions characterized by high-nitrate and low-chlorophyll (HNLC) (Martin, et al., 1994; Coale et al., 2004). Fe may also affect 20
many oceanic biological processes, including nitrogen fixation (Falkowski, 1997). The major source of Fe in the open ocean is soil dust transported from the atmosphere (Duce et al., 1991; Fung et al., 2000), although other processes, such as upwelling of deep water, also contribute (Coale et al., 1996; Meskhidze et al., 2007). Because only soluble Fe is readily available to phytoplankton, it is critically important to know 25
the solubility of aeolian Fe, which acts as a connection between desert dust and ocean 10044
ACPD
7, 10043–10063, 2007Air-to-sea flux of soluble iron: driven
more by HNO3 or SO2?
H. Yang and Y. Gao
Title Page Abstract Introduction Conclusions References Tables Figures ◭ ◮ ◭ ◮ Back Close Full Screen / Esc
Printer-friendly Version Interactive Discussion biogeochemistry (Gao et al., 2003; Jickells et al., 2005).
Meskhidze et al. (2003, 2005) simulated Fe solubility by assuming that dust aerosols deliquesced in the first place. Fan et al. (2006) proposed a two-step mechanism, which assumes that Fe dissolution (the second step) is initiated only after a certain amount of water-soluble acids coated on dust (the first step). The acid coating increases the 5
water-absorbing capacity of dust, since fresh dust absorbs too little water vapor to form solutions on the dust surface (Goodman et al. 2000; Vlasenko et al. 2006). The Fe dissolution rate is prescribed when the coating is controlled by HNO3 and SO2in Fan
et al. (2006). Considering that future air quality control will have different impacts on NOx (the precursor of HNO3) and SO2 emissions (IPCC 2001, A2p), it is important 10
to examine the relative contribution of HNO3 and SO2 to Fe solubility through dust aging. Consequently it becomes critical to know the most important parameters to measure and to include in the model. Sulfate (SO2−4 ) is formed by conversion of SO2,
and it has a higher concentration than SO2over the ocean and over continental areas away from the SO2source regions. We therefore include coagulation of sulfate in dust
15
transformation as well, and compare its effect together with the SO2coating to that by
HNO3coating.
This study aims to quantify the relative importance of HNO3and SO2(including
sul-fate) to soluble Fe fluxes to the ocean through numerical model simulations. Section 2 describes the heterogeneous uptake of HNO3and SO2on dust, the coagulation of sul-20
fate with dust, and the parameterization of Fe dissolution rates. Section 3 presents the simulated Fe solubility plus its comparison with in situ observations. The relative con-tribution by HNO3 is calculated, and sensitivity tests are performed at the lower limits of γHNO3 and γSO2. Discussions are presented with respect to relevant observations
and other modeling studies concerning Fe solubility, followed by Sect. 4, a summary of 25
the major conclusions.
ACPD
7, 10043–10063, 2007Air-to-sea flux of soluble iron: driven
more by HNO3 or SO2?
H. Yang and Y. Gao
Title Page Abstract Introduction Conclusions References Tables Figures ◭ ◮ ◭ ◮ Back Close Full Screen / Esc
Printer-friendly Version Interactive Discussion
2 Method
We use the MOZART-2 atmospheric transport model to simulate the Fe solubility. The meteorology fields are provided by NCEP reanalysis (Kalnay et al., 1996), with 28 ver-tical layers and a horizontal resolution as 1.9◦
×1.9◦. The chemistry module (Horowitz et al., 2003; Tie et al., 2005) simulates 90 species, including SO2, NOx, HNO3, sulfate
5
and dust aerosols. In addition, dust in each of the 5 size bins is classified into three categories: fresh, coated, and “dissolved” as in Fan et al. (2006). Higher wet removal rates are prescribed for coated and “dissolved” dust than for fresh dust due to the hy-drophilic characteristics after dust transformation (Fan et al., 2004). The transformation of dust from fresh to coated is controlled by heterogeneous uptake of gases (HNO3and 10
SO2) and the coagulation of sulfate on dust, and the transformation of dust from coated to “dissolved” is controlled by the dissolution rate of Fe. The model was run for the year of 2001.
The uptake coefficient (γ) is a critical parameter controlling the gas transfer rate. There is a large uncertainty in γ since it is very sensitive to aerosol surface properties 15
(JPL Publication 02-25). Table 1 lists the values of γ used in this study. The Base case has the median values of γ where γHNO
3 is ∼10 times of γSO2. The Ref case has the
lower limits of γ where γHNO3 and γSO2 have the same magnitudes. We do not include
the case with the upper limits of γ where γHNO3 is ∼100 times of γSO2 since HNO3
already makes a larger contribution than SO2 to Fe mobilization in the Base case as 20
our results later indicate, and the gas concentrations of HNO3 and SO2 are reduced
too heavily to be realistic in current MOZART settings.
The dust aging or transformation (κc , s−1) from fresh to coated is by gas
condensa-tion (Eq. 1) and by sulfate coagulacondensa-tion (Eq. 2):
κg = P j KdjCj δm (1) 25
where Kdj (m3 s−1) is the diffusion coefficient of gas j that is a function of γ; C
j is
ACPD
7, 10043–10063, 2007Air-to-sea flux of soluble iron: driven
more by HNO3 or SO2?
H. Yang and Y. Gao
Title Page Abstract Introduction Conclusions References Tables Figures ◭ ◮ ◭ ◮ Back Close Full Screen / Esc
Printer-friendly Version Interactive Discussion the concentration of gas j (kg m−3), and δm (kg) is the required coating mass for dust
transformation with a thickness assumed to be 1 nm (Fan et al., 2006).
κSO4 = K12N1
δN1
(2)
where the coagulation coefficient K12is a function of both sulfate and dust particle sizes
(Seinfeld and Pandis, 1998). N1 and N2represent the particle number concentration
5
of sulfate and dust, respectively. The required mass of coagulated sulfate (∼ δN1) is
assumed to be the same as the acidic coating by gases. The mass median diameter of sulfate aerosol is set at 0.31 µm and the geometric standard deviation at 2.03 (the grand continental average in Whitby, 1978). The transformation time τc(s) is the inverse
of κc=κg+ κSO
4.
10
Hematite (α-Fe2O3) is a major Fe oxide in soil (Cornell and Schwertmann, 2003),
which is highly insoluble under alkaline conditions, and dissolves slowly in acid solution in the presence of light and ligands, compared to other forms of Fe oxides (Martin, 2005). The hematite dissolution rate is used for the calculation of Fe solubility in this study. The transformation rate κs (s−1) of dust from coated to “dissolved” is the same
15
as the dissolution rate of hematite or Fe:
κs = RdAWFe2O3 (3)
where Rd is the hematite dissolution rate in mole per unit surface area, A is the specific
hematite surface area, and WFe
2O3 is the formula weight of hematite (159 g mol
−1). R
d
is set as 4×10⁻¹¹mol m−2s−1 and A is 100 m2g−1, following Fan et al. (2006). One
20
needs to scale the “dissolved” dust by 3.5% (Duce et al., 1991) to obtain the dissolved Fe. It is assumed in the model that 0.5% dust is coated and the same amount is “dissolved” when dust is emitted, which implies the lower limit Fe solubility as 0.5% in dust source regions.
The value of Rd of 4×10⁻¹¹mol m−2s−1was used to match the lower limit of γ in the
25
Ref case as by Fan et al. (2006), which has a slower dust transformation than the Base 10047
ACPD
7, 10043–10063, 2007Air-to-sea flux of soluble iron: driven
more by HNO3 or SO2?
H. Yang and Y. Gao
Title Page Abstract Introduction Conclusions References Tables Figures ◭ ◮ ◭ ◮ Back Close Full Screen / Esc
Printer-friendly Version Interactive Discussion case. For faster dust transformation produced by larger γ as in the Base case, Rd as
4×10⁻¹¹mol m−2s−1 produces a far larger Fe solubility compared to observations. R
d
as 4×10⁻¹¹mol m−2 s−1 produces a high bias in Fe solubility in the Ref case as well,
due probably to the online SO2 and HNO3 that generate a faster dust transformation in this study than in Fan et al. (2006), where monthly mean SO2 and HNO3 are used.
5
Since Fe dissolution occurs in a solution, it is assumed in this study that Fe dissolves only when the ambient relative humidity (RH) is above a threshold RHsh. RHsh is 76% for the Base case and 45% for the Ref case, which are determined by trial and error to match the observations.
To have a quantitative understanding of the contribution by HNO3to soluble Fe flux, 10
we ran three experiments for each case listed in Table 1. Experiment 1 has HNO3, SO2,
and sulfate as the dust transformation agents, experiment 2 has HNO3 as the coating
gas, and experiment 3 has SO2 and sulfate as the dust transformation agents. The model is constrained in experiment 1. Since dust aging and the Fe dissolution process are nonlinear, the addition of soluble Fe flux produced in experiments 2 and 3 is always 15
larger than that in experiment 1, especially in locations far away from dust source regions or if the dust transformation is very fast. We therefore check the ratio of soluble Fe flux between experiment 2 and 3 (F23), which explains the relative importance of
HNO3compared to SO2and sulfate.
3 Results and discussion
20
3.1 Model validation and the global distribution of soluble Fe flux
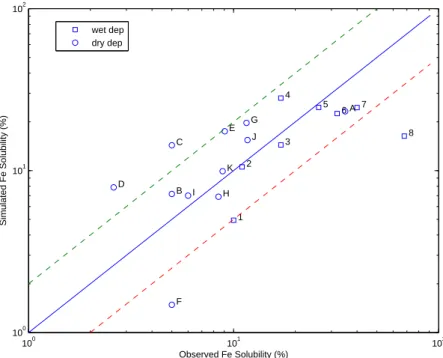
We focus on the Base case first. Figure 1 shows that the simulated Fe solubility (with contributions from both gases and sulfate) has an overall good agreement with obser-vations collected from 1988 to 2002, with 15 points scattered within a factor of 2 of the observed values and 4 points close to the 50% distance lines. The model generally 25
captures the variation feature of the Fe solubility, which ranges from ∼2% close to dust 10048
ACPD
7, 10043–10063, 2007Air-to-sea flux of soluble iron: driven
more by HNO3 or SO2?
H. Yang and Y. Gao
Title Page Abstract Introduction Conclusions References Tables Figures ◭ ◮ ◭ ◮ Back Close Full Screen / Esc
Printer-friendly Version Interactive Discussion source regions to ∼35% in remote areas as validated recently for bulk dust simulation
(Yang et al., 20071).
Figure 2 depicts the global distribution of (a) soluble Fe flux and (b) Fe solubil-ity over the ocean. The soluble Fe flux is the highest in the north Tropical Atlantic (>100 µmol m−2yr−1) where the Fe solubility is low (∼5%), due to its proximity to the
5
largest dust source region in North Africa. The same pattern is seen in the North Indian Ocean. The Tropical Pacific receives little soluble Fe flux (∼20 µmol m−2yr−1) but has a
high solubility (∼25%), being far away from any major dust sources. North Pacific has a medium soluble Fe flux (∼50 µmol m−2yr−1
) and solubility (∼16%), due to its modest distance from the dust source region in Asia and the dense air pollution in East Asia. 10
The ocean in the southern hemisphere (SH) generally has a lower soluble Fe flux and solubility than the northern hemisphere (NH) due to weaker dust source strength and generally lower HNO3and SO2and sulfate concentrations. Table 2 gives the soluble Fe
flux and Fe solubility in each major oceanic basin and the three major HNLC regions. The total air-to-sea soluble Fe flux is 731×109g yr−1, and the average Fe solubility over
15
the ocean is 6.4%.
Wet deposition contributes >80% to soluble Fe flux over most of the world ocean (Gao et al., 2003; Fan et al., 2006), implying Fe mobilization generally undergoes precipitation processes besides being cycled through clouds (Junge, 1964). The Fe solubility is 3.1% and 7.9% in dry and wet deposition over the ocean in the NH (not 20
including the Arctic), and it is 2.1% and 8.2% respectively in the SH. The smaller Fe solubility in dry deposition is mainly caused by the large amount of dry deposition near dust source regions, while most wet deposition occurs in remote areas where dust has stayed a much longer time in the atmosphere for a larger fraction of Fe to be mobilized (Yang et al., 20071). The slower wet removal rate of fresh dust is another reason for the 25
high Fe solubility in wet deposition (see Sect. 2). The smaller difference in Fe solubility between dry and wet deposition in the NH is probably due to the lower fraction of fresh
1
Yang, H., Gao, Y., and Horowitz, L.: The size distribution of entrained dust and the impact on dust load and deposition to the ocean, J. Geophys. Res., submitted, 2007.
ACPD
7, 10043–10063, 2007Air-to-sea flux of soluble iron: driven
more by HNO3 or SO2?
H. Yang and Y. Gao
Title Page Abstract Introduction Conclusions References Tables Figures ◭ ◮ ◭ ◮ Back Close Full Screen / Esc
Printer-friendly Version Interactive Discussion dust, which is <5% over most of the ocean, caused by the higher air pollution level and
the subsequent faster dust transformation from fresh to coated. On the contrary, the fraction of fresh dust is between 10% and 80% in the SH, which makes the Fe solubility in dry deposition lower than in wet deposition.
3.2 The sensitivity to uptake coefficients of acid gases 5
Table 2 shows large differences in soluble Fe flux and solubility to the world ocean between the two cases where different uptake coefficients of acid gases are prescribed, and different RHsh is adjusted accordingly. The soluble Fe flux in the Ref case is ∼1.5
times that of the Base case in the North Atlantic and the North Indian Ocean. It is ∼20% higher than the Base case in the North Pacific. Obviously, the increased effect 10
of a smaller RHsh in the Ref case outweighs the decreased effect of a slower dust
transformation rate, which is caused by the dry climate and high air pollution level in the NH. The contrast is milder in the major oceanic basins in the SH, where the difference factor is generally within 10%, and it is reversed in the South Indian Ocean and the South Pacific. The comparison of Fe solubility between the two cases exhibits 15
a similar pattern. The soluble Fe flux and Fe solubility over the Southern Ocean in the Base case is about twice that in the Ref case, which is caused by the slower dust transformation in the Ref case. As RH is generally higher than 80% in this region, the difference in RHshbetween the two cases does not produce a difference. The total
air-to-sea soluble Fe flux is 924×109g yr−1, and the average Fe solubility over the ocean
20
is 8.0%.
The contribution by dry deposition to soluble Fe flux over most oceans is <20%, similar to the Base case. However, the difference in Fe solubility between dry and wet deposition is larger in the Ref case. It is 3.4% and 11% for dry and wet depositions respectively over the ocean in the NH, and is 1.6% and 8.1% in the SH. The main 25
reason is probably the higher fraction of fresh dust than in the Base case, which is between 60–80% in the NH and over 80% in the SH, caused by the lower limits uptake coefficients of acid gases, and fresh dust has a lower wet removal rate than the aged
ACPD
7, 10043–10063, 2007Air-to-sea flux of soluble iron: driven
more by HNO3 or SO2?
H. Yang and Y. Gao
Title Page Abstract Introduction Conclusions References Tables Figures ◭ ◮ ◭ ◮ Back Close Full Screen / Esc
Printer-friendly Version Interactive Discussion dust (see Sect. 2). The comparison of simulated Fe solubility and bulk dust in the
Ref case has an overall good agreement with limited observations as well. Due to the sparse observations constraining the model, we propose to further explore this issue in the near future with more available data from more widely distributed in situ measurements of Fe solubility.
5
We compare our results with the Fe budget in the upper ocean proposed by Fung et al. (2000). By using the global primary productivity of 43.5 Pg yr−1
(Behren-feld and Falkowski, 1997), and assuming a cellular Fe:C in phytoplankton ranging from 2.5–6.5 µmol mol−1 in the open ocean and 25 µmol mol−1 for the coastal
re-gion, Fung et al. (2000) estimated that the global Fe assimilation by phytoplankton 10
in the ocean is 26×109mol Fe yr−1 and the aeolian soluble Fe flux was estimated
to be 11.8×10⁹mol Fe yr−1 (10% Fe solubility). The soluble Fe flux to the world
ocean predicted in the Base case is 13.1×10⁹mol Fe yr−1
(731×109g yr−1), and it is
16.6x10⁹mol Fe yr−1 (924×109g yr−1) in the Ref case. The estimated soluble Fe flux
is 15.8×10⁹mol Fe yr−1
in Luo et al. (2005), and it is 41.2×10⁹mol Fe yr−1 in Fan et
15
al. (2006). Therefore our results are close to the lower end of the range in the litera-ture.
3.3 Soluble Fe flux produced by HNO3versus that by SO2and sulfate
The global distribution of the annual mean ratio of soluble Fe flux produced by HNO3
versus that by SO2 and sulfate (F23) in the Base case is presented in Fig. 3. F23 is
20
higher than 1.0 over most world oceans, suggesting that HNO3makes a larger contri-bution to soluble Fe fluxes than SO2and sulfate. More specifically, in the NH, F23is the
highest over the North Atlantic (1.76), followed by the North Indian Ocean (1.66) and the North Pacific (1.36). F23 is similar among different oceanic basins in the SH. The factors affecting F23 in a certain area are the dust transformation rate by HNO3versus
25
by SO2 and sulfate, and the distance to its major dust source region. As our focus is
on the first aspect, we hereby examine the relative magnitude of the conversion rates by HNO3versus by SO2and sulfate to interpret the distribution of F23.
ACPD
7, 10043–10063, 2007Air-to-sea flux of soluble iron: driven
more by HNO3 or SO2?
H. Yang and Y. Gao
Title Page Abstract Introduction Conclusions References Tables Figures ◭ ◮ ◭ ◮ Back Close Full Screen / Esc
Printer-friendly Version Interactive Discussion Calculations from this study show that at the surface level, HNO3 generally has a
higher conversion rate than SO2 in major dust source regions in the NH, where over
90% dust is transformed from fresh to aged in the Base case. The transformation takes ∼33 h by HNO3 in the North Africa and the Arabian Peninsula, and ∼26 h in the
Central and East Asia. It takes ∼887 and ∼176 h by SO2respectively in these regions.
5
The concentration of HNO3varies from ∼0.1 to 1 ppb and ranges from ∼10% to 200%
of SO2in these regions. HNO3 has a lower conversion rate than SO2in Europe, east China and east U.S., where the RH is much higher than in the dust source regions, with the concentration of SO2above 5 ppb and HNO3less than 10% of that. However, the
fraction of fresh dust is less than 5% of total dust in these regions. The conversion rate 10
by HNO3 is higher than that by SO2 almost everywhere in the free troposphere since the concentration of SO2decreases faster with height than HNO3. The conversion by
sulfate takes ∼624 h in the North Africa and the Arabian Peninsula, and ∼455 h in the Central and East Asia. It turns out that the dust transformation by HNO3is higher than that by SO2and sulfate together.
15
Similar arguments can be applied to the SH; however, at the surface level over the ocean the fraction of fresh dust ranges from ∼10% to 80% of the total dust instead of ∼5% in the NH, as the transformation is slower due to the lower concentration of HNO3
than in the NH. Therefore, F23 in the South Indian Ocean (1.49) and South Atlantic
(1.40) is lower than in the North Indian Ocean (1.66) and the North Atlantic (1.76). 20
F23 in the Ref case is generally higher than in the Base case. This is because the
overall dust transformation is much slower in the Ref case than in the Base case and therefore the single contributions are more “linear” and “addable” here (see Sect. 2). For example, at the surface level in the dust source region in North Africa, the average transformation rate in the Base case is ∼10 times faster than in the Ref case.
25
The dust transformation rate in the Ref case is comparable to Fan et al. (2006), e.g. ∼1 day for 2 ppb SO2+ 1 ppb HNO3, based on similar prescription of gas uptake
coefficients. The gas removal rate on dust is on the order of 10−5s−1 in dust source
regions in the Base case, comparable to Dentener et al. (1996) that had a gas removal 10052
ACPD
7, 10043–10063, 2007Air-to-sea flux of soluble iron: driven
more by HNO3 or SO2?
H. Yang and Y. Gao
Title Page Abstract Introduction Conclusions References Tables Figures ◭ ◮ ◭ ◮ Back Close Full Screen / Esc
Printer-friendly Version Interactive Discussion rate as 10−3s−1 with a prescribed γ of 0.1. Finally, the reduction of HNO
3 through
heterogeneous uptake on dust ranges from 10% to 30% in high dust loading regions at the surface level, and it is generally <5% in remote areas in the Base case, which compares well with the special case in Bauer et al. (2004). SO2in dust source regions
is reduced up to 80%, since condensation on dust provides the major sink of SO2. The
5
change of sulfate is in between. Thus our conclusion is robust even when considering the feedback of gas concentrations.
3.4 Other factors affecting Fe solubility
There are many factors affecting Fe solubility in the atmosphere besides HNO3, SO2
and sulfate (we will refer to SO2 alone hereafter), such as some organic acids that 10
can form complexes with Fe, and the pH of the aerosol solution. For instance, the Fe dissolution rate could be the same at pH=5 in the presence of oxalate as the one at pH=2 in the absence of oxalate (Cornell and Schwertmann, 2003; Martin 2005). HNO3and SO2could also directly increase the Fe dissolution rate (the second step of
the two-step mechanism) by reducing the pH of the aerosol solution, in which case SO2
15
may play a more important role than HNO3(Meskhidze et al., 2003, 2005). This study examines the relative contribution of HNO3and SO2to Fe solubility through dust aging,
the first step to dissolve Fe, by fixing the Fe dissolution rate. A more sophisticated parameterization of Fe dissolution will be conducted as the next step to explore new insights for a better understanding of Fe solubility.
20
Nevertheless, our method is supported by the major conclusions of several other modeling studies. Hand et al. (2004) and Luo et al. (2005) examined the correlation between simulated and observed Fe solubility by studying the effects of photoreduc-tion, cloud processing, SO2, pH, sulfate aerosol and organic carbonaceous aerosol.
Only cloud processing, among the six processes, is found to have an overall correla-25
tion larger than 0.2, and SO2is the next with a high correlation (Luo et al. 2005). The
use of a threshold RHsh of 76% for Fe dissolution in the Base case is close to being
ACPD
7, 10043–10063, 2007Air-to-sea flux of soluble iron: driven
more by HNO3 or SO2?
H. Yang and Y. Gao
Title Page Abstract Introduction Conclusions References Tables Figures ◭ ◮ ◭ ◮ Back Close Full Screen / Esc
Printer-friendly Version Interactive Discussion able to include cloud processing, and the two-step mechanism allows us to include the
effect of HNO3 and SO2on dust aging at the same time. An implicit assumption in our
method that the dissolved Fe remains under-saturated in the deliquesced dust solution is supported by Meskhidze et al. (2005), who examined the speciation of the dissolved Fe. And our conclusion is supported by recent observations by Ooki and Uematsu 5
(2005), who demonstrated that nitrate was the dominant acid associated with mineral dust particles rather than non-sea salt (nss)-sulfate. They also observed through an in situ experiment that HNO3 reacted with dust much more efficiently than SO2.
Obser-vations made over the remote ocean showed that there is more nitrate internally mixed with dust than nss-sulfate (Zhu et al., 1992), although some nitrate might have been 10
replaced by sulfate during cloud processing (Seinfeld and Pandis, 1998). Those find-ings provide additional justification to highlight the importance of HNO3 in dissolution
of Fe from mineral dust.
4 Summary
Our results show that HNO3makes a larger contribution to Fe mobilization than SO2
15
through dust aging in the atmosphere. In addition, the concentrations of HNO3 and
SO2are closely related to their precursors (NOx for HNO3) or emission sources, since both are short-lived gases (∼1 week in the troposphere). IPCC 2001 (A2p) predicted the emission of NOxto increase 4 times, and the emission of SO2to decrease slightly
in the next 100 years. We therefore suggest that the iron fertilization to oceanic biology 20
caused by air pollution is going to continue even if the fertilization caused by SO2
decreases in the future.
Acknowledgements. We would like to thank L. Horowitz for support of using MOZART-2. We
thank P. Falkowski for valuable comments. Discussions with H. Levy were helpful. NOAA/GFDL provided the computer resources for running MOZART-2. This work is supported by the NASA
25
award NNG04G091G.
ACPD
7, 10043–10063, 2007Air-to-sea flux of soluble iron: driven
more by HNO3 or SO2?
H. Yang and Y. Gao
Title Page Abstract Introduction Conclusions References Tables Figures ◭ ◮ ◭ ◮ Back Close Full Screen / Esc
Printer-friendly Version Interactive Discussion
References
Bauer, S. E., Balkanski, Y., Schulz, M., Hauglustaine, D. A., and Dentener, F.: Global modeling of heterogeneous chemistry on mineral aerosol surfaces: Influence on tropo-spheric ozone chemistry and comparison to observations, J. Geophys. Res., 109, D02304, doi:10.1029/2003JD003868, 2004.
5
Behrenfeld, M. J. and Falkowski, P. G.: Photosynthetic rates derived from satellite-based chloro-phyll concentration, Limnol. Oceanogr., 42, 1–20, 1997.
Buck, C. S., Landing, W. M., Resing, J. A., and Lebon, G. T.: Aerosol iron and aluminum solu-bility in the northwest Pacific Ocean: Results from the 2002 IOC cruise, Geochem. Geophys. Geosyst., 7, Q04M07, doi:10.1029/2005GC000977, 2006.
10
Coale, K. H., Johnson, K. S., and Chavez, F. P., et al.: Southern Ocean Iron Enrichment Exper-iment: Carbon Cycling in High- and Low-Si Waters, Science, 304, 408–414, 2004.
Coale, K. H., Fitzwater, S. E., Gordon, R. M., Johnson, K. S., and Barber, R.T.: Control of community growth and export production by upwelled iron in the equatorial Pacific Ocean, Nature, 379, 621–624, 1996.
15
Cornell, R. M. and Schwertmann, U.: The Iron Oxides, Structure, Properties, Reactions, Oc-currence and Uses, John Wiley, Hoboken, N. J, 2003.
Dentener, F. J., Carmichael, G. R., Zhang, Y., Lelieveld, J., and Crutzen, P. J.: Role of mineral aerosol as a reactive surface in the global troposphere, J. Geophys. Res., 101, 22 869– 22 889, 1996.
20
Duce, R. A., Liss, P. S., and Merrill, J. T., et al.: The atmospheric input of trace species to the world ocean, Global Biogeochem. Cycles, 5, 193–259, 1991.
Falkowski, P. G.: Evolution of the nitrogen cycle and its influence on the biological sequestration of CO2in the ocean, Nature, 387, 272–275, 1997.
Fan, S.-M., Horowitz, L. W., Levy II, H., and Moxim, W. J.: Impact of air pollution on wet
deposi-25
tion of mineral dust aerosols, Geophys. Res. Lett., 31, L02104, doi:10.1029/2003GL018501, 2004.
Fan, S.-M., Moxim, W. J., and Levy II, H.: Aeolian input of bio-available iron to the ocean, Geophys. Res. Lett., 33, L07602, doi:10.1029/2005GL024852, 2006.
Fung, I. Y., Meyn, S. K., Tegen, I., Doney, S. C., John, J. G., and Bishop, J. K. B.: Iron supply
30
and demand in the upper ocean, Glob. Biogeochem. Cyc., 14(1), 281-295, 2000.
Gao, Y., Fan, S.-M., and Sarmianto, J.: Aeolian iron input to the ocean through precipitation
ACPD
7, 10043–10063, 2007Air-to-sea flux of soluble iron: driven
more by HNO3 or SO2?
H. Yang and Y. Gao
Title Page Abstract Introduction Conclusions References Tables Figures ◭ ◮ ◭ ◮ Back Close Full Screen / Esc
Printer-friendly Version Interactive Discussion
scavenging: A modeling perspective and its implication for natural iron fertilization in the ocean, J. Geophys. Res., 108(D7), 4221, doi:10.1029/2002JD002420, 2003.
Goodman, A. L., Underwood, G. M., and Grassian, V. H.: A laboratory study of the heteroge-neous reaction of nitric acid on calcium carbonate particles, J. Geophys. Res., 105, 29 053– 29 064, 2000.
5
Hand, J. L., Mahowald, N. M., Chen, Y., Siefert, R. L., Luo, C., Subramaniam, A., and Fung, I.: Estimates of atmospheric-processed soluble iron from observations and a global mineral aerosol model: Biogeochemical implications, J. Geophys. Res., 109, D17205, doi:10.1029/2004JD004574, 2004.
Hanisch, F. and Crowley, J. N.: The heterogeneous reactivity of gaseous nitric acid on authentic
10
mineral dust samples, and on individual mineral and clay mineral components, Phys. Chem. Chem. Phys., 3, 2474–2482, 2001.
Horowitz, L. W., Walters, S., and Mauzerall, D. L., et al.: A global simulation of tropospheric ozone and related tracers: Description and evaluation of MOZART, version 2, J. Geophys. Res., 108(D24), 4784, doi:10.1029/2002JD002853, 2003.
15
Intergovernmental Panel on Climate Change (IPCC), Climate Change 2001: The scientific Ba-sis, Contribution of Working Group I to the Third Assesment Report of the Intergovernmental Panel on Climate Change, edited by J. T. Houghton et al., Cambridge Univ. Press, New York, 2001.
Jickells, T. D., An, Z. S., and Andersen, K. K., et al.: Global iron connections between desert
20
dust, ocean biogeochemistry, and climate, Science, 308, 67–71, 2005.
JPL Publication 02-25: Chemical Kinetics and Photochemical Data for Use in Atmospheric Studies, Evaluation Number 14, Jet Propulsion Laboratory, California Institute of Technology, Pasadena, California, 2003.
Judeikis, H. S., Stewart, T. B., and Wren, A. G.: Laboratory studies of heterogeneous reactions
25
of SO2, Atmos. Environ., 12, 1633–1641, 1978.
Junge C. E.: The modification of aerosol size distribution in the atmosphere, Final Tech. Rep. Contract-Da 91-591-EVC 2979, US Army, 1964.
Kalnay, E., Kanamitsu, M., and Kistler, R., et al.: The NCEP/NCAR 40-year reanalysis project, Bull. Am. Meteorol. Soc., 77, 437–471, 1996.
30
Luo, C., Mahowald, N. M., Meskhidze, N., Chen, Y., Siefert, R. L., Baker, A. R., and Johansen, A. M.: Estimation of iron solubility from observations and a global aerosol model, J. Geophys. Res., 110, D23307, doi:10.1029/2005JD006059, 2005.
ACPD
7, 10043–10063, 2007Air-to-sea flux of soluble iron: driven
more by HNO3 or SO2?
H. Yang and Y. Gao
Title Page Abstract Introduction Conclusions References Tables Figures ◭ ◮ ◭ ◮ Back Close Full Screen / Esc
Printer-friendly Version Interactive Discussion
Martin, J. H., Coale, K. H., and Johnson, K. S., et al.: Testing the iron hypothesis in ecosystems of the equatorial Pacific Ocean, Nature, 371, 123–129, 1994.
Martin, S. T.: Precipitation and dissolution of iron and manganese oxides, in Environmental Catalysis, edited by V. H. Grassian, pp. 61-81, CRC Press, Coca Roton, Fla, 2005.
Meskhidze, N., Nenes, A., Chameides, W. L., Luo, C., and Mahowald, N.: Atlantic Southern
5
Ocean productivity: Fertilization from above or below?, Global Biogeochem. Cycles, 21, GB2006, doi:10.1029/2006GB002711, 2007.
Meskhidze, N., Chameides, W. L., Nenes, A., and Chen, G.: Iron mobilization in mineral dust: Can anthropogenic SO2 emissions affect ocean productivity?, Geophys. Res. Lett., 30(21), 2085, doi:10.1029/2003GL018035, 2003.
10
Meskhidze, N., Chameides, W. L., and Nenes, A.: Dust and pollution: A recipe for enhanced ocean fertilization?, J. Geophys. Res., 110, D03301, doi:10.1029/2004JD005082, 2005. Ooki, A. and Uematsu, M.: Chemical interactions between mineral dust
parti-cles and acid gases during Asian dust events, J. Geophys. Res., 110, D03201, doi:10.1029/2004JD004737, 2005.
15
Seinfeld, J. H. and Pandis, S. N.: Atmospheric Chemistry and Physics, John Wiley & Sons, Inc., p. 537, 1998.
Spokes, L. J. and Jickells, T. D.: Factors controlling the solubility of aerosol trace metals in the atmosphere and on mixing into seawater, Aquatic Geochem., 1, 355–374, 1996.
Tie, X., Madronich, S., Walters, S., Edwards, D. P., Ginoux, P., Mahowald, N., Zhang, R., Lou,
20
C., and Brasseur, G.: Assessment of the global impact of aerosols on tropospheric oxidants, J. Geophys. Res., 110, D03204, doi:10.1029/2004JD005359, 2005.
Usher, C. R., Al-Hosney, H., Carlos-Cuellar, S., and Grassian, V. H.: A laboratory study of the heterogeneous uptake and oxidation of sulfur dioxide on mineral dust particles, J. Geophys. Res., 107(D23), 4713, doi:10.1029/2002JD002051, 2002.
25
Vlasenko, A., Sjogren, S., Weingartner, E., Stemmler, K., G ¨aggeler, H. W., and Ammann, M.: Effect of humidity on nitric acid uptake to mineral dust aerosol particles, Atmos. Chem. Phys., 6, 2147–2160, 2006,
http://www.atmos-chem-phys.net/6/2147/2006/.
Whitby, K. T.: The physical characteristics of sulfur aerosols, Atmos. Environ., 12, 135–159,
30
1978.
Zhu, X., Prospero, J. M., Millero, F. J., Savoie, D. L., and Brass, G. W.: The solubility of ferric ion in marine mineral aerosol solutions at ambient relative humidities, Mar. Chem., 38, 91–107,
ACPD
7, 10043–10063, 2007Air-to-sea flux of soluble iron: driven
more by HNO3 or SO2?
H. Yang and Y. Gao
Title Page Abstract Introduction Conclusions References Tables Figures ◭ ◮ ◭ ◮ Back Close Full Screen / Esc
Printer-friendly Version Interactive Discussion
1992.
ACPD
7, 10043–10063, 2007Air-to-sea flux of soluble iron: driven
more by HNO3 or SO2?
H. Yang and Y. Gao
Title Page Abstract Introduction Conclusions References Tables Figures ◭ ◮ ◭ ◮ Back Close Full Screen / Esc
Printer-friendly Version Interactive Discussion
Table 1. The uptake coefficients γ∗ of HNO
3and SO2on dust. γHNO 3 γSO2 Base case 5×10⁻⁵(RH<25%), 1×10⁻³ (RH>25%) 3×10⁻⁵(RH<50%), 3×10⁻⁴(RH>50%) Ref case 5×10⁻⁶ (RH<25%), 5×10⁻⁵ (RH>25%) 3×10⁻⁶ (RH<50%), 3×10⁻⁵(RH>50%) ∗The aged γ is assumed to be the same as the initial one. The RH threshold of 25% for HNO
3
and 50% for SO2follows Fan et al. (2006). The variation range of γSO2 is 3×10⁻⁵
–1×10⁻³, with
the lower limit measured by Usher et al. (2002) and upper limit by Judeikis et al. (1978), who also examined the variation of γSO
2 with relative humidity (RH). The variation range of γHNO3 is
5×10⁻⁵–0.1, with the lower limit measured by Goodman et al. (2000) and upper limit by Hanisch
and Crowley (2001). The measurement by Vlasenko et al. (2005) provides a RH dependence ofγHNO
3.
ACPD
7, 10043–10063, 2007Air-to-sea flux of soluble iron: driven
more by HNO3 or SO2?
H. Yang and Y. Gao
Title Page Abstract Introduction Conclusions References Tables Figures ◭ ◮ ◭ ◮ Back Close Full Screen / Esc
Printer-friendly Version Interactive Discussion
Table 2. Soluble Fe Flux to Each Major Oceanic Basin.
North South North South North South Subarctic Tropical Southern Indian Indian Pacific Pacific Atlantic Atlantic Pacificd Pacifice Oceanf
Base case aSol flux 70.6 59.1 227 63.6 229 82.2 58.7 27.0 32.8 b Sol flux 122 17.0 53.3 12.2 108 32.4 90.4 15.4 12.1 cSolubility 3.2 8.3 17 13 5.2 3.6 18 26 4.8 Ref case aSol flux 122 56.2 280 53.4 328 84.2 68.8 32.3 18.9 b Sol flux 211 16.1 65.9 10.3 154 33.2 106 18.4 6.94 cSolubility 5.5 7.7 19 10 7.4 3.7 20 27 2.1 a
Soluble Fe flux (109g yr−1) produced by having HNO
3, SO2and sulfate as the dust
transfor-mation agents;
b
Soluble Fe flux in µmol m−2yr−1; c
Fe solubility in percent;
d
between 40 N–60 N and 150 E–130 W;
e
between 10 S–10 N and 160 E–90 W;
f
between 70 S–50 S.
ACPD
7, 10043–10063, 2007Air-to-sea flux of soluble iron: driven
more by HNO3 or SO2?
H. Yang and Y. Gao
Title Page Abstract Introduction Conclusions References Tables Figures ◭ ◮ ◭ ◮ Back Close Full Screen / Esc
Printer-friendly Version Interactive Discussion 100 101 102 100 101 102 1 2 3 4 5 6 7 8 A B C D E F G H I J K Observed Fe Solubility (%) Simulated Fe Solubility (%) wet dep dry dep
Fig. 1. Comparison of simulated and observed Fe solubility (%) for the Base case. Model
results are monthly or annual means for long-term observations and averaged on the corre-sponding days and grid-box locations for cruises. Most of the observations are in Table 1 of Fan et al. (2006). We adopt the observations in Buck et al. (2006) for the Pacific instead of us-ing Hand et al. (2004) that has the Fe(II) solubility. (1) NE Mediterranean (36.5 N, 34.25 E); (2) NW Mediterranean, (43.5 N, 4.5 E); (3) Britanny, France (47.8 N, 4.3 E); (4) Rhode Island, USA (42.0 N, 72.0 W); (5) North Carolina, USA (34.22 N, 77.86 W); (6) Dumont, Antarctic (65.0 S, 141.0 E); (7) Summit, Greenland (38.5 N, 72.5 W); (8) Bermuda (31.4 N, 64.1 W); A-D. Atlantic cruises (∼26 N, 15 N: January–February; 5 N, 15 N: Jul-Aug); E. Pacific cruise (∼22 N–50 N); F. Xi’an (∼34 N, 109 E). G-H. Atlantic cruises (49 N-25 N, 21 N–5 N); I. Barbados (13.17 N, 59.43 W); J-K. Atlantic cruises (2 N–12 S, 16 S–43 S).
ACPD
7, 10043–10063, 2007Air-to-sea flux of soluble iron: driven
more by HNO3 or SO2?
H. Yang and Y. Gao
Title Page Abstract Introduction Conclusions References Tables Figures ◭ ◮ ◭ ◮ Back Close Full Screen / Esc
Printer-friendly Version Interactive Discussion
Fig. 2. Global distribution of (a) the annual mean soluble Fe flux (µmol m−2 yr−1) and (b) Fe
solubility (%) over the ocean.
ACPD
7, 10043–10063, 2007Air-to-sea flux of soluble iron: driven
more by HNO3 or SO2?
H. Yang and Y. Gao
Title Page Abstract Introduction Conclusions References Tables Figures ◭ ◮ ◭ ◮ Back Close Full Screen / Esc
Printer-friendly Version Interactive Discussion
Fig. 3. Global distribution of the annual mean ratio of soluble Fe flux produced by HNO3versus that by SO2and sulfate (F23) over the ocean.