Increased Volume and Function of Right Auditory Cortex as a Marker for Absolute Pitch
Martina Wengenroth
1†, Maria Blatow
2,†, Armin Heinecke
3, Julia Reinhardt
2, Christoph Stippich
2, Elke Hofmann
4and Peter Schneider
1,51
Department of Neuroradiology, University of Heidelberg Medical School, 69120 Heidelberg, Germany,
2Division of Diagnostic
and Interventional Neuroradiology, Department of Radiology, University of Basel Hospital, 4031 Basel, Switzerland,
3Brain
Innovation, 6229 Maastricht, The Netherlands,
4University of Applied Sciences and Arts Northwestern Switzerland/Academy of
Music, 4003 Basel, Switzerland and
5Department of Neurology, Section of Biomagnetism, University of Heidelberg Medical
School, 69120 Heidelberg, Germany
†
These authors contributed equally to this work.
Address correspondence to Dr Peter Schneider. Email: [email protected].
Absolute pitch (AP) perception is the auditory ability to effortlessly
recognize the pitch of any given tone without external reference. To
study the neural substrates of this rare phenomenon, we developed
a novel behavioral test, which excludes memory-based interval
rec-ognition and permits quanti
fication of AP proficiency independently
of relative pitch cues. AP- and non-AP-possessing musicians were
studied with morphological and functional magnetic resonance
imaging (fMRI) and magnetoencephalography. Gray matter volume
of the right Heschl
’s gyrus (HG) was highly correlated with AP
pro-ficiency. Right-hemispheric auditory evoked fields were increased in
the AP group. fMRI revealed an AP-dependent network of right
planum temporale, secondary somatosensory, and premotor
cor-tices, as well as left-hemispheric
“Broca’s” area. We propose the
right HG as an anatomical marker of AP and suggest that a
right-hemispheric network mediates AP
“perception,” whereas pitch
“la-beling
” takes place in the left hemisphere.
Keywords: Heschl
’s gyrus, magnetoencephalography MEG, musicians,
planum temporale, functional magnetic resonance imaging
Introduction
Absolute pitch (AP) perception is the rare auditory ability to
immediately and effortlessly recognize or produce the pitch
of any given tone without using an external reference (
Takeu-chi and Hulse 1993
;
Zatorre 2003
). In other words, people
with AP (or
“perfect pitch”) do not require the aid of a
pre-viously perceived reference tone or tonal system to recognize
and label any pitch instantaneously. The prevalence of AP is
estimated to be
∼0.01% in the general population, but ∼7–
32% in professional musicians (
Baharloo et al. 1998
;
Greger-sen et al. 1999
). Owing to its discrete distribution and its
ap-parent independence of other cognitive functions (i.e. AP
subjects are not generally known to have speci
fic advantages
in other cognitive domains) AP is regarded as a model for the
interaction between genetic and environmental factors in
brain function and development (
Baharloo et al. 2000
;
Gre-gersen et al. 2001
;
Zatorre 2003
;
Theusch et al. 2009
). The
quality of AP ranges from recognition of speci
fic notes,
tonal-ities, or musical instruments, for example, standard pitch A
440 Hz or C major key, to outstanding abilities including
absolute perception and production of any pitch irrespective
of the kind of sound. AP possessors often compare their
audi-tory ability to hear tones absolutely to the common visual
ability of instantaneous color recognition and labeling, as no
cognitive effort is required.
There are a number of studies describing substantial
differ-ences between the brains of musicians and non-musicians
both in terms of morphology and function (
Altenmuller 2001
;
Munte et al. 2002
;
Schneider et al. 2002
;
Sluming et al. 2002
;
Gaser and Schlaug 2003
;
Bermudez and Zatorre 2005a
,
2005b
;
Bangert et al. 2006
;
Rosenkranz et al. 2007
;
Bermudez
et al. 2009
), but only few authors have focused speci
fically on
brain attributes of musicians with AP: previous neuroimaging
studies have determined a hemispheric asymmetry of the
planum temporale (PT) as an anatomical feature associated
with AP possession, in particular reduced size of the right PT
in AP musicians (
Schlaug et al. 1995
;
Keenan et al. 2001
;
Luders et al. 2004
;
Wilson et al. 2009
). This is in line with the
observation that AP ability may be preserved after a left
tem-poral lobectomy (
Zatorre et al. 1989
). As a consequence, the
involvement of left- versus right-hemispheric structures in AP
was emphasized with regard to anatomical (
Zatorre et al.
1998
;
Bermudez et al. 2009
;
Loui et al. 2010
;
Oechslin et al.
2010
) and functional characteristics (
Zatorre et al. 1998
;
Ohnishi et al. 2001
;
Bermudez and Zatorre 2005a
,
2005b
;
Schulze et al. 2009
;
Wilson et al. 2009
).
Despite the growing body of data, there is still no clear
picture of the neural underpinnings of the AP phenomenon
(
Zatorre 2003
;
Levitin and Rogers 2005
). With respect to the
neurophysiological basis of AP processing, several brain areas
have been implicated. Left posterior dorsolateral frontal
cortex (DLFC) is the most notable nonauditory area that has
been associated with pitch memory and labeling aspects
(
Zatorre et al. 1998
;
Ohnishi et al. 2001
;
Oechslin et al. 2010
).
Furthermore, bilateral parietal and premotor regions are
as-cribed to participate in early components of pitch perception
(
Schulze et al. 2009
). It appears that the mutual interaction
between temporal and frontal areas may be a key to the
un-derstanding of AP (
Zatorre et al. 1998
;
Halpern and Zatorre
1999
;
Zatorre 2003
;
Gaab et al. 2006
;
Oechslin et al. 2010
).
Moreover, processes of pitch perception, pitch memory, and
pitch labeling are likely to involve distinct or incompletely
overlapping neuronal networks (
Levitin and Rogers 2005
;
Wilson et al. 2009
), and thus, partially diverging results in the
existing literature could be explained by task-related
differ-ences in neuroimaging experiments.
In this study, we developed a novel behavioral test that
ex-cludes memory-based interval recognition and allows for
quanti
fication of AP proficiency. This test enables the
charac-terization of genuine AP possessors independently from any
interaction of pitch identi
fication by relative pitch (RP) cues.
RP refers to the ability to make pitch judgments about the
© The Author 2013. Published by Oxford University Press. All rights reserved. Cerebral Cortex May 2014;24:1127–1137
doi:10.1093/cercor/bhs391
relation between notes, such as within a musical interval
(
Zatorre et al. 1998
), and is a well-developed skill among
most professional musicians. In the previous neuroimaging
literature, RP possessors have been de
fined as subjects
“without AP” (
Pantev et al. 1998
;
Zatorre et al. 1998
;
Schulze
et al. 2009
). However, AP musicians may have a wide range
of RP abilities (
Miyazaki 1992
), and on the other hand,
excel-lent RP listeners are frequently encountered among
self-reported AP musicians due to the fact that they may derive
“temporary AP cues” by memorizing an external reference
tone/system. Therefore, we hypothesize that RP and AP are
independent of one another, and we consider a systematic
separation of RP and AP cues essential for the accurate
identi-fication of AP perception.
Multimodal neuroimaging including functional magnetic
resonance imaging (fMRI), individual morphometry of the
auditory cortex, and magnetoencephalography (MEG) was
performed in AP possessing and nonpossessing musicians.
We hypothesized that the difference between AP and non-AP
musicians would be apparent at the early steps of auditory
perception (no cognitive effort required) and therefore
applied passive listening auditory paradigms for fMRI and
MEG. Also, we postulated that by employing our established
morphometry technique based on individual segmentation of
the auditory cortex, which proved to be more sensitive to
in-terindividual gray matter differences in peripheral cortical
structures than other methods (
Schneider et al. 2002
,
2005
;
Wengenroth et al. 2010
), we would identify an anatomical
marker correlated with AP pro
ficiency.
Materials and Methods
Subjects
One hundred sixty-two professional and amateur musicians per-formed the AP test. After meeting the inclusion criteria (AMMA musical aptitude score >26 [Gordon 1998], minimum 5 years of instru-mental practice beyond the standard school education, normal hearing, and no history of neurological disorders), subgroups of 18 AP (mean AP score 31.6 ± 3.6) and 18 non-AP musicians (mean AP score 9.5 ± 2.6; P < 0.0001) matched for gender (9 males and 9 females in each group), age (mean age 35 ± 15 in AP and 32 ± 11 years in non-AP group; P = 0.5), musical training intensity (mean cumulative training intensity 17 ± 11 vs. 13 ± 9 weekly hours averaged over the past 3 years; P = 0.2), and sound perception preference (mean sound perception index δ [Schneider et al. 2005]: AP -0.16 ± 0.65, non-AP -0.12 ± 0.73; P = 0.85) underwent further multi-modal neuroimaging. All subjects gave their informed consent to par-ticipate in the experiments, which were approved by the Ethics committee of Heidelberg University.
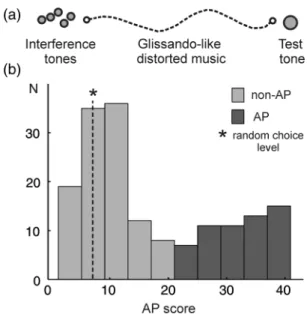
AP Test
The test was specifically designed to allow for quantification of the degree of AP ability (AP score) and consisted of 28 equally tempered (relative to standard pitch [a′] = 440 Hz) sampled instrumental test tones ( piano, guitar, violin, organ, wood wind, brass, and voice) and 7 sine tones that were presented for 500 ms each in low-, middle, and high-frequency ranges (32–138, 175–625, and 1000–2000 Hz, respect-ively) as well as 6 active tone production tasks. Different instrumental test tones have been chosen to address the fact that AP abilities may be influenced by timbre or register. To rule out any RP-associated in-terval recognition, memory of the last test tone was extinguished by intermittent interference stimuli without any harmonic relation to standard pitch. First, 5 nonequally tempered sequential instrumental tones resembling and contorting the previous test tone were pre-sented for 500 ms each followed by 18 s of glissando-like
continuously distorted music pieces (see Supplementary Materials for sound example). Only chroma, not octavations were tested. For correct tones 1 point was accredited, and for semitone errors 0.5 point was accredited, resulting in a maximal score of 41 points. The random choice score was 6.9. The inclusion criterion for the AP group was set as the saddle point of the bimodal distribution curve (>21 score points).
Morphological MRI
High-resolution T1-weighted 3D MR images of the brain (magnetization-prepared rapid acquisition of gradient echo sequence: echo time 4.38 ms, repetition time 1930 ms, 1-mm3 isotropic resol-ution,flip angle 15°, 176 contiguous sagittal slices, matrix size 256 mm) were acquired at 3 T (Magnetom Trio, Siemens, Erlangen, Germany) with an 8-channel head coil. Additional T2-weighted se-quences were obtained and assessed by a neuroradiologist for
poten-tial pathologies. MR morphometry was performed using
semiautomated BrainVoyager QX segmentation software (version 2.0, Brain Innovation, Maastricht, The Netherlands). Images were cor-rected for inhomogeneity, transformed into anterior commissure–pos-terior commissure plane, and subsequently normalized in Talairach (TAL) space (Talairach and Tournoux 1988). Subsequently, individual segmentation and 3D surface reconstruction of auditory cortices were performed. In particular, the superior temporal gyrus (STG) including Heschl’s gyrus (HG), anterior superior temporal cortex and PT, was segmented on sagittal images in a semiautomated slice-by-slice ap-proach employing standard definitions of the anatomical auditory cortex landmarks (Rademacher et al. 2001; Penhune et al. 2003;
Wong et al. 2008) and according to established criteria (Schneider et al. 2005; Wengenroth et al. 2010). In particular, the HG was defined as the most anterior transverse gyrus of STG located between the first transverse sulcus and Heschl’s sulcus (HS). In the case of multiple gyration, transverse gyri posterior to thefirst HG were con-sidered to be posterior HG duplications if they were separated from HG by a complete HS. Often (but inconsistently) HG was indented by a local sulcus in its central, lateral or medial part (i.e., medial HS). For morphometric analysis, the subdivided HG was calculated including its various medial or lateral duplications anterior to thefirst complete HS. The PT was defined as the plane cortical structure posterior to the HG. Its anterior border was considered the complete HS posterior to HG. In case of multiple complete posterior duplications, the anterior border of PT was defined as the last complete transverse sulcus pos-terior to the duplications. The pospos-terior border of PT was defined as the origin of the ascending ramus (if present), the medial border was the insular cortex, and the inferior border was the supratemporal sulcus. Gray matter volumes of left and right HG and PT were deter-mined according to individual intensity histograms with a voxel-counting algorithm. For the correct identification of PT, HG, and oc-curring duplications, a critical step was the visualization of sulcal boundaries. Three-dimensional surface reconstruction of auditory cor-tices allowed for reliable allocation of anatomical landmarks. To compare anatomical landmarks between groups, stereotactic TAL co-ordinates of individual auditory cortex were mapped and then were plotted groupwise for comparison using Matlab software (version 7.1, Mathworks, Natick, MA, USA).
Functional MRI
Block-designed blood-oxygen-level-dependent (BOLD) fMRI (echo planar imaging [EPI] sequences, 36 oblique slices parallel to the Sylvian fissure, slice thickness 3 mm, gap 1 mm, echo time 30 ms, repetition time 2500 ms) was performed during auditory stimulation with different sampled instrumental and synthetically generated complex harmonic tones (Schneider et al. 2005) that were presented for 12:25 min in total (stimulus length 500 ms, 20 items per block, block duration 20 s, baseline: rest). Subjects were instructed to pas-sively listen to the presented stimuli (without thinking of anything else in particular). Subsequent to motion correction, alignment, and TAL transformation, all functional maps were superimposed on both the structural 3D datasets and the 3D reconstructions of individual auditory cortices using BrainVoyager QX software (version 2.0, Brain
Innovation, Maastricht, The Netherlands). Auditory stimulation was contrasted with the baseline condition (no tone) individually using dynamic threshold (Fig.4; Blatow et al. 2007) and per group using separate subjectsfixed effects (FFX) analysis (at P < 0.001, Bonferroni corrected; Fig.5a,b). A contrast map of AP > non-AP group was gener-ated (P < 0.001, Bonferroni corrected, Fig. 5c). Random effects (RFX) analysis was calculated using the AP score as a covariate and corrected for cluster level threshold (P < 0.01; minimum cluster level = 9 voxels; Fig.5d;Roebroeck et al. 2005).
Employing a dynamic threshold technique (Blatow et al. 2007), individual centers of gravity for right-hemispheric HG and PT localiz-ation were determined (Fig. 6a). With respect to these reference regions, instantaneous functional connectivity analysis was performed using vector autoregressive models (individual FDR correction; P < 0.01;Roebroeck et al. 2005). This approach allows for whole-brain voxel-by-voxel analysis of coactivations synchronized with the refer-ence seed regions on the individual and group level.
Magnetoencephalography
Auditory evokedfields were recorded using a Neuromag-122 whole-head MEG system in response to different sampled instrumental and synthetically generated complex harmonic tones in analogy to the fMRI experiment. Subjects were instructed to listen passively to the sounds, each of which was presented 200 times in pseudorandomized order (tone length 500 ms, interstimulus interval range 400–600 ms). Cortical responses were individually analyzed, and 2600 single events were averaged for source analysis using the BESA program (MEGIS Software GmbH, Graefelfing, Germany). In this work, we put particular empha-sis on the clear separation of the early auditory evoked P1 response peaking around 45–70 ms after tone onset and the later N1 and P2(a) responses employing an established and optimized spatio-temporal source modeling method (Schneider et al. 2005; Wengenroth et al. 2010). Owing to the interaction (and mutual influence) of the primary source in HG and the posterior sources in PT, we therefore employed 2 different analysis approaches (Figs2and3) for the HG and PT: 1. Individual earlyfit of the P1 response in HG using a peak-based
definition (2 dipoles model: 1 dipole per hemisphere). This ap-proach accounts for the interindividual variability of the P1 peak latency (range 45–75 ms after tone onset) and of the peak width. Thefitting intervals have been individually adjusted according to the time intervals around the P1 peak in HG defined by their half-side lobes (Fig.3a, gray shaded areas). The fitted location and orientation of the P1 response in HG was highly robust in all cases and provided a systematic separation of the P1 response from the subsequent N1 response.
2. Late fit of the P2a response in PT using a fixed time interval (4 dipoles model). Based on the constraint of the 2 dipolesfit to the P1 response (1 in each hemisphere), 2 further dipoles in PT werefit to the P2a response using afixed fit interval (time range 150–300 ms) for all subjects (Fig.3b, gray shaded area). Subsequently, the spatial orientation wasfit to the same fit interval in all subjects (150–300 ms). Response peaks derived from thisfitting technique were referred to as“P1a” and “P2a” (4 dipoles model). In cases of very weak and/ or broad P2a response, which did not allow for a clear identification of the P2a peak, the P2a dipole was seeded based on the center of gravity (COG) of functional activation in the fMRI experiment. Signal strength was calculated for each peak relative to a 100-ms base-line. Onset, latencies, and amplitudes of the P1 and P2(a) responses were analyzed on an individual level and then averaged across groups. To validate the results, we additionally calculated the source waveforms with an fMRI-based constraint, taking the COG of the fMRI activation in the group contrast map (TAL coordinates: right HG: 61/−9/6, left HG: −52/−14/8, right PT: 63/−36/18, left PT: −60/−29/ 5, see Table2) as afixed (seeded) location for calculation of the MEG source waveforms (and onlyfitting the orientation).
Statistics
Demographic, psychoacoustic, MRI morphometry data, as well as MEG results are presented as mean (± standard error); statistical
significance between groups was assessed using 2-tailed paired Stu-dent’s t-test. General linear models in fMRI experiments were calcu-lated on a separate subject basis using either FFX or RFX statistics. Statistical parametric maps were displayed after correction for mul-tiple comparisons using conservative Bonferroni correction method for FFX (fixed threshold P < 0.001) or cluster-level threshold method (RFX; P < 0.01;Roebroeck et al. 2005).
Results
Bimodal Distribution of AP Pro
ficiency in Musicians
The AP test allowed for gradual quanti
fication of AP
percep-tion. A ceiling effect could be ruled out since only one subject
achieved the highest possible AP score (41 score points). The
saddle point (>21 score points) of the bimodal distribution
curve was chosen as a conservative inclusion criterion for the
AP group (Fig.
1
). As subjects were recruited at music
insti-tutions, and self-reported AP possessors were speci
fically
invited to participate, the proportion of AP musicians in our
study was exceptionally high (N = 60/162; 37%) and is not
considered representative.
Increased Volume of Right HG in AP
Individual analysis of gray matter volume of the auditory
cortex in a subgroup of 18 non-AP musicians and 18 AP
musi-cians matched for age, gender, musical training, and holistic
versus spectral sound perception preference yielded an
in-creased size of the right HG in the AP group (6 ± 0.2 cm
3) in
comparison with the non-AP group (3.4 ± 0.3 cm
3; P < 0.0001;
Table
1
a, Fig.
2
a,b). Gray matter volume of the right HG
cor-related highly with AP pro
ficiency (r = 0.83; P < 0.0001
Figure 1. Absolute pitch test shows bimodal distribution of AP perception. (a) Test design: the test tone (500 ms) is preceded by interference stimuli, namely 5 nonequally tempered sequential instrumental tones (2.5 s) followed by glissando-like continuously distorted music pieces (18 s). The test comprises 41 test items consisting of instrumental, sine tones, and active tone production tasks. For correct tones 1 point and for semitone errors 0.5 point is accredited. (b) One hundred sixty-two musicians performed the AP test, which yields a bimodal distribution of AP (red) and non-AP possessors (blue). Inclusion criteria for the AP group are 22–41 score points, (random choice level is 6.9; marked with an asterisk).
Fig.
2
c). Consistent with the enlarged right HG, the right PT
size was reduced in the AP group (r = −0.63; P < 0.0001);
hence, common leftward asymmetry of the PT was even more
pronounced.
Right-Hemispheric Posterior MEG Dipole Shift and
Enhanced Auditory Evoked Fields in AP
In the left hemisphere of both groups, MEG dipoles (adjusted
to the early P1 and later P2a response of auditory evoked
fields) were localized in near proximity at the posterior bank
of HG duplications (P1) and in anterior PT (P2a), respectively
(Fig.
2
a,b). In the right auditory cortex of the non-AP group,
the averaged P1 response was found to originate within HG
(Fig.
2
a). In comparison, in the AP group, the right P1 dipole
was localized 10 mm further behind in the
first right HS, and
the late P2a 15 mm further behind in the right PT, leading to
a separation of MEG dipoles in the axial plane (Fig.
2
b,
Table
1
b). The posterior shift of right P2a correlated well with
AP pro
ficiency (r = 0.67; P < 0.0001). Averaged MEG source
waveforms in response to auditory stimulation showed no
sig-ni
ficant differences across groups between auditory evoked
fields adjusted to the early P1 component in bilateral HG
(right P1 amplitude: 16.2 ± 1.8 nAm in non-AP and 20.4 ± 2.8
nAm in AP, P = 0.31; left P1 amplitude: 19.1 ± 2.1 nAm in
non-AP and 23.6 ± 2.7 nAm in AP, P = 0.29; Fig.
2
d,e).
However, the amplitude of right P2a in PT was signi
ficantly
increased in the AP group compared with the left hemisphere
and in comparison with the non-AP group (non-AP 5.3 ± 1.3
nAm versus AP 14.7 ± 1.7, P = 0.001; Fig.
2
e, bottom,
Table
1
b). The integral of right P2a amplitude correlated
highly with AP pro
ficiency (r = 0.75; P < 0.0001, Fig.
2
f). In
addition, we analyzed the data with an fMRI-based constraint,
taking the COG of the BOLD activation as a
fixed (seeded)
location for calculation of the MEG source waveforms. The
Figure 2. Morphology and function of right auditory cortex in AP. (a and b) Averaged individual auditory cortex landmarks illustrate increased size of HG (marked in gray) and subsequently smaller PT in the right hemisphere of the AP group when compared with the non-AP group (green dots: MEG dipole localization of early P1 response in HG, red dots: P2a dipoles in PT). According to neurological convention, the right hemisphere is shown on the reader’s right side. (c) Correlation of gray matter volume of right HG with AP proficiency (blue dots: non-AP subjects, red dots: AP subjects). (d and e) Average MEG source waveforms in response to auditory stimulation of right HG (green trace), right PT (red trace), and left HG and PT (dashed traces) in non-AP and AP groups. P2a amplitude in right PT of AP possessors was increased compared with the left hemisphere and in comparison with non-AP musicians (P2a integral andfit interval between 150 and 300 ms marked in gray). (f) Correlation of the integral of P2a in right PT with AP proficiency.
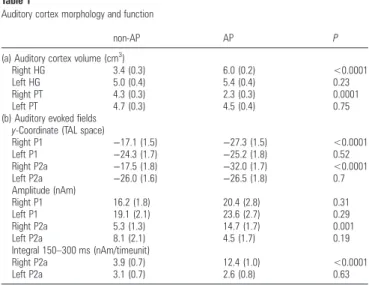
Table 1
Auditory cortex morphology and function
non-AP AP P
(a) Auditory cortex volume (cm3 )
Right HG 3.4 (0.3) 6.0 (0.2) <0.0001
Left HG 5.0 (0.4) 5.4 (0.4) 0.23
Right PT 4.3 (0.3) 2.3 (0.3) 0.0001
Left PT 4.7 (0.3) 4.5 (0.4) 0.75
(b) Auditory evokedfields y-Coordinate (TAL space)
Right P1 −17.1 (1.5) −27.3 (1.5) <0.0001 Left P1 −24.3 (1.7) −25.2 (1.8) 0.52 Right P2a −17.5 (1.8) −32.0 (1.7) <0.0001 Left P2a −26.0 (1.6) −26.5 (1.8) 0.7 Amplitude (nAm) Right P1 16.2 (1.8) 20.4 (2.8) 0.31 Left P1 19.1 (2.1) 23.6 (2.7) 0.29 Right P2a 5.3 (1.3) 14.7 (1.7) 0.001 Left P2a 8.1 (2.1) 4.5 (1.7) 0.19 Integral 150–300 ms (nAm/timeunit) Right P2a 3.9 (0.7) 12.4 (1.0) <0.0001 Left P2a 3.1 (0.7) 2.6 (0.8) 0.63
Note: (a) refers to morphometry of Heschl’s gyrus (HG) and planum temporale (PT): mean gray matter volume (cm3
). (b) refers to auditory evokedfields as measured by MEG. Statistics: P values (paired 2-tailed Student’s t-test); standard error in parentheses.
results were comparable in both analysis methods, in
particu-lar the main
finding of an increased P2a response in right PT
of AP musicians was reproducible (data not shown).
However, the inverse solution yielded more consistent results
with higher peak amplitudes. We believe that this is best
ex-plained by the fact that the localization of MEG activation is
not perfectly mirrored by that of BOLD COG, as former
corre-sponds to cortical activity in the
first few hundred
millise-conds, whereas the latter represents the summation of cortical
activity over 2.5 s (e.g., repetition time of the EPI sequence),
which is dominated by secondary auditory structures.
Morphology and Function of Right Auditory Cortex as a
Marker for AP Perception
AP-speci
fic volume increase of right HG combined with
right-hemispheric shift of MEG dipoles to posterior parts of HG
and PT (as detected by groupwise comparison) were clearly
distinguishable on the individual level as well (Figs
3
and
4
).
Employing the peak-adjusted
fitting method a clear
separ-ation of the anterior HG dipole (P1) and posterior PT dipole
(P2a) was achieved (Fig.
3
). Furthermore, individual analysis
of BOLD activation in response to auditory stimulation with
instrumental and harmonic complex tones revealed an
expan-sion of auditory cortex activation to dorsal parts of the right
STG including posterior HG duplications and PT (Fig.
4
). This
finding indicates these structures’ functional significance in
basic auditory perception in AP subjects.
Activation of a Right-Dominant Network of Auditory
and Non-Auditory Areas in AP Musicians
In non-AP musicians, auditory stimulation led to BOLD
acti-vation of an extended bilateral network of auditory and
non-auditory areas, including HG, PT, temporo-parietal junction
(TPJ), secondary somatosensory cortex (S2) as well as
primary motor cortex (M1), premotor cortex (PMC), and
lateral prefrontal cortex (LPFC). BOLD activations of temporal
poles, visual association areas, and midline structures such as
the medial prefrontal cortex were increased in the baseline
condition compared with auditory stimulation (Fig.
5
a). In
general, AP musicians recruited the same functional network
during this passive listening task. However, BOLD activations
were increased in comparison with the non-AP group, in
par-ticular in premotor (ventral and dorsal PMC) as well as
sup-plementary (SMA) and cingulate (CMA) motor areas (latter
not shown) as well as in PT and TPJ (Fig.
5
b). These bilateral
effects were more pronounced in the right hemisphere.
The contrast map of the 2 groups revealed a higher
acti-vation of right-hemispheric dorsal STG including PT, which
pivoted via TPJ and interfaced with bilateral yet
right-dominant S2 and PMC (Fig.
5
c, Table
2
a). Furthermore,
acti-vation was increased in left-hemispheric pars opercularis of
inferior frontal gyrus (IFG), functionally corresponding to
“Broca’s” area. On the other hand, activation of the bilateral
anterior HG was reduced in the AP group compared with the
non-AP musicians. This effect was again more pronounced in
Figure 3. Individual source modeling of primary and secondary auditory evokedfields. Three (exemplary) individual source waveforms in response to auditory stimulation of right HG (green traces), right PT (red traces), left HG and PT (dashed traces), showing thefitting intervals to obtain the primary P1 response of HG and the secondary P2a response of PT. While thefitting intervals of the P1 response were individually adjusted to time intervals around the P1 peak defined by their half-side lobes, the fitting interval of the P2a response was defined as a fixed interval (150–300 ms) for all subjects. Based on a grand average of 2600 tones, the fitted location of the P1 response in HG was robust in all cases. Regarding the later P2a response of PT, thefitted location was robust in most cases. In subjects with a very broad or weak P2a response, dipole coordinates were seeded based on the center of gravity of BOLD activation in the fMRI experiment (subject 3, red triangle).
the right hemisphere (t value right HG −10.2 vs. left HG
−6.79, P < 0.001 Bonferroni correction; Fig.
5
c, Table
2
a).
Regression analysis using separate subject RFX statistics
with the AP score as a covariate demonstrated covariation in
right PT/TPJ, S2, and PMC as well as left
“Broca’s” area
(Fig.
5
d). AP-dependent correlation of BOLD activation was
highest in right PT/TPJ (r = 0.63; Table
2
b).
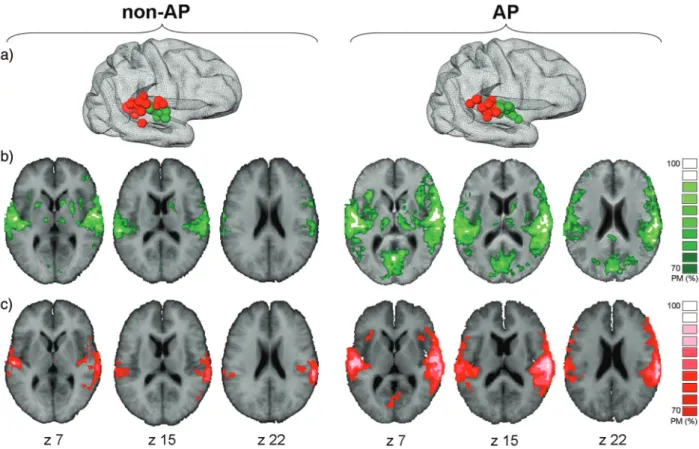
Analysis of individual localization of functional HG and PT
coordinates yielded a higher spatial distribution of right PT
coordinates in non-AP subjects compared with the AP group
who presented a more restricted spatial distribution of PT
co-ordinates (Fig.
6
a). In the non-AP group, instantaneous
func-tional connectivity measuring synchronized fMRI responses in
reference to right HG and PT seed regions were essentially
limited to the bilateral auditory cortex. In contrast, in the AP
group, those reference regions were functionally connected
with a large-scale network of bilateral, right-dominant
auditory and nonauditory brain areas including PT, TPJ, S2,
vPMC, dPMC, and
“Broca,” but also anterior insular cortex
and visual association areas in the cuneus (Fig.
6
b,c).
More-over, right HG activation was synchronized with extended
activation in middle and posterior cingulate (including CMA
and SMA; not shown).
Discussion
AP versus RP
—the Necessity for an Interval Recognition
Independent AP Test
Most neuroimaging experiments addressing the AP
phenom-enon rely on group data contrasts calculated after
categoriz-ation of subjects into AP and non-AP possessors. Whether or
not a person belongs to the AP-possessing group is usually
determined by either trusting a self-report or by
psychoacous-tic testing of AP ability, which in the past did not speci
fically
exclude potential in
fluences of memory-based interval
recog-nition (
Schlaug et al. 1995
;
Baharloo et al. 1998
;
Athos et al.
2007
;
Oechslin et al. 2009
,
2010
;
Wilson et al. 2009
). For
example, by recognizing the
first test tone as “a” and
dedu-cing following test items from there, a subject with high RP
pro
ficiency memorizing a single reference tone would have
been classi
fied as an AP possessor. Thus, in many cases, the
differentiation between AP and RP ability is either not
sidered or subjects who perform badly in the AP test are
con-sidered RP possessors. This approach harbors a number of
immanent problems. First, it is not yet clear if AP perception
represents a distinct cognitive mechanism or an extreme
phe-notypic deviation on a continuum of RP ability, yet more
ar-guments seem to exist in favor of the former hypothesis
(
Miyazaki 1992
;
Zatorre 2003
;
Athos et al. 2007
). Second, as
for AP, there seems to be a wide range of RP ability up to
out-standing
“temporary AP-like” performances memorizing a
single reference tone (E. Hofmann, personal communication).
To date, there is no speci
fic behavioral test of RP proficiency,
but arguably, a very good RP ability would result in a high AP
score if relative memory cues are not controlled for.
Neuro-imaging studies that do not clearly separate between AP and
RP subjects might unravel the mutual neural mechanisms
and/or networks of these 2 abilities but not necessarily the
AP-speci
fic network. However, it seems likely that RP and AP
abilities rely on distinct and presumably independent
net-works, since many functions of auditory perception are
known to be lateralized (
Geschwind and Levitsky 1968
;
Stein-metz 1996
;
Westbury et al. 1999
;
Galuske et al. 2000
;
Alten-muller et al. 2002
;
Devlin et al. 2003
;
Schneider et al. 2005
;
Wong et al. 2008
;
Wengenroth et al. 2010
). Taken together,
these lines of reasoning led us to design a novel AP test in
which interference stimuli placed between the test stimuli
were meant to disrupt any possible tonal reference system in
the listeners mind. Along the lines of previous studies, we
found a bimodal distribution of the AP trait (
Athos et al.
2007
). Moreover, the test yielded gradual quanti
fication of AP
ability without any ceiling effect, which in turn allowed for
interindividual comparison and correlation with
neuroima-ging
findings.
Increased Volume and Function of Right HG as a
Marker of AP Pro
ficiency
The
finding of increased volume of right HG in AP musicians
is well in line with the PT asymmetry described in previous
Figure 4. Individual morphology and function of the auditory cortex. Individual fMRI responses and MEG dipoles are superimposed onto the respective bilateral auditory cortices. Six representative examples of each group are shown (green dots: localization of early P1 response in HG, red dots: P2a dipoles in PT). The right auditory cortex is dominant in the AP group in terms of morphology and BOLD activation in comparison with the left side and to non-AP musicians. Increased posterior shift of the P2a dipole leads to a separation of right-hemispheric dipoles in the AP group.
studies (
Schlaug et al. 1995
;
Keenan et al. 2001
;
Wilson et al.
2009
). Moreover, for the
first time, it explains why the smaller
size of the right PT (and not a larger left PT) was the better
predictor of AP ability and points to a predominant role of the
right auditory cortex in AP perception. On the functional
level, increased activation of right HG and PT as a response to
auditory stimulation was found using multimodal neuroimaging
methods. It is of note that the posterior shift of functional areas
associated with basic auditory perception in the right auditory
cortex of AP possessors was detectable via MEG and fMRI
(leading to relatively decreased activations in anterior HG and
higher activation in the posterior HG and PT in AP subjects).
Importantly, AP-speci
fic HG volume difference and functional
right auditory cortex augmentation was not only found at a
Figure 5. Multisensory and right-dominant network in AP perception. BOLD activations after auditory stimulation are rendered onto the normalized brain surface of the subject with the highest AP score (LH: left hemisphere, RH: right hemisphere). Fixed effects separate subjects analyses (P < 0.001, Bonferroni corrected) are shown in (a) non-AP and (b) AP musicians as well as in the (c) group contrast map. (d) Random effects analysis using the AP score as a covariate. Superior temporal gyrus (STG), Heschl’s Gyrus (HG), planum temporale (PT), temporo-parietal junction (TPJ), secondary somatosensory cortex (S2), primary motor cortex (M1), lateral prefrontal cortex (LPFC), ventral premotor cortex (vPMC), dorsal premotor cortex (dPMC).
group analysis level but is present in every single AP subject
correlating with AP pro
ficiency.
Previously
signi
ficant structure–function relationships
between volume and lateralization of auditory cortex and
auditory behavior have been described in musicians with
spectral versus holistic sound perception preference (
Schnei-der et al. 2005
), patients suffering from tinnitus (
Schneider
et al. 2009
), and individuals with the genetic disorder
Wil-liams syndrome (
Wengenroth et al. 2010
) or
language-learning abilities (
Wong et al. 2008
). Speci
fically, we
pre-viously demonstrated that musicians with relatively enlarged
right lateral HG were generally spectral listeners (i.e.,
predo-minantly perceiving the spectral components of complex
tones), whereas a dominant left lateral HG was associated
with holistic sound perception (i.e., prevailing perception of
the fundamental tone) (
Schneider et al. 2005
;
Schneider and
Wengenroth 2009
). In the present study, experimental groups
were speci
fically matched for this parameter (Materials and
Methods section); thus, the rightward HG asymmetry in the
AP group cannot simply be explained by predominant
spec-tral sound perception properties. Whether volume increase in
right HG is a consequence of AP acquisition or an innate (i.e.
genetically determined) anatomical feature remains an
unre-solved question at this stage.
Alterations of auditory evoked
fields, in particular
amplifi-cation of the P2 component or the N1
–P2 complex, have been
reported in response to acoustical, musical, and speech
train-ing in children and adults (
Tremblay et al. 2001
;
Shahin et al.
Table 2 AP network
TAL coordinates t
(a) fMRI contrast: AP vs. non-AP
Right anterior HG 61/−9/6 −9.84
Left anterior HG −52/−14/8 −7.03
Right PT 63/−36/18 12.99
Left PT −60/−29/5 6.76
Right somatosensory area (S2) 63/−23/21 9.93
Left S2 −60/−23/21 7.72
Right IFG 57/16/21 7.16
Left IFG (“Broca”) −51/14/24 8.81
Right lateral prefrontal cortex 29/59/18 7.22
Right PMC 43/2/45 8.35
Left PMC −39/−5/48 6.70
Right superior parietal lobule 34/−46/51 7.39
Left superior parietal lobule −45/−48/41 6.94
Right middle temporal gyrus 52/−60/11 7.45
CMA 2/19/43 6.80
SMA 4/−3/65 7.47
(b) fMRI regression: AP score r
Right PT 61/−38/18 0.63
Right LPFC 29/64/21 0.59
Right S2 62/−27/21 0.58
Right lingual gyrus 25/−92/−6 0.56
Right PMC 39/0/42 0.52
Left cerebellum −23/−53/−30 0.59
Left IFG (Broca) −61/18/17 0.59
Left dorsolateral prefrontal cortex −34/20/54 0.52
Note: (a) fMRI contrast map AP versus non-AP. All regions with increased activation in the tone versus baseline condition with t value >6.5 and >150 voxels cluster size are listed. (b) fMRI regression analysis with AP score as covariate. t values (Bonferroni corrected. P < 0.001), r values (P < 0.012; cluster level correction). Anatomical coordinates of the averaged centers of gravity per region are given in Talairach space.
Figure 6. FMRI-based functional connectivity of right HG and PT. (a) Individual localization of the fMRI center of gravity of right-hemispheric HG (green) and PT (red) coordinates in non-AP musicians and AP musicians. (b and c) Probability maps of fMRI-based instantaneous functional connectivity based on individual seed regions of right HG (green, b) and right PT (red, c). Individual FDR correction. P < 0.01; probability maps with consistency >70% are superimposed on the averaged brain of all non-AP and AP subjects, respectively.
2003
,
2004
,
2005
;
Trainor et al. 2003
;
Bosnyak et al. 2004
;
Kuriki et al. 2006
), re
flecting neuroplastic changes on the
functional level, even in a short-term context. Hence, it might
be conceivable that morphology of the auditory cortex (e.g.,
volume and lateralization) is an innate parameter that
deter-mines potential auditory capacity; whereas the waveform of
the N1
–P2 complex reflects a dynamic trait susceptible to
neu-roplastic changes depending on actual employment (e.g.,
training). This hypothesis is in line with the observation that
AP
“acquisition” is rare in nonmusicians and can furthermore
only be trained in few musicians. It might also shed some
light into the discussion of the
“critical time window” for AP
development, since early musical training appears to be
ben-e
ficial but not sufficient for the development of AP perception
(
Takeuchi and Hulse 1993
;
Barlaloo et al. 1998
;
Miyazaki
et al. 2012
).
Considering the enormous interindividual variability of
auditory cortex morphology, we believe that individual data
analysis will be an important element for the disentanglement
of auditory phenomena in humans. There are, however, a
number of unresolved issues complicating this line of
re-search and limiting the conclusions to be drawn from the
present study: the scarce temporal resolution of fMRI, the
dif-ficulty of functionally discerning the primary and secondary
auditory cortex, or the inde
finite posterior cranial border of
PT, to name just a few. For example, the
finding of a “reduced
right PT
” in AP might in fact result from the conventional
defi-nition of the posterior border of PT that has been applied in
this study to allow for comparison with previous works (
Ra-demacher et al. 2001
;
Penhune et al. 2003
;
Wong et al. 2008
).
However, the anatomical PT border has not been associated
with a functional correlate as yet, and it is conceivable that in
AP subjects, the actual PT expands further cranially to the
TPJ, which would be missed out using conventional
morpho-metry techniques.
Recruitment of a Right-Dominant Multisensory
Network in AP
Compared with nonmusicians, auditory stimulation evokes
activity in a number of originally nonauditory regions in
mu-sicians
’ brains, such as the DLFC including Broca’s motor
speech area, the TPJ, and other parietal regions, as well as
PMC and SMA (
Zatorre et al. 1998
;
Baumann et al. 2005
;
Bangert et al. 2006
;
Schulze et al. 2009
). This distributed
musicianship-related network is thought to underlie the
ex-ceptional capacities of multisensory and sensorimotor
inte-gration pertinent to the musician
’s brain, although the
speci
fic roles of the different network components and their
interplay in auditory perception are only partially understood
as of yet (
Zatorre et al. 2007
). The PMC was implicated in
direct and indirect sensorimotor transformations as well as
auditory imagery (
Zatorre et al. 2007
), the inferior parietal
lobule (IPL) in short-term storage of auditory information
(
Rauschecker and Scott 2009
;
Schulze et al. 2009
), and the
DLFC in conditional association aspects of pitch memory and
labeling (
Zatorre et al. 1998
;
Bermudez and Zatorre 2005a
,
2005b
;
Johnson et al. 2007
;
Bermudez and Zatorre 2009
). The
gateway to these parieto-frontal areas appears to be the PT
(or TPJ, or IPL, depending on the authors) which transmits
and integrates auditory information arriving from the HG via
the dorsal auditory stream (
Grif
fiths and Warren 2002
;
Warren
et al. 2005
;
Zatorre et al. 2007
;
Brancucci et al. 2008
;
Rauschecker and Scott 2009
). It is still an open question
whether AP perception depends on a distinct neural network
or a particular mechanism of cortical computation. Our
results suggest that during passive listening, AP musicians use
the same bilateral brain areas as non-AP musicians but recruit
more the right side of the network, which may be in part a
mere consequence of their anatomically and functionally
dominant right HG. The only brain area that is recruited
pre-dominantly on the left side is Broca
’s area in IFG, at the
pos-terior caudal bank of DLFC which has been previously
associated with pitch memory and labeling aspects of AP
(
Zatorre et al. 1998
;
Zatorre 2003
;
Bermudez and Zatorre
2005a
,
2005b
;
Levitin and Rogers 2005
;
Bangert et al. 2006
).
Small differences in activation localization between our study
and the aforementioned are readily explained by the fact that
we used a passive listening and not a pitch-naming task.
Of further note is the implication of the parietal operculum,
location of secondary somatosensory cortex (S2), found in
our study. This area has not received much attention in the
neuroscience of music
field so far, possibly because it was
subsumed in sensorimotor activity in previous neuroimaging
studies (
Zatorre et al. 2007
;
Altenmuller 2008
;
Chen et al.
2008
). Its contribution to the network is consistent with the
idea of enhanced multisensory and sensorimotor integration
in musicians, since also kinesthetic and proprioceptive
aware-ness is relevant to musical performance.
Integration of Basic AP Perception and Pitch Labeling
An appealing idea is that pitch perception relies on a
referen-cing process of incoming auditory signals with a prestored
template, which could be based on an absolute scale in AP
musicians versus a relative, for example, interval scale in RP
(or non-) musicians (
Levitin and Rogers 2005
). The exact site
of pitch template encoding neurons has not been identi
fied
yet, though it is likely that they are located in primary or
sec-ondary auditory areas in the temporal lobe. In accordance
with the ideas of
Zatorre (2003)
, a possible (simpli
fied)
scen-ario would be to break down the AP ability into a 2-step
process, whereby the
first step encompasses the
(precogni-tive) perceptual and the second step the (cogni(precogni-tive) labeling
aspects. Incoming auditory information is processed in
primary and some of the secondary auditory areas to generate
an organized output signal toward the PT. Considering the
highly signi
ficant anatomical and functional dominance of the
right auditory cortex in AP musicians found in this study, we
speculate that the referencing process with the postulated AP
template might take place in the right STG. Then the signal
already encoding the AP information leads to coactivation of
parieto-frontal regions where it engages a process of
musician-ship
—but not necessarily AP-specific multisensory integration—
and feeds back to the PT. The pitch labeling part, however,
takes place in the DLFC and Broca
’s area in the left hemisphere.
Author Contributions
M.W. and M.B. corresponded equally to the work. Study
design, data acquisition, data analysis and interpretation, and
writing of the manuscript: M.W., M.B., P.S. Providing tools
and methodology for data acquisition and data analysis: A.H.,
J.R., E.H., C.S. All authors discussed the results and
impli-cations and commented on the manuscript.
Supplementary Material
Supplementary material can be found at: http://www.cercor. oxfordjournals.org/.
Notes
The authors thank Doris Geller (Mannheim University of Music, Germany) for her contributions to the development of the AP test and Thomas T. G. Hahn (Central Institute of Mental Health, Mannheim, Germany) for critically reading the manuscript. M.B. was supported by the Olympia-Morata Program of the Heidelberg Medical Faculty. Conflict of Interest: None declared.
References
Altenmuller E. 2008. Neurology of musical performance. Clin Med. 8:410–413.
Altenmuller E, Schurmann K, Lim VK, Parlitz D. 2002. Hits to the left, flops to the right: different emotions during listening to music are reflected in cortical lateralisation patterns. Neuropsychologia. 40:2242–2256.
Altenmuller EO. 2001. How many music centers are in the brain? Ann N Y Acad Sci. 930:273–280.
Athos EA, Levinson B, Kistler A, Zemansky J, Bostrom A, Freimer N, Gitschier J. 2007. Dichotomy and perceptual distortions in absol-ute pitch ability. Proc Natl Acad Sci U S A. 104:14795–14800. Baharloo S, Johnston PA, Service SK, Gitschier J, Freimer NB. 1998.
Absolute pitch: an approach for identification of genetic and non-genetic components. Am J Hum Genet. 62:224–231.
Baharloo S, Service SK, Risch N, Gitschier J, Freimer NB. 2000. Familial aggregation of absolute pitch. Am J Hum Genet. 67:755–758.
Bangert M, Peschel T, Schlaug G, Rotte M, Drescher D, Hinrichs H, Heinze HJ, Altenmuller E. 2006. Shared networks for auditory and motor processing in professional pianists: evidence from fMRI conjunction. Neuroimage. 30:917–926.
Baumann S, Koeneke S, Meyer M, Lutz K, Jancke L. 2005. A network for sensory–motor integration: what happens in the auditory cortex during piano playing without acoustic feedback? Ann N Y Acad Sci. 1060:186–188.
Bermudez P, Lerch JP, Evans AC, Zatorre RJ. 2009. Neuroanatomical correlates of musicianship as revealed by cortical thickness and voxel-based morphometry. Cereb Cortex. 19:1583–1596.
Bermudez P, Zatorre RJ. 2005a. Conditional associative memory for musical stimuli in nonmusicians: implications for absolute pitch. J Neurosci. 25:7718–7723.
Bermudez P, Zatorre RJ. 2005b. Differences in gray matter between musicians and nonmusicians. Ann N Y Acad Sci. 1060:395–399. Bermudez P, Zatorre RJ. 2009. The absolute pitch mind continues to
reveal itself. J biol. 8:75.
Blatow M, Nennig E, Durst A, Sartor K, Stippich C. 2007. fMRI reflects functional connectivity of human somatosensory cortex. Neuro-image. 37:927–936.
Bosnyak DJ, Eaton RA, Roberts LE. 2004. Distributed auditory cortical representations are modified when non-musicians are trained at pitch discrimination with 40 Hz amplitude modulated tones. Cereb Cortex. 14:1088–1099.
Brancucci A, Penna SD, Babiloni C, Vecchio F, Capotosto P, Rossi D, Franciotti R, Torquati K, Pizzella V, Rossini PM et al. 2008. Neuro-magnetic functional coupling during dichotic listening of speech sounds. Hum Brain Mapp. 29:253–264.
Chen JL, Penhune VB, Zatorre RJ. 2008. Moving on time: brain network for auditory-motor synchronization is modulated by rhythm com-plexity and musical training. Cogn Neurosci. 20:226–239.
Devlin JT et al. 2003. Functional asymmetry for auditory processing in human primary auditory cortex. J Neurosci. 23:11516–11522.
Gaab N, Schulze K, Ozdemir E, Schlaug G. 2006. Neural correlates of absolute pitch differ between blind and sighted musicians. Neu-roreport. 17:1853–1857.
Galuske RA, Schlote W, Bratzke H, Singer W. 2000. Interhemispheric asymmetries of the modular structure in human temporal cortex. Science. 289:1946–1949.
Gaser C, Schlaug G. 2003. Gray matter differences between musicians and nonmusicians. Ann N Y Acad Sci. 999:514–517.
Geschwind N, Levitsky W. 1968. Human brain: left-right asymmetries in temporal speech region. Science. 161:186–187.
Gordon EE. 1998. Introduction to research and psychology of music. Chicago (IL): GIA.
Gregersen PK, Kowalsky E, Kohn N, Marvin EW. 1999. Absolute pitch: prevalence, ethnic variation, and estimation of the genetic component. Am J Hum Genet. 65:911–913.
Gregersen PK, Kowalsky E, Kohn N, Marvin EW. 2001. Early childhood music education and predisposition to absolute pitch: teasing apart genes and environment. Am J Med Genet. 98:280–282.
Griffiths TD, Warren JD. 2002. The planum temporale as a compu-tational hub. Trends Neurosci. 25:348–353.
Halpern AR, Zatorre RJ. 1999. When that tune runs through your head: a PET investigation of auditory imagery for familiar melo-dies. Cereb Cortex. 9:697–704.
Johnson JA, Strafella AP, Zatorre RJ. 2007. The role of the dorsolateral prefrontal cortex in bimodal divided attention: two transcranial magnetic stimulation studies. J Cogn Neurosci. 19:907–920. Keenan JP, Thangaraj V, Halpern AR, Schlaug G. 2001. Absolute pitch
and planum temporale. Neuroimage. 14:1402–1408.
Kuriki S, Kanda S, Hirata Y. 2006. Effects of musical experience on different components of MEG responses elicited by sequential piano-tones and chords. J Neurosci. 26:4046–4053.
Levitin DJ, Rogers SE. 2005. Absolute pitch: perception, coding, and controversies. Trends Cogn Sci. 9:26–33.
Loui P, Li HC, Hohmann A, Schlaug G. 2010. Enhanced cortical con-nectivity in absolute pitch musicians: a model for local hypercon-nectivity. J Cogn Neurosci. 23:1015–1026.
Luders E, Gaser C, Jancke L, Schlaug G. 2004. A voxel-based approach to gray matter asymmetries. Neuroimage. 22:656–664.
Miyazaki K. 1992. Perception of musical intervals by absolute pitch possessors. Music Percept. 9:413–426.
Miyazaki K, Makomaska S, Rakowski A. 2012. Prevalence of absolute pitch: a comparison between Japanese and Polish music students. J Acoust Soc Am. 132:3484–3493.
Munte TF, Altenmuller E, Jancke L. 2002. The musician’s brain as a model of neuroplasticity. Nat Rev Neurosci. 3:473–478.
Oechslin MS, Imfeld A, Loenneker T, Meyer M, Jancke L. 2009. The plasticity of the superior longitudinal fasciculus as a function of musical expertise: a diffusion tensor imaging study. Front Hum Neurosci. 3:76.
Oechslin MS, Meyer M, Jancke L. 2010. Absolute pitch—functional evidence of speech-relevant auditory acuity. Cereb Cortex. 20:447–455.
Ohnishi T, Matsuda H, Asada T, Aruga M, Hirakata M, Nishikawa M, Katoh A, Imabayashi E. 2001. Functional anatomy of musical per-ception in musicians. Cereb Cortex. 11:754–760.
Pantev C, Oostenveld R, Engelien A, Ross B, Roberts LE, Hoke M. 1998. Increased auditory cortical representation in musicians. Nature. 392:811–814.
Penhune VB, Cismaru R, Dorsaint-Pierre R, Petitto LA, Zatorre RJ. 2003. The morphometry of auditory cortex in the congenitally deaf measured using MRI. Neuroimage. 20:1215–1225.
Rademacher J, Morosan P, Schormann T, Schleicher A, Werner C, Freund HJ, Zilles K. 2001. Probabilistic mapping and volume measurement of human primary auditory cortex. Neuroimage. 13:669–683.
Rauschecker JP, Scott SK. 2009. Maps and streams in the auditory cortex: nonhuman primates illuminate human speech processing. Nat Neurosci. 12:718–724.
Roebroeck A, Formisano E, Goebel R. 2005. Mapping directed in flu-ence over the brain using Granger causality and fMRI. Neuro-image. 25:230–242.
Rosenkranz K, Williamon A, Rothwell JC. 2007. Motorcortical excit-ability and synaptic plasticity is enhanced in professional musi-cians. J Neurosci. 27:5200–5206.
Schlaug G, Jancke L, Huang Y, Steinmetz H. 1995. In vivo evidence of structural brain asymmetry in musicians. Science. 267:699–701. Schneider P, Scherg M, Dosch HG, Specht HJ, Gutschalk A, Rupp A.
2002. Morphology of Heschl’s gyrus reflects enhanced activation in the auditory cortex of musicians. Nat Neurosci. 5:688–694.
Schneider P, Andermann M, Wengenroth M, Goebel R, Flor H, Rupp A, Diesch E. 2009. Reduced volume of Heschl’s gyrus in tinnitus. Neuroimage. 45:927–939.
Schneider P, Sluming V, Roberts N, Scherg M, Goebel R, Specht HJ, Dosch HG, Bleeck S, Stippich C, Rupp A. 2005. Structural and functional asymmetry of lateral Heschl’s gyrus reflects pitch perception preference. Nat Neurosci. 8:1241–1247.
Schneider P, Wengenroth M. 2009. Neural basis of individual holistic and spectral sound perception. Contemp Mus Rev. 28:315–328. Schulze K, Gaab N, Schlaug G. 2009. Perceiving pitch absolutely:
comparing absolute and relative pitch possessors in a pitch memory task. BMC Neurosci. 10:106.
Shahin A, Bosnyak DJ, Trainor LJ, Roberts LE. 2003. Enhancement of neuroplastic P2 and N1c auditory evoked potentials in musicians. J Neurosci. 23:5545–5552.
Shahin A, Roberts LE, Pantev C, Trainor LJ, Ross B. 2005. Modulation of P2 auditory-evoked responses by the spectral complexity of musical sounds. Neuroreport. 16:1781–1785.
Shahin A, Roberts LE, Trainor LJ. 2004. Enhancement of auditory cor-tical development by musical experience in children. Neuroreport. 15:1917–1921.
Sluming V, Barrick T, Howard M, Cezayirli E, Mayes A, Roberts N. 2002. Voxel-based morphometry reveals increased gray matter density in Broca’s area in male symphony orchestra musicians. Neuroimage. 17:1613–1622.
Steinmetz H. 1996. Structure, functional and cerebral asymmetry: in vivo morphometry of the planum temporale. Neurosci Biobehav Rev. 20:587–591.
Takeuchi AH, Hulse SH. 1993. Absolute pitch. Psychol Bull. 113:345–361.
Talairach J, Tournoux P. 1988: Co-planar stereotactic atlas of the human brain: 3-dimensional proportional system: an approach to cerebral imaging. Stuttgart (Germany): Thieme.
Theusch E, Basu A, Gitschier J. 2009. Genome-wide study of families with absolute pitch reveals linkage to 8q24.21 and locus hetero-geneity. Am J Hum Genet. 85:112–119.
Trainor LJ, Shahin A, Roberts LE. 2003. Effects of musical training on the auditory cortex in children. Ann N Y Acad Sci. 999:506–513.
Tremblay K, Kraus N, McGee T, Ponton C, Otis B. 2001. Central audi-tory plasticity: changes in the N1-P2 complex after speech-sound training. Ear Hear. 22:79–90.
Warren JE, Wise RJ, Warren JD. 2005. Sounds do-able: auditory-motor transformations and the posterior temporal plane. Trends Neuro-sci. 28:636–643.
Wengenroth M, Blatow M, Bendszus M, Schneider P. 2010. Leftward lateralization of auditory cortex underlies holistic sound percep-tion in Williams syndrome. PLoS One. 5:e12326.
Westbury CF, Zatorre RJ, Evans AC. 1999. Quantifying variability in the planum temporale: a probability map. Cereb Cortex. 9:392–405.
Wilson SJ, Lusher D, Wan CY, Dudgeon P, Reutens DC. 2009. The neurocognitive components of pitch processing: insights from absolute pitch. Cereb Cortex. 19:724–732.
Wong PC, Warrier CM, Penhune VB, Roy AK, Sadehh A, Parrish TB, Zatorre RJ. 2008. Volume of left Heschl’s Gyrus and linguistic pitch learning. Cereb Cortex. 18:828–836.
Zatorre RJ. 2003. Absolute pitch: a model for understanding the in flu-ence of genes and development on neural and cognitive function. Nat Neurosci. 6:692–695.
Zatorre RJ. 1989. Intact absolute pitch ability after left temporal lo-bectomy. Cortex. 25:567–580.
Zatorre RJ, Chen JL, Penhune VB. 2007. When the brain plays music: auditory-motor interactions in music perception and production. Nat Rev Neurosci. 8:547–558.
Zatorre RJ, Perry DW, Beckett CA, Westbury CF, Evans AC. 1998. Functional anatomy of musical processing in listeners with absolute pitch and relative pitch. Proc Natl Acad Sci U S A. 95:3172–3177.