Publisher’s version / Version de l'éditeur: ASTM STP, 1451, pp. 97-118, 2003-12-01
READ THESE TERMS AND CONDITIONS CAREFULLY BEFORE USING THIS WEBSITE.
https://nrc-publications.canada.ca/eng/copyright
Vous avez des questions? Nous pouvons vous aider. Pour communiquer directement avec un auteur, consultez la
première page de la revue dans laquelle son article a été publié afin de trouver ses coordonnées. Si vous n’arrivez pas à les repérer, communiquez avec nous à [email protected].
Questions? Contact the NRC Publications Archive team at
[email protected]. If you wish to email the authors directly, please see the first page of the publication for their contact information.
NRC Publications Archive
Archives des publications du CNRC
This publication could be one of several versions: author’s original, accepted manuscript or the publisher’s version. / La version de cette publication peut être l’une des suivantes : la version prépublication de l’auteur, la version acceptée du manuscrit ou la version de l’éditeur.
Access and use of this website and the material on it are subject to the Terms and Conditions set forth at Durability and cold temperature performance of SBS-modified bituminous roofing membranes
Liu, K. K. Y.; Xu, G.; Voyer, R.
https://publications-cnrc.canada.ca/fra/droits
L’accès à ce site Web et l’utilisation de son contenu sont assujettis aux conditions présentées dans le site LISEZ CES CONDITIONS ATTENTIVEMENT AVANT D’UTILISER CE SITE WEB.
NRC Publications Record / Notice d'Archives des publications de CNRC: https://nrc-publications.canada.ca/eng/view/object/?id=76091e34-2417-49c5-ab1d-bd57785e429e https://publications-cnrc.canada.ca/fra/voir/objet/?id=76091e34-2417-49c5-ab1d-bd57785e429e
Durability and cold temperature performance of SBS-modified bituminous roofing membranes
Liu, K.; Xu, G.; Voyer, R.
NRCC-47025
A version of this document is published in / Une version de ce document se trouve dans : Roofing Research and Standards Development; Fifth Symposium,
ASTM STP 1451, Tampa, Florida, Dec. 7, 2003, pp. 97-118
Karen Liu,1 Guodong Xu,2 and Richard Voyer3
Durability and Cold Temperature Performance of
SBS-Modified Bituminous Roofing Membranes
REFERENCE: Liu, K., Xu, G., and Voyer, R., “Durability and Cold Temperature Performance of SBS-Modified Bituminous Roofing Membranes,” Roofing Research and
Standards Development: 5th Volume, ASTM STP 1451, W. J. Rossiter and T. J. Wallace., Eds.,
ASTM International, West Conshohocken, PA, 2003.
ABSTRACT: The National Research Council of Canada, in collaboration with a Canadian roofing manufacturer, conducted an experimental program to evaluate the durability of SBS-modified bituminous roofing membranes in Canada. This study examined the effect of heat aging on the mechanical and chemical properties of nine commercially available SBS-modified
membranes, with emphasis on cold temperature performance. These membranes varied in reinforcements and densities, and were selected to be representative of SBS-modified membranes currently used in Canada. The membrane samples were heat aged in convection ovens at 70±3°C for six months. During this process, some samples were withdrawn at two-month intervals and their tensile properties at 23°C and -30°C, cold flex temperature and glass transition temperature determined. The results confirmed that heat aging mainly affected matrix-controlled properties of the membranes. In addition, the reinforcement controlled the mechanical properties at 23°C but the modified bitumen governed the failure mechanism at
–30°C for the polyester reinforced membranes.
KEYWORDS: SBS, modified bituminous membrane, durability, tensile, strength, elongation, strain energy, low temperature flexibility, cold flex temperature, glass transition temperature, failure mechanism, low temperature, cold weather
Introduction
There is nowhere in Canada where the January design temperature is above freezing [1]. Because of our cold weather, it is important that roofing membranes perform well at low temperature. Roofing membranes should remain flexible at low temperature to resist stresses experienced on the roofs. Most single-ply roofing membranes are formulated with plasticizers to enhance low temperature flexibility. Polymer modifiers such as styrene-butadiene-styrene (SBS) are added to bitumen to improve elongation and
flexibility. SBS-modified bituminous membranes are commonly used in Canada because of their low temperature performance.
1
Research Officer, National Research Council, 1200 Montreal Road, Ottawa, ON, K1A 0R6.
2
Industrial Research Fellow, National Research Council, 1200 Montreal Road, Ottawa, ON, K1A 0R6.
3
Research Director, Soprema Inc., 1675 Rue Haggerty, Drummondville, Quebec, J2C 5P7.
Accelerated weathering is often performed on roof membranes to accelerate the effects of natural weathering. Although changes in physical and chemical properties due to accelerated weathering might not directly correlate to those occurring naturally, nevertheless, accelerated weathering using techniques such as heat aging, QUV and Xenon-arc provides useful information in evaluating the durability of roof membranes. Heat aging is probably the most commonly used accelerated weathering technique in
studying durability of roofing membranes as it can be easily performed in the laboratory. Heat aging has been reported to be effective in evaluating the performance of modified bituminous membrane [2] and simulating the effects of natural aging [3]. Aging of bitumen is believed to be a combination of the migration of the light volatile components and the chemical changes produced by the effects of oxygen, energy and water [4]. The heat aging process intensifies the chemical changes by increasing the rates of chemical reactions involved in the aging process and thus simulates at a faster rate the aging mechanisms which occur naturally.
Puterman et al. [5] measured the tensile properties, the cold flex temperature and the water-pressure resistance of various types of roofing membrane which were naturally exposed under normal service conditions. Data on the SBS- and APP-modified membranes showed that the exposure hardly affected the properties determined by the reinforcement but had a strong effect on the properties that are governed by the
bitumen/polymer material. In particular, they reported that the cold flex temperature of a SBS-modified bituminous membrane increased by about 12°C after five years of natural exposure but the tensile strength and elongation were hardly affected. The data also showed that SBS-modified membranes retained better low-temperature flexibility than the APP-modified membranes, after comparable periods of exposure under similar service conditions.
Baxter et al. [6] showed that the tensile strength of five SBS-modified bituminous membranes increased and the cold flex temperature of two SBS-modified bituminous membranes rose by about 15°C, after heat aging at 80°C for 28 days. Rodriguez et al. [7] studied the effects of heat aging and test temperature on the tensile strength and
elongation of two APP-modified and two SBS-modified bituminous membranes. For the two SBS-modified membranes, heat aging (80°C for 168 days) did not significantly affect the tensile strength at 23°C but it reduced the elongation by 20-40%. However, heat aging reduced the tensile strength of these membranes at –30°C by about 20% and increased the elongation by about 60-330%. They also found that the glass transition temperature of these membranes increased by 4 – 8°C.
This study systematically examined the durability of nine SBS-modified bituminous roofing membranes by heat aging. The primary objective was to quantify the effects of heat aging on the physical and mechanical properties of these membranes, with particular emphasis on the cold temperature performance. The membranes were selected to be representative of SBS-modified currently used in Canada; therefore, the data reflects the current status of SBS-modified membranes in Canada. A secondary objective was to gain a better fundamental understanding of the failure mechanism of SBS-modified membranes at low temperature, which is important in improving membrane performance for cold weather applications.
Experimental Method
Materials and Heat Aging
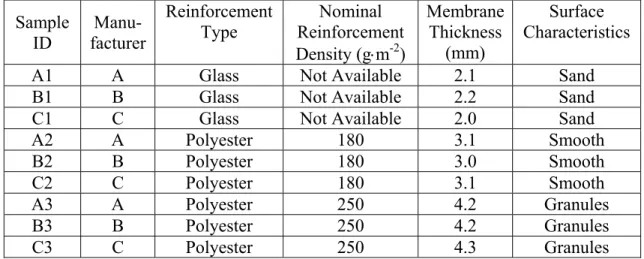
Nine commercially available SBS-modified bituminous roofing membrane samples were used in this study. Three rolls were obtained from each of three manufacturers (A, B and C) through normal distribution channels. From the three rolls, one roll was
reinforced with random short glass fiber mat and the other two with a non-woven polyester mat of two different nominal reinforcement densities (180 g⋅m-2 and 250 g⋅m-2
). The top surface of the membranes reinforced with the 180 g⋅m-2
mat was smooth but that of the membranes reinforced with the 250 g⋅m-2
mat was covered with granules. The glass fiber reinforced membrane was covered with a thin layer of sand. Table 1 provides a summary of the samples used in this study.
Samples were randomly selected, cut from the rolls and placed in convection ovens at 70±3°C for six months. During this process, some of the samples were withdrawn at two-month intervals (i.e. 0, 2, 4 and 6 months) for physical and mechanical tests.
Table 1 – Description of the SBS-modified bituminous membranes used in this study.
Sample ID Manu-facturer Reinforcement Type Nominal Reinforcement Density (g⋅m-2 ) Membrane Thickness (mm) Surface Characteristics
A1 A Glass Not Available 2.1 Sand
B1 B Glass Not Available 2.2 Sand
C1 C Glass Not Available 2.0 Sand
A2 A Polyester 180 3.1 Smooth B2 B Polyester 180 3.0 Smooth C2 C Polyester 180 3.1 Smooth A3 A Polyester 250 4.2 Granules B3 B Polyester 250 4.2 Granules C3 C Polyester 250 4.3 Granules Testing
Tensile Properties - The tensile properties were measured according to
CGSB-37.56M Modified Bituminous Membranes for Roofing [8]. The specimens (25 mm X 150 mm) were cut from the membrane samples, in both machine (MD) and cross-machine (XD) directions, using a rectangular die in a hydraulic press. They were tested using an Instron 4502 Automated Materials Testing System connected to a computer for data recording. The grip distance was 75 mm. A minimum of five specimens was tested at each condition. The breaking strength, the elongation at break and the strain energy to ultimate elongation were measured (definitions of these parameters are described in the CGSB-37.56M standard).
For the room temperature tests, the specimens were placed in the hydraulic grips and pulled at a constant crosshead speed of 50 mm⋅min-1
. A 1-kN load cell was used to monitor the applied load. For the tests performed at –30°C, the specimens were pre-cooled at –30°C in a laboratory freezer overnight. An Instron environmental chamber with liquid nitrogen cooling was used to maintain the cold temperature of the specimens during testing. The specimens were pulled at a constant crosshead speed of 10 mm⋅min-1
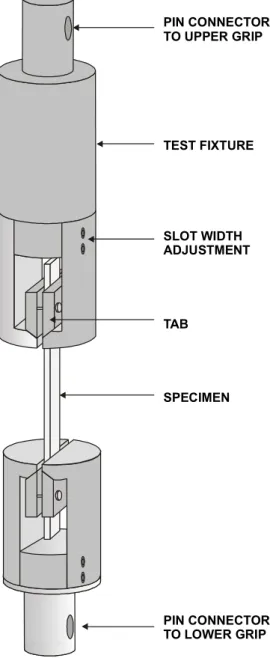
. A 10-kN load cell was used to monitor the applied load. Because hydraulic grips could not be used at the low temperatures, the specimen ends were sandwiched between a pair of specially designed tabs that could be tightened with two screws. This specimen-tab assembly was slid into an accompanying fixture (Figure 1) which was mounted in the
testing machine. The specimens were allowed to equilibrate in the environmental chamber at –30°C for at least 5 minutes before testing.
PIN CONNECTOR TO UPPER GRIP TEST FIXTURE SLOT WIDTH ADJUSTMENT PIN CONNECTOR TO LOWER GRIP SPECIMEN TAB
Figure 1 – Loading assembly for tensile tests at cold temperatures.
Low Temperature Flexibility - The low temperature flexibility was determined
according to ASTM D 5147-97 Standard Test Methods for Sampling and Testing
Modified Bituminous Sheet Material. The specimens (25 mm X 150 mm) were cut from the membrane samples, in both machine (MD) and cross-machine (XD) directions, using a rectangular die in a hydraulic press. A minimum of five specimens was cut from each of the control and heat-aged membranes in both MD and XD directions. The specimens and the mandrel (25 mm in diameter) were allowed to equilibrate in an upright freezer, at
the test temperature, for three hours before testing. The specimen was bent 180±5° around the mandrel at the test temperature in 2 ± 1 s. If a crack was observed in any of the five specimens, the test temperature was increased by 3°C; however, if no crack was observed in any of the specimens, the test temperature was decreased by 3°C. The specimens and the mandrel were allowed to equilibrate for another 30 minutes after the freezer reached the new test temperature before the next round of testing. The test temperature was adjusted until the lowest temperature at which none of the specimens showed any visual signs of cracking was determined, and this temperature was recorded as the cold flex temperature (TCF).
Glass Transition Temperature - The glass transition temperature of the samples was
measured according to the ASTM D6382-99 Standard Practice for Dynamic Mechanical Analysis and Thermogravimetry of Roofing and Waterproofing Membrane Material and D5418-99 Standard Test Method for Plastics: Dynamic Mechanical Properties: in Flexure (Dual Cantilever Beam) using a dynamic mechanical thermal analyzer Rheometrics Scientific Solids Analyzer RSA II. The control and heat-aged membranes were cut in the machine direction (3 mm X 37 mm) and tested in the dual cantilever mode. The granules on the top surface of the membranes were removed as much as possible. A fixed
oscillation frequency of 1 Hz and a heating rate of 2°C⋅min-1
in the range of –80°C to 30°C were used. The instrument measured the storage modulus (E') and the loss modulus (E") of the specimen. The glass transition temperature was obtained for the maximum in the loss modulus (E") versus temperature curve. At least two specimens were tested for each sample.
Results and Discussion
Tensile Properties
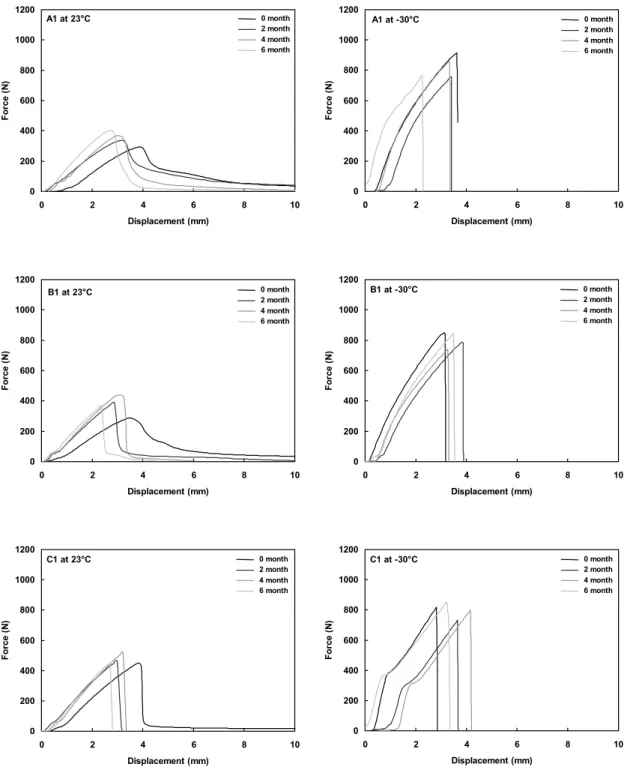
Force-Displacement Curves - Typical force-displacement curves recorded by the
Instron testing machine are shown in Figures 2a, 3a and 4a. For the glass fiber reinforced membranes (A1, B1 and C1), the specimens generally failed abruptly in the elastic region with a single crack (Figure 2a). For Sample A1 tested at 23°C, the bituminous matrix was flexible and stretched a great deal after the reinforcement was broken. However, the bituminous matrix lost this flexibility at –30 °C and the specimen failed with a clean single crack. There was a distinct “knee” on the force-displacement curve of Sample C1 tested at –30°C where the modulus (slope of the curve) changed. This could be due to the change in modulus at matrix yield (more significant at low temperature) or change in reinforcement structure (e.g. fiber sliding).
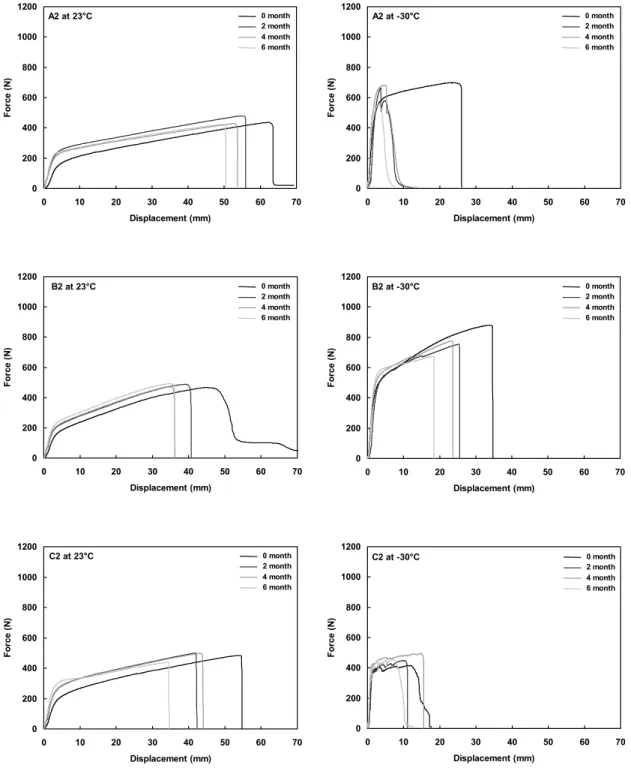
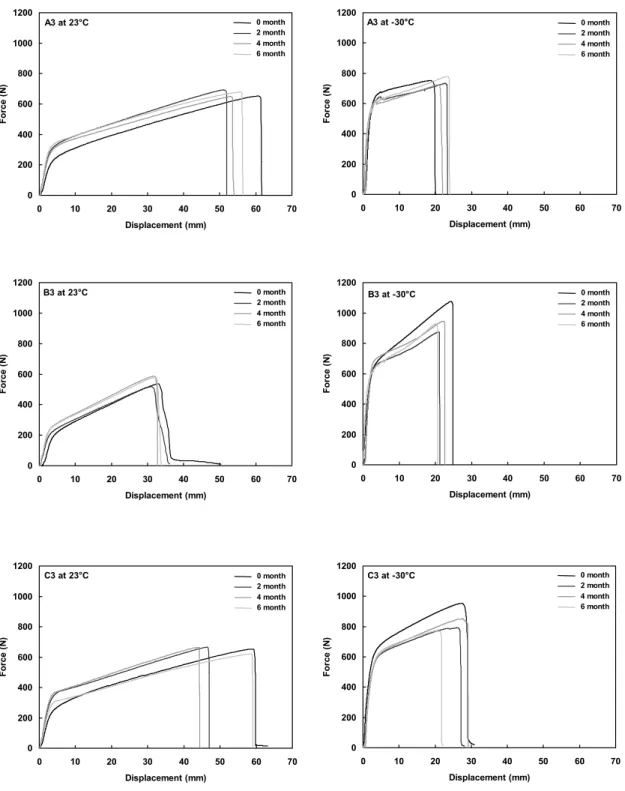
The polyester reinforced membranes had much higher elongation at break than those reinforced with glass fiber due to the high elongation characteristics of the polymeric reinforcement (Figures 3a and 4a). The membrane behaved in an elastic-plastic manner with a change in modulus at the yield point, at both 23°C and –30°C. Heat aging did not affect the maximum tensile strength but it decreased the elongation considerably at 23°C. All membranes reinforced at 250 g⋅m-2
(A3, B3 and C3) failed with a single crack but some of those reinforced at 180 g⋅m-2
(A2, B2 and C2) did not. The control of Sample A2 failed with a single crack at -30°C after being extended to 25 mm but the heat-aged specimens failed after extending to only about 5 mm. Several small cracks were
0 200 400 600 800 1000 1200 0 2 4 6 8 Displacement (mm) For ce ( N ) 0 month 2 month 4 month 6 month A1 at 23°C 10 0 200 400 600 800 1000 1200 0 2 4 6 8 Displacement (mm) Fo rc e ( N ) A1 at -30°C 0 month 2 month 4 month 6 month 10 0 200 400 600 800 1000 1200 0 2 4 6 8 Displacement (mm) For ce ( N ) B1 at 23°C 0 month 2 month 4 month 6 month 10 0 200 400 600 800 1000 1200 0 2 4 6 8 Displacement (mm) For ce ( N ) B1 at -30°C 0 month 2 month 4 month 6 month 10 0 200 400 600 800 1000 1200 0 2 4 6 8 Displacement (mm) F o rce ( N ) C1 at 23°C 0 month 2 month 4 month 6 month 10 0 200 400 600 800 1000 1200 0 2 4 6 8 Displacement (mm) For ce ( N ) C1 at -30°C 0 month 2 month 4 month 6 month 10
Figure 2a – Typical tensile force-displacement curves of SBS-modified membranes (reinforced with random short glass fiber mat).
0 10 20 30 40 50 A1-MD A1-XD B1-MD B1-XD C1-MD C1-XD Sample ID B reaki ng S tr e ngt h ( k N /m ) T = 23°C 0 10 20 30 40 50 A1-MD A1-XD B1-MD B1-XD C1-MD C1-XD Sample ID B reaki ng S tr e ngt h ( k N /m ) T = -30°C 0 1 2 3 4 5 A1-MD A1-XD B1-MD B1-XD C1-MD C1-XD Sample ID E longat ion at B reak ( % ) T = -30°C 0 1 2 3 4 5 A1-MD A1-XD B1-MD B1-XD C1-MD C1-XD Sample ID E longat ion at B reak ( % ) T = 23°C 0 0.2 0.4 0.6 0.8 1 A1-MD A1-XD B1-MD B1-XD C1-MD C1-XD Sample ID St ra in En e rg y ( k N /m ) T = -30°C 0 0.2 0.4 0.6 0.8 1 A1-MD A1-XD B1-MD B1-XD C1-MD C1-XD Sample ID St ra in En e rg y ( k N /m ) T = 23°C
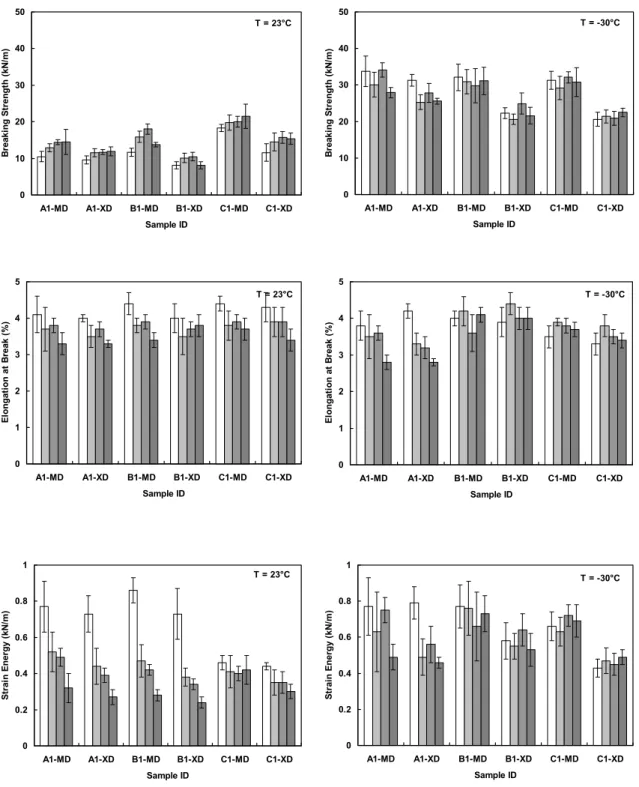
Figure 2b – Effects of heat aging on the tensile properties of SBS-modified membranes (reinforced with random short glass fiber mat).
0 200 400 600 800 1000 1200 0 10 20 30 40 50 60 70 Displacement (mm) For ce ( N ) A2 at 23°C 0 month 2 month 4 month 6 month 0 200 400 600 800 1000 1200 0 10 20 30 40 50 60 70 Displacement (mm) For ce ( N ) A2 at -30°C 0 month 2 month 4 month 6 month 0 200 400 600 800 1000 1200 0 10 20 30 40 50 60 70 Displacement (mm) For ce ( N ) B2 at 23°C 0 month 2 month 4 month 6 month 0 200 400 600 800 1000 1200 0 10 20 30 40 50 60 70 Displacement (mm) For ce ( N ) B2 at -30°C 0 month 2 month 4 month 6 month 0 200 400 600 800 1000 1200 0 10 20 30 40 50 60 70 Displacement (mm) For ce ( N ) C2 at 23°C 0 month 2 month 4 month 6 month 0 200 400 600 800 1000 1200 0 10 20 30 40 50 60 70 Displacement (mm) For ce ( N ) C2 at -30°C 0 month 2 month 4 month 6 month
Figure 3a – Typical tensile force-displacement curves of SBS-modified membranes
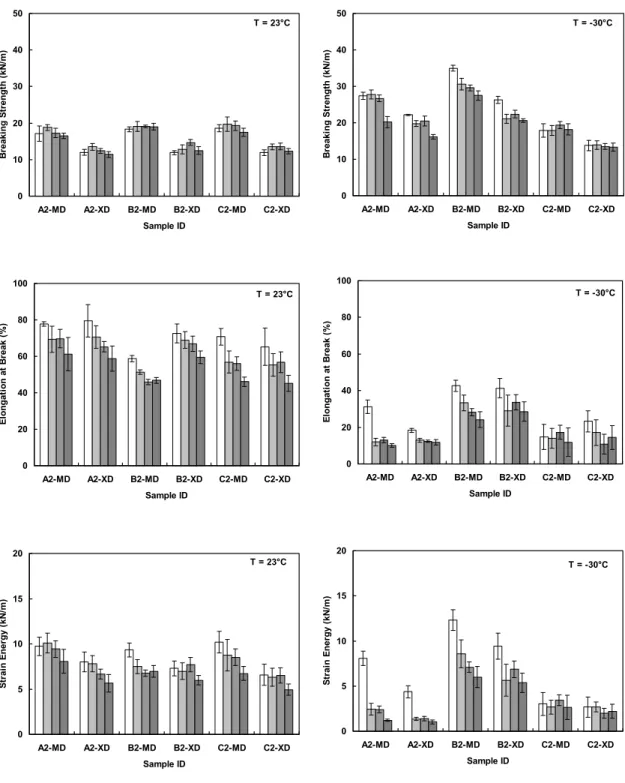
0 10 20 30 40 50 A2-MD A2-XD B2-MD B2-XD C2-MD C2-XD Sample ID B reaki ng S tr e ngt h ( k N /m ) T = 23°C 0 10 20 30 40 50 A2-MD A2-XD B2-MD B2-XD C2-MD C2-XD Sample ID B reaki ng S tr e ngt h ( k N /m ) T = -30°C 0 20 40 60 80 100 A2-MD A2-XD B2-MD B2-XD C2-MD C2-XD Sample ID E longat ion at B reak ( % ) T = -30°C 0 20 40 60 80 100 A2-MD A2-XD B2-MD B2-XD C2-MD C2-XD Sample ID E longat ion at B reak ( % ) T = 23°C 0 5 10 15 20 A2-MD A2-XD B2-MD B2-XD C2-MD C2-XD Sample ID St ra in En e rg y ( k N /m ) T = -30°C 0 5 10 15 20 A2-MD A2-XD B2-MD B2-XD C2-MD C2-XD Sample ID St ra in En e rg y ( k N /m ) T = 23°C
Figure 3b – Effects of heat aging on the tensile properties of SBS-modified membranes
0 200 400 600 800 1000 1200 0 10 20 30 40 50 60 70 Displacement (mm) For ce ( N ) A3 at 23°C 0 month 2 month 4 month 6 month 0 200 400 600 800 1000 1200 0 10 20 30 40 50 60 70 Displacement (mm) For ce ( N ) A3 at -30°C 0 month 2 month 4 month 6 month 0 200 400 600 800 1000 1200 0 10 20 30 40 50 60 70 Displacement (mm) For ce ( N ) B3 at 23°C 0 month 2 month 4 month 6 month 0 200 400 600 800 1000 1200 0 10 20 30 40 50 60 70 Displacement (mm) For ce ( N ) B3 at -30°C 0 month 2 month 4 month 6 month 0 200 400 600 800 1000 1200 0 10 20 30 40 50 60 70 Displacement (mm) For ce ( N ) C3 at 23°C 0 month 2 month 4 month 6 month 0 200 400 600 800 1000 1200 0 10 20 30 40 50 60 70 Displacement (mm) For ce ( N ) C3 at -30°C 0 month 2 month 4 month 6 month
Figure 4a – Typical tensile force-displacement curves of SBS-modified membranes
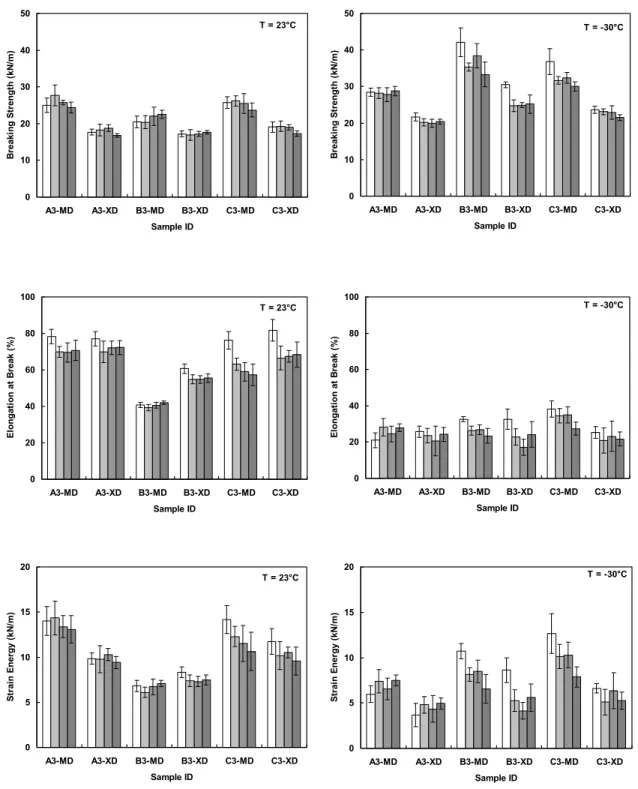
0 10 20 30 40 50 A3-MD A3-XD B3-MD B3-XD C3-MD C3-XD Sample ID B reaki ng S tr e ngt h ( k N /m ) T = 23°C 0 10 20 30 40 50 A3-MD A3-XD B3-MD B3-XD C3-MD C3-XD Sample ID B reaki ng S tr e ngt h ( k N /m ) T = -30°C 0 20 40 60 80 100 A3-MD A3-XD B3-MD B3-XD C3-MD C3-XD Sample ID E longat ion at B reak ( % ) T = 23°C 0 20 40 60 80 100 A3-MD A3-XD B3-MD B3-XD C3-MD C3-XD Sample ID E longat ion at B reak ( % ) T = -30°C 0 5 10 15 20 A3-MD A3-XD B3-MD B3-XD C3-MD C3-XD Sample ID St ra in En e rg y ( k N /m ) T = 23°C 0 5 10 15 20 A3-MD A3-XD B3-MD B3-XD C3-MD C3-XD Sample ID St ra in En e rg y ( k N /m ) T = -30°C
Figure 4b – Effects of heat aging on the tensile properties of SBS-modified membranes
observed to form on the heat-aged bituminous matrix of Sample A2 at –30°C before it fractured. For Sample C2, multiple small cracks were observed to form and grow on the bituminous matrix, and final fracture occurred at one of the larger cracks.
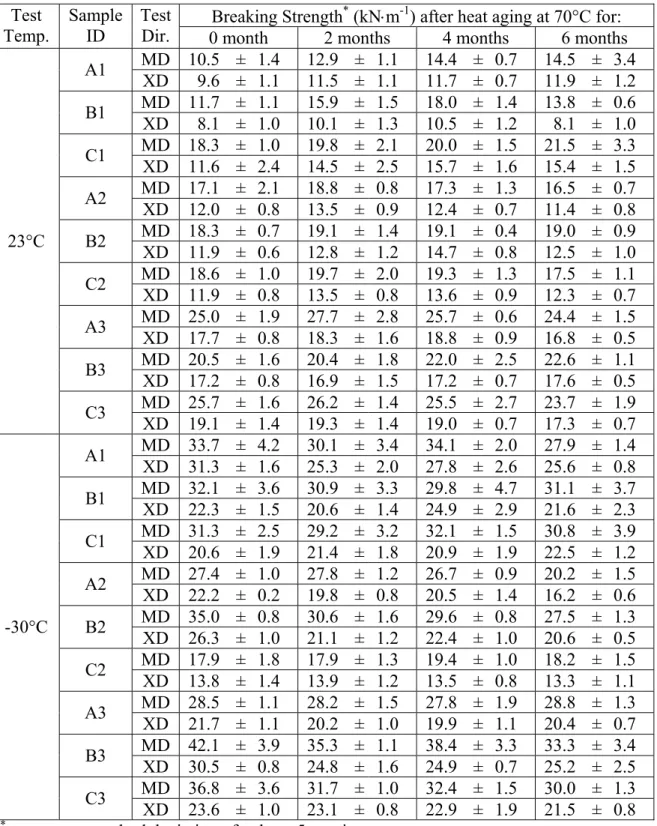
Effect of Heat Aging - The tensile properties of the membranes at different test
temperatures and aging periods are summarized in Tables 2-4 and Figures 2b, 3b and 4b. The values reported are the average and standard deviation of at least five specimens. For the glass fiber reinforced membranes (A1, B1 and C1), heat aging did not affect the breaking strength but reduced the elongation at break and the strain energy slightly (Figure 2b). Samples A1 was affected most by the heat aging: its strain energy dropped by about 60% at 23°C and 40% at –30°C. Sample C1 was least affected.
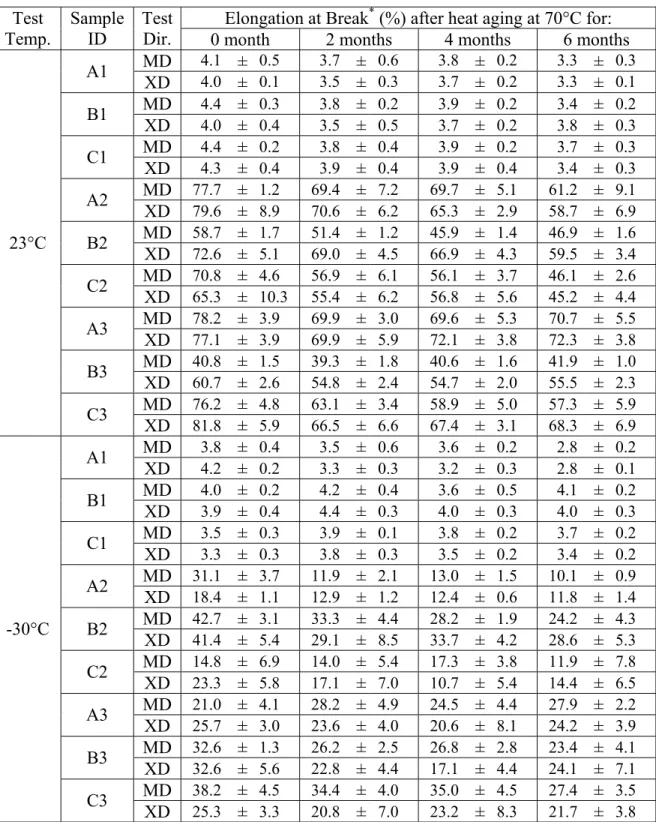
For the polyester reinforced membranes (A2, B2, C2, A3, B3 and C3), heat aging did not affect the breaking strength of the membranes at 23°C but it reduced the elongation at break by as much as 35% (Figures 3b and 4b). The reduction in elongation was more severe in the membranes containing less reinforcement: 20 to 35% for the 180 g⋅m-2
compared to 0 to 25% for the 250 g⋅m-2
over six months of heat aging. Because of the reduced elongation, the strain energy was also decreased accordingly (15-35% for the 180 g⋅m-2 and 0-25% for the 250 g⋅m-2
over six months). Note that the elongation at break and strain energy of Sample A2 at –30°C was reduced significantly after heat aging due to the change in failure mode as shown by the force-displacement curves.
The effects of heat aging (reduction in elongation and strain energy) were generally more prominent at –30°C. This is because the matrix shared a larger portion of the load at low temperature and governed the elongation of the membrane at low temperature, and heat aging mainly affected matrix-controlled properties (this will be discussed in the next section). As with the 23°C data, the reduction in elongation was more pronounced in the membranes containing less reinforcement (20-70% for the 180 g⋅m-2
and 0-30% for the 250 g⋅m-2
over six months). It is interesting to note that, within experimental errors, the tensile properties (strength, elongation and strain energy) of Sample A3 were hardly affected by six months of heat aging, indicating its stability.
Effects of Temperature on Failure Mechanism - A roofing membrane is a composite
material with a multi-layer structure in which a reinforcement is embedded in a matrix. The reinforcement bears the load and the matrix binds the reinforcement together and allows stress transfer between the two components. For example, with the polyester reinforced membranes in this study, the non-woven polyester mat is the reinforcement and the modified bitumen is the matrix. The failure of the membrane can be described by the mechanics of composite materials. Rule of Mixture (ROM) describes the strength of a composite material with aligned, continuous fibers [9] in the direction along the fibers:
σc = (Vf⋅Ef + Vm⋅Em) εc (1)
where
σc = composite stress (N⋅m-2)
Ef = fiber modulus (N⋅m-2)
Em = matrix modulus (N⋅m-2)
Vf = fiber volume fraction (dimensionless)
Vm = matrix volume fraction (dimensionless)
Table 2 – Effects of heat aging on the tensile breaking strength.
Breaking Strength* (kN⋅m-1) after heat aging at 70°C for: Test
Temp.
Sample ID
Test
Dir. 0 month 2 months 4 months 6 months
MD 10.5 ± 1.4 12.9 ± 1.1 14.4 ± 0.7 14.5 ± 3.4 A1 XD 9.6 ± 1.1 11.5 ± 1.1 11.7 ± 0.7 11.9 ± 1.2 MD 11.7 ± 1.1 15.9 ± 1.5 18.0 ± 1.4 13.8 ± 0.6 B1 XD 8.1 ± 1.0 10.1 ± 1.3 10.5 ± 1.2 8.1 ± 1.0 MD 18.3 ± 1.0 19.8 ± 2.1 20.0 ± 1.5 21.5 ± 3.3 C1 XD 11.6 ± 2.4 14.5 ± 2.5 15.7 ± 1.6 15.4 ± 1.5 MD 17.1 ± 2.1 18.8 ± 0.8 17.3 ± 1.3 16.5 ± 0.7 A2 XD 12.0 ± 0.8 13.5 ± 0.9 12.4 ± 0.7 11.4 ± 0.8 MD 18.3 ± 0.7 19.1 ± 1.4 19.1 ± 0.4 19.0 ± 0.9 B2 XD 11.9 ± 0.6 12.8 ± 1.2 14.7 ± 0.8 12.5 ± 1.0 MD 18.6 ± 1.0 19.7 ± 2.0 19.3 ± 1.3 17.5 ± 1.1 C2 XD 11.9 ± 0.8 13.5 ± 0.8 13.6 ± 0.9 12.3 ± 0.7 MD 25.0 ± 1.9 27.7 ± 2.8 25.7 ± 0.6 24.4 ± 1.5 A3 XD 17.7 ± 0.8 18.3 ± 1.6 18.8 ± 0.9 16.8 ± 0.5 MD 20.5 ± 1.6 20.4 ± 1.8 22.0 ± 2.5 22.6 ± 1.1 B3 XD 17.2 ± 0.8 16.9 ± 1.5 17.2 ± 0.7 17.6 ± 0.5 MD 25.7 ± 1.6 26.2 ± 1.4 25.5 ± 2.7 23.7 ± 1.9 23°C C3 XD 19.1 ± 1.4 19.3 ± 1.4 19.0 ± 0.7 17.3 ± 0.7 MD 33.7 ± 4.2 30.1 ± 3.4 34.1 ± 2.0 27.9 ± 1.4 A1 XD 31.3 ± 1.6 25.3 ± 2.0 27.8 ± 2.6 25.6 ± 0.8 MD 32.1 ± 3.6 30.9 ± 3.3 29.8 ± 4.7 31.1 ± 3.7 B1 XD 22.3 ± 1.5 20.6 ± 1.4 24.9 ± 2.9 21.6 ± 2.3 MD 31.3 ± 2.5 29.2 ± 3.2 32.1 ± 1.5 30.8 ± 3.9 C1 XD 20.6 ± 1.9 21.4 ± 1.8 20.9 ± 1.9 22.5 ± 1.2 MD 27.4 ± 1.0 27.8 ± 1.2 26.7 ± 0.9 20.2 ± 1.5 A2 XD 22.2 ± 0.2 19.8 ± 0.8 20.5 ± 1.4 16.2 ± 0.6 MD 35.0 ± 0.8 30.6 ± 1.6 29.6 ± 0.8 27.5 ± 1.3 B2 XD 26.3 ± 1.0 21.1 ± 1.2 22.4 ± 1.0 20.6 ± 0.5 MD 17.9 ± 1.8 17.9 ± 1.3 19.4 ± 1.0 18.2 ± 1.5 C2 XD 13.8 ± 1.4 13.9 ± 1.2 13.5 ± 0.8 13.3 ± 1.1 MD 28.5 ± 1.1 28.2 ± 1.5 27.8 ± 1.9 28.8 ± 1.3 A3 XD 21.7 ± 1.1 20.2 ± 1.0 19.9 ± 1.1 20.4 ± 0.7 MD 42.1 ± 3.9 35.3 ± 1.1 38.4 ± 3.3 33.3 ± 3.4 B3 XD 30.5 ± 0.8 24.8 ± 1.6 24.9 ± 0.7 25.2 ± 2.5 MD 36.8 ± 3.6 31.7 ± 1.0 32.4 ± 1.5 30.0 ± 1.3 -30°C C3 XD 23.6 ± 1.0 23.1 ± 0.8 22.9 ± 1.9 21.5 ± 0.8 *
Table 3 – Effects of heat aging on the tensile elongation at break.
Elongation at Break* (%) after heat aging at 70°C for: Test
Temp.
Sample ID
Test
Dir. 0 month 2 months 4 months 6 months
MD 4.1 ± 0.5 3.7 ± 0.6 3.8 ± 0.2 3.3 ± 0.3 A1 XD 4.0 ± 0.1 3.5 ± 0.3 3.7 ± 0.2 3.3 ± 0.1 MD 4.4 ± 0.3 3.8 ± 0.2 3.9 ± 0.2 3.4 ± 0.2 B1 XD 4.0 ± 0.4 3.5 ± 0.5 3.7 ± 0.2 3.8 ± 0.3 MD 4.4 ± 0.2 3.8 ± 0.4 3.9 ± 0.2 3.7 ± 0.3 C1 XD 4.3 ± 0.4 3.9 ± 0.4 3.9 ± 0.4 3.4 ± 0.3 MD 77.7 ± 1.2 69.4 ± 7.2 69.7 ± 5.1 61.2 ± 9.1 A2 XD 79.6 ± 8.9 70.6 ± 6.2 65.3 ± 2.9 58.7 ± 6.9 MD 58.7 ± 1.7 51.4 ± 1.2 45.9 ± 1.4 46.9 ± 1.6 B2 XD 72.6 ± 5.1 69.0 ± 4.5 66.9 ± 4.3 59.5 ± 3.4 MD 70.8 ± 4.6 56.9 ± 6.1 56.1 ± 3.7 46.1 ± 2.6 C2 XD 65.3 ± 10.3 55.4 ± 6.2 56.8 ± 5.6 45.2 ± 4.4 MD 78.2 ± 3.9 69.9 ± 3.0 69.6 ± 5.3 70.7 ± 5.5 A3 XD 77.1 ± 3.9 69.9 ± 5.9 72.1 ± 3.8 72.3 ± 3.8 MD 40.8 ± 1.5 39.3 ± 1.8 40.6 ± 1.6 41.9 ± 1.0 B3 XD 60.7 ± 2.6 54.8 ± 2.4 54.7 ± 2.0 55.5 ± 2.3 MD 76.2 ± 4.8 63.1 ± 3.4 58.9 ± 5.0 57.3 ± 5.9 23°C C3 XD 81.8 ± 5.9 66.5 ± 6.6 67.4 ± 3.1 68.3 ± 6.9 MD 3.8 ± 0.4 3.5 ± 0.6 3.6 ± 0.2 2.8 ± 0.2 A1 XD 4.2 ± 0.2 3.3 ± 0.3 3.2 ± 0.3 2.8 ± 0.1 MD 4.0 ± 0.2 4.2 ± 0.4 3.6 ± 0.5 4.1 ± 0.2 B1 XD 3.9 ± 0.4 4.4 ± 0.3 4.0 ± 0.3 4.0 ± 0.3 MD 3.5 ± 0.3 3.9 ± 0.1 3.8 ± 0.2 3.7 ± 0.2 C1 XD 3.3 ± 0.3 3.8 ± 0.3 3.5 ± 0.2 3.4 ± 0.2 MD 31.1 ± 3.7 11.9 ± 2.1 13.0 ± 1.5 10.1 ± 0.9 A2 XD 18.4 ± 1.1 12.9 ± 1.2 12.4 ± 0.6 11.8 ± 1.4 MD 42.7 ± 3.1 33.3 ± 4.4 28.2 ± 1.9 24.2 ± 4.3 B2 XD 41.4 ± 5.4 29.1 ± 8.5 33.7 ± 4.2 28.6 ± 5.3 MD 14.8 ± 6.9 14.0 ± 5.4 17.3 ± 3.8 11.9 ± 7.8 C2 XD 23.3 ± 5.8 17.1 ± 7.0 10.7 ± 5.4 14.4 ± 6.5 MD 21.0 ± 4.1 28.2 ± 4.9 24.5 ± 4.4 27.9 ± 2.2 A3 XD 25.7 ± 3.0 23.6 ± 4.0 20.6 ± 8.1 24.2 ± 3.9 MD 32.6 ± 1.3 26.2 ± 2.5 26.8 ± 2.8 23.4 ± 4.1 B3 XD 32.6 ± 5.6 22.8 ± 4.4 17.1 ± 4.4 24.1 ± 7.1 MD 38.2 ± 4.5 34.4 ± 4.0 35.0 ± 4.5 27.4 ± 3.5 -30°C C3 XD 25.3 ± 3.3 20.8 ± 7.0 23.2 ± 8.3 21.7 ± 3.8 *
Table 4 – Effects of heat aging on the tensile strain energy.
Strain Energy* (kN⋅m-1) after heat aging at 70°C for: Test
Temp.
Sample ID
Test
Dir. 0 month 2 months 4 months 6 months
MD 0.77 ± 0.14 0.52 ± 0.11 0.49 ± 0.05 0.32 ± 0.08 A1 XD 0.73 ± 0.10 0.44 ± 0.10 0.39 ± 0.04 0.27 ± 0.04 MD 0.86 ± 0.07 0.47 ± 0.09 0.42 ± 0.03 0.28 ± 0.03 B1 XD 0.73 ± 0.14 0.38 ± 0.05 0.34 ± 0.03 0.24 ± 0.03 MD 0.46 ± 0.04 0.41 ± 0.09 0.40 ± 0.04 0.42 ± 0.08 C1 XD 0.44 ± 0.02 0.35 ± 0.07 0.35 ± 0.06 0.30 ± 0.04 MD 9.73 ± 1.02 10.10 ± 1.08 9.43 ± 0.91 8.08 ± 1.30 A2 XD 8.01 ± 1.10 7.83 ± 0.89 6.68 ± 0.54 5.67 ± 0.97 MD 9.33 ± 0.76 7.50 ± 0.78 6.76 ± 0.35 6.98 ± 0.65 B2 XD 7.29 ± 0.81 6.98 ± 0.93 7.72 ± 0.80 5.98 ± 0.52 MD 10.21 ± 1.19 8.76 ± 1.73 8.53 ± 0.93 6.74 ± 0.76 C2 XD 6.58 ± 1.17 6.30 ± 0.99 6.52 ± 0.84 4.95 ± 0.62 MD 14.00 ± 1.59 14.34 ± 1.87 13.39 ± 1.23 13.07 ± 1.52 A3 XD 9.85 ± 0.63 9.77 ± 1.49 10.29 ± 0.68 9.41 ± 0.67 MD 6.81 ± 0.61 6.10 ± 0.58 6.72 ± 0.86 7.09 ± 0.35 B3 XD 8.33 ± 0.62 7.39 ± 0.64 7.30 ± 0.56 7.48 ± 0.55 MD 14.17 ± 1.54 12.28 ± 1.13 11.53 ± 1.99 10.64 ± 2.11 23°C C3 XD 11.73 ± 1.42 10.16 ± 1.54 10.54 ± 0.60 9.58 ± 1.54 MD 0.77 ± 0.16 0.63 ± 0.22 0.75 ± 0.07 0.49 ± 0.07 A1 XD 0.79 ± 0.09 0.49 ± 0.10 0.56 ± 0.10 0.46 ± 0.03 MD 0.77 ± 0.12 0.76 ± 0.15 0.66 ± 0.19 0.73 ± 0.10 B1 XD 0.58 ± 0.10 0.55 ± 0.07 0.64 ± 0.09 0.53 ± 0.09 MD 0.66 ± 0.08 0.63 ± 0.08 0.72 ± 0.06 0.69 ± 0.09 C1 XD 0.43 ± 0.05 0.47 ± 0.07 0.45 ± 0.06 0.49 ± 0.04 MD 8.07 ± 0.79 2.46 ± 0.64 2.41 ± 0.37 1.22 ± 0.11 A2 XD 4.37 ± 0.69 1.37 ± 0.16 1.39 ± 0.24 1.03 ± 0.24 MD 12.30 ± 1.15 8.57 ± 1.54 7.10 ± 0.57 6.00 ± 1.18 B2 XD 9.41 ± 1.44 5.66 ± 1.78 6.87 ± 0.92 5.37 ± 1.07 MD 3.02 ± 1.26 2.67 ± 0.77 3.43 ± 0.61 2.66 ± 1.35 C2 XD 2.67 ± 1.14 2.67 ± 0.55 1.99 ± 0.53 2.20 ± 0.77 MD 5.97 ± 0.92 7.40 ± 1.28 6.56 ± 1.18 7.50 ± 0.61 A3 XD 3.67 ± 1.30 4.79 ± 0.92 4.34 ± 1.48 4.94 ± 0.64 MD 10.71 ± 0.83 8.13 ± 0.76 8.51 ± 1.24 6.55 ± 1.61 B3 XD 8.63 ± 1.36 5.26 ± 1.20 4.14 ± 0.91 5.60 ± 1.51 MD 12.64 ± 2.18 10.12 ± 1.32 10.28 ± 1.41 7.87 ± 1.13 -30°C C3 XD 6.62 ± 0.54 5.09 ± 1.42 6.36 ± 1.97 5.24 ± 0.94 *
In commercial production, the fibers might not be aligned or continuous (e.g
randomly oriented short fiber mat) and the strength of the composite usually reaches only a fraction of the rule of mixture strength [10]. The Rule of Mixture can be modified by taking the fiber orientation and length into account:
σc = (χ1 χ2Vf⋅Ef + Vm⋅Em) εc (1a)
where
χ1 = fiber orientation factor (dimensionless)
χ2 = fiber length factor (dimensionless)
Both factors are less than or equal to unity.
χ
1 is less than one when the fibers arealigned at an angle to the loading axis, and becomes unity when all fibers are aligned to the loading axis. Similarly,
χ
2 is less than one when the fibers are short, and becomesunity when the fiber length is long and continuous (above the critical aspect ratio [9]). At 23°C, the modulus of the polyester reinforcement was much higher than that of the modified bitumen (i.e. Ef>>Em). Therefore, the polyester fibers bore most of the load
exerted on the membrane. The membrane failed when the polyester mat broke (i.e. εc=εfu). In this situation, equation (1a) becomes:
σcu = χ1 χ2Vf⋅σfu (2)
where
σcu = failure strength of composite (N⋅m-2)
εfu = failure strain of fiber (dimensionless)
σfu = failure strength of fiber (N⋅m-2)
Since the polyester mat governed the tensile properties of the membrane at 23°C, as described by equation (2), improvement of mechanical performance of the membrane at room temperature can be achieved by using good quality polyester fiber (high strength and elongation properties) and/or increasing the amount of reinforcement.
In the roofing industry, the strength of the membrane containing reinforcement is generally expressed in force per unit length (N⋅m-1
) because the membrane is always installed in plys. We can rewrite equation (2):
Scu = χ1 χ2af⋅σfu/ρf (2a)
where
Scu = membrane strength per unit length (N⋅m-1)
af = aeral reinforcement density (g⋅m-2)
ρf = volumetric reinforcement density (g⋅m-3)
Equation (2a) indicates that Scu is proportional to af, i.e., the strength of the membrane
increases with the amount of reinforcement given that the same type of reinforcement is used. The strength ratio of the membranes reinforced at 180 g⋅m-2and 250 g⋅m-2
of polyester mat were computed (i.e. strength of Sample A2 / strength of Sample A3) for each manufacturer (A, B and C) at both loading directions (MD and XD). The overall ratio was determined to be 0.74±0.08. This experimental value corresponded well with the theoretical strength ratio of 0.72 (180/250).
As the test temperature dropped, the modulus of the modified bitumen increased and the matrix began to carry an increasing proportion of the load exerted on the membrane (Vm⋅ Em⋅εc). Since the reinforcement and the matrix bore the load together, the strength
of the membrane at –30°C was higher than that at 23°C. However, the ultimate elongation of the matrix reduced greatly as the temperature dropped. When the matrix started to crack (i.e. εc=εmu<εfu), equation (1) becomes:
mu m m f f 2 1 c (χ χ V E V E )ε σ = + mu f mu f f 2 1 c Vσ ε | σ V χ χ σ = + (3) where mu f |ε
σ = fiber stress at matrix failure (N⋅m-2
) εmu = failure strain of matrix (dimensionless)
σmu = failure strength of matrix (N⋅m-2)
When the matrix fractures, the reinforcement suddenly has to bear the load
transferred from the matrix. If this stress (σc) in equation (3) is greater than the stress the
fibers can bear (Vf⋅σfu), the membrane fails; otherwise, the fiber will continue to bear the
load until the fibers break. Experimental evidence confirmed that cracks were observed in the matrix before the membrane fractured, i.e. εmu<εfu. From a waterproofing point of
view, the membrane should be considered as failed at this point as it is no longer watertight. Therefore, the matrix properties governed the performance of the polyester reinforced membranes at –30°C.
The difference in the force-displacement curves of the samples reinforced with 180 g⋅m-2
non-woven polyester mats (Samples A2, B2 and C2) tested at –30°C further illustrated the important role of modified bitumen in membranes at low temperatures. The shapes of the force-displacement curves were markedly different because of different failure mechanisms. Samples A2 and B2 failed from the formation of a few deep cracks and sudden failure of the reinforcing mat. On the other hand, Samples C2 failed from one of the larger cracks which initiated from the multiple shallow cracks. Since the samples were reinforced by similar mats and at the same reinforcing density, it is evident that the modified bitumen governed failure mechanisms of the membrane at this
temperature. Therefore, it is important to use modified bitumen with superior low temperature properties to achieve good low temperature performance in the membranes intended for cold weather use.
For the glass fiber reinforced membranes (A1, B1 and C1), the failure strain of the glass fiber reinforcement was lower than that of the bituminous matrix (i.e. εfu<εmu) at
both test temperatures. It is evident from the Figure 2a and Table 3 that the elongation at break was about 4% at both 23°C and –30°C, as the breaking strain of the glass mat is not expected to be affected by test temperature. Therefore, the reinforcement controlled the failure of the membrane (i.e. εc=εfu). Equation (1) becomes:
σcu = (χ1 χ2Vf⋅Ef + Vm⋅Em) εfu (4)
At 23°C, the modulus of the glass fiber reinforcement was much higher than the bituminous matrix (Ef>>Em). Therefore, equation (4) is reduced to equation (2). The
glass fibers bore most of the load exerted on the membrane and the membrane failed when the fiber broke.
However, as the test temperature dropped, the modulus of the modified bitumen increased and it began to carry an increasing proportion of the load exerted on the membrane (Vm⋅ Em⋅εc) so the strength of the membrane increased. This is similar to the
polyester reinforcement. However, although the ultimate elongation of the matrix was greatly decreased when the temperature dropped to –30°C, the failure strain of the glass fiber mat was still lower (i.e. εfu<εmu). This is evident from the fact that the elongation at
break of the membrane (strain at which the glass fiber mat broke) remained at 4% at both test temperatures. Therefore, equation (4) becomes:
fu m m fu f 2 1 c χ χ Vσ V σ |ε σ = + (4a) where fu m ε |
σ = matrix stress at fiber failure (N⋅m-2
)
Experimental observations showed that the tensile elongation of the glass fiber reinforced membranes at both test temperatures were controlled mainly by the glass fiber reinforcement. However, the matrix carried a significant proportion of the load at low temperature, i.e. Vm
fu m |ε
σ . To improve the strength of the membrane, one should focus on enhancing both the glass fiber reinforcement mat and the bituminous matrix. The reinforcement can be improved by increasing the fiber length (depending on the critical aspect ratio), rising the amount of reinforcement (Vf or af) or using a reinforcing cloth.
Bitumen with high modulus at low temperature can also help to improve the strength of the membrane.
Low Temperature Flexibility and Glass Transition Temperature
The glass transition temperature (Tg) of the nine SBS-modified bituminous samples is
shown in Table 5 and Figure 5. The lines in the figure were drawn to highlight the trends and do not have any statistical significance. The Tg of the control samples ranged from
–48°C to –37°C. After six months of heat aging, the Tg increased to –43°C to –34°C.
The change in Tg after six months of aging was less than +8°C. Although Sample C1 has
the highest increase in Tg of +8°C, its Tg after six months of heat aging was –40°C, which
Table 5 – Effects of heat aging on the glass transition temperature. Glass Transition Temperature* (°C) after heat aging at 70°C for: Sample
ID 0 month 2 months 4 months 6 months
A1 -40 -42 -37 -34 B1 -40 -43 -40 -38 C1 -48 -50 -45 -40 A2 -40 -43 -39 -35 B2 -42 -45 -43 -40 C2 -37 -40 -39 -39 A3 -45 -46 -42 -38 B3 -41 -39 -39 -37 C3 -46 -49 -47 -43 *
average of at least 2 specimens, measurement error is ±2°C
Bitumen has a glass transition temperature around –30°C [7]. The Tg (around –40°C)
of the nine samples confirmed that SBS was effective in improving flexibility of the bitumen at low temperature. The glass transition temperature is affected by many factors such as the chemical composition and structure, molecular weight and intermolecular interactions of the polymer. The small change in Tg showed that the chemical properties
of the SBS-modified bitumen in the samples did not seem to be significantly affected by heat aging. However, dynamic mechanical analysis might not pick up certain changes in molecular weight distribution in the modified bitumen. Gel Permeation Chromatography (GPC) analysis would provide such information and complement results from dynamic mechanical analysis. Analysis using GPC is recommended on the heat-aged samples in further study.
The cold flex temperature (TCF) of the nine SBS-modified bituminous samples is
shown in Table 6 and Figure 6. The TCF of all samples increased after heat aging, with
increases ranging from +3°C to +19°C. Most of the control samples had low TCF (below
–30°C) except for Samples A2 and C2. The TCF of Sample C2 increased from about –
10°C to -2°C (an average of –4°C in MD and +1°C in XD) – an increase of 8°C after six months of heat aging. The TCF of Sample A2 increased from about -27°C to –10°C after
six months of heat aging. This increase of 17°C was among the highest out of all samples tested.
Comparing Figures 5 and 6, TCF and Tg showed similar trends of membrane
flexibility with respect to heat aging although their actual values were quite different. TCF measures membrane flexibility on a macroscopic level - the resistance to crack
formation of the matrix under flexural load. Tg measures membrane flexibility on a
microscopic level – the change in loss modulus under flexural load. Since TCF and Tg
measure different parameters for flexibility, they are affected by different factors in the membranes. Therefore, it was anticipated that the data might not show a direct
correlation between TCF and Tg.
It should also be noted that the TCF of the two heat-aged samples, Samples C2 and
A2, were high (–2°C and –10°C for Samples C2 and A2, respectively) but their Tg
remained low (–39°C and –35°C for Samples C2 and A2, respectively). The cold flex temperature is affected by factors such as the thickness of the matrix, the chemical
composition/structure of the modified bitumen, the type and amount of filler (e.g. limestone), and the bond strength between the filler and the bitumen. One possible explanation is that these two samples contained either an inappropriate amount of filler or filler which was not compatible with the bituminous matrix (this is consistent with
observation that multiple shallow cracks were formed under tension at –30°C). The filler in the modified bitumen may reduce the TCF but does not affect the Tg.
A1-MD B1-MD C1-MD A1-XD B1-XD C1-XD -60 -50 -40 -30 -20 -10 0 10 0 1 2 3 4 5 6
Heat Aging (months)
C o ld F le x T e m p e rat u re ( °C ) -60 -50 -40 -30 -20 -10 0 10 0 1 2 3 4 5 6
Heat Aging (months)
G lass T ra n si ti o n T e m perat u re ( °C ) A1B1 C1 -60 -50 -40 -30 -20 -10 0 10 0 1 2 3 4 5 6
Heat Aging (months)
G lass T ra n si ti o n T e m perat u re ( °C ) A2B2 C2 -60 -50 -40 -30 -20 -10 0 10 0 1 2 3 4 5 6
Heat Aging (months)
C o ld F le x T e m p e rat u re ( °C ) A2-MD B2-MD C2-MD A2-XD B2-XD C2-XD -60 -50 -40 -30 -20 -10 0 10 0 1 2 3 4 5 6
Heat Aging (months)
C o ld F le x T e m p e rat u re ( °C ) A3-MD B3-MD C3-MD A3-XD B3-XD C3-XD -60 -50 -40 -30 -20 -10 0 10 0 1 2 3 4 5 6
Heat Aging (months)
G lass T ra n si ti o n T e m perat u re ( °C ) A3B3 C3
Figure 5 – Effects of heat aging on the
glass transition temperature of SBS-modified membranes.
Figure 6 – Effects of heat aging on the
cold flex temperature of SBS-modified membranes.
Table 6 – Effects of heat aging on the cold flex temperature.
Cold Flex Temperature (°C) after heat aging at 70°C for: Sample
ID
Test
Dir. 0 month 2 months 4 months 6 months
MD -34 -34 -27 -24 A1 XD -34 -37 -27 -24 MD -34 -40 -37 -27 B1 XD -34 -37 -37 -27 MD -52 -47 -30 -39 C1 XD -46 -43 -30 -33 MD -27 -24 -25 -10 A2 XD -27 -20 -20 -10 MD -34 -34 -30 -23 B2 XD -34 -34 -30 -23 MD -10 -7 -4 -4 C2 XD -10 -4 -1 +1 MD -30 -14 -17 -14 A3 XD -30 -14 -17 -14 MD -30 -27 -24 -14 B3 XD -30 -20 -20 -11 MD -30 -40 -30 -27 C3 XD -30 -30 -30 -24
Conclusions and Recommendations
1. Heat aging affected matrix-controlled properties such as elongation and strain energy but hardly affected the reinforcement-controlled properties such as breaking strength. 2. The heat aging effects on stress/strain was more pronounced at –30°C and in
membranes containing less reinforcement.
3. The glass fiber mat controlled the tensile strength of the membrane at 23°C but the matrix contributed a significant portion to the strength of the membrane at –30°C. The glass fiber mat controlled the tensile elongation of the membrane at both temperatures.
4. The polyester reinforcement controlled the tensile properties of the membrane at 23°C but the matrix properties governed the membrane performance at –30°C. 5. The low glass transition temperature (around –40°C) of the membranes before and
after heat aging indicated that the SBS-modified membranes were suitable for cold weather application and not affected significantly by heat aging.
6. The cold flex temperature of the membranes increased by 3°C to 19°C after six months of heat aging. The samples that had high cold flex temperature also
experienced high reduction in elongation after heat aging. This is a direct indicator of the changes in the bitumen matrix during aging.
7. Since heat aging affects matrix-controlled properties, which governs the membrane performance at low temperature, it is important to use high quality modified bitumen in order to manufacture durable membrane for cold weather application.
Acknowledgement
The authors gratefully acknowledge the assistance of H. Shen, J. Irwin and A. Delgado in conducting some of the laboratory testing, and the financial support of Soprema Inc. References
[1] National Research Council Canada, National Building Code of Canada, Appendix C, 1995.
[2] May, J. O., “Temperature profiles of different roof waterproofing systems subjected to natural exposure conditions,” Proceedings of the 2nd International Symposium
on Roofing Technology, pp. 80-85.
[3] Duchesne, C., “Durability of the SBS-modified bituminous double-layer system: correlation between performances after artificial and natural aging,” Proceedings
the 3rd International Symposium on Roofing Technology, pp. 222-226.
[4] Braun, E. and Hendriks, N., “Comparison of six different accelerated weathering tests on modified bitumen products,” Roofs and Roofing, Chapter 26, May, J.O. Ed., Ellis Horwood Ltd, England, 1988, pp. 315.
[5] Puterman, M. and Marton, M. “Evaluation of changes in roofing materials as a result of long-term exposure,” Proceedings the 4th International Symposium on Roofing
Technology, pp. 236-241.
[6] Baxter, R. and Kearney, T. “Weathering characteristics of polymer modified asphalt roofing membrane,” Proceedings the 3rd International Symposium on Roofing
Technology, pp. 453-458.
[7] Rodriguez, I., Dutt, O., Paroli, R.M. and Mailvaganam, N.P., “Effect of heat-aging on thermal and mechanical properties of APP- and SBS-modified bituminous roofing membranes,” Materials and Structures, Vol. 26, No. 160, pp. 355-361. [8] CGSB 37.56-M (9th draft), “Modified Bituminous Membranes for Roofing,”
Canadian General Standards Board, January 1997.
[9] Piggott, M.R., Load Bearing Fibre Composites, 2nd edition, MERP Enhanced Composites Inc., Toronto, 2001, p96, p169, pp. 157.
[10] Kardos, J.L., “Short-Fiber-Reinforced Polymeric Composites, Structure-Property Relations,” International Encyclopedia of Composites, Vol. 5, ed. Lee, S.M., VCH Publishers Inc., 1991, pp. 133.