HAL Id: hal-03088027
https://hal.archives-ouvertes.fr/hal-03088027
Preprint submitted on 24 Dec 2020
HAL is a multi-disciplinary open access archive for the deposit and dissemination of sci-entific research documents, whether they are pub-lished or not. The documents may come from teaching and research institutions in France or abroad, or from public or private research centers.
L’archive ouverte pluridisciplinaire HAL, est destinée au dépôt et à la diffusion de documents scientifiques de niveau recherche, publiés ou non, émanant des établissements d’enseignement et de recherche français ou étrangers, des laboratoires publics ou privés.
Julien Bous, Hélène Orcel, Nicolas Floquet, Cédric Leyrat, Josephine
Lai-Kee-Him, Gérald Gaibelet, Aurelie Ancelin, Julie Saint-Paul, Stefano
Trapani, Maxime Louet, et al.
To cite this version:
Julien Bous, Hélène Orcel, Nicolas Floquet, Cédric Leyrat, Josephine Lai-Kee-Him, et al.. Structure of the antidiuretic hormone vasopressin receptor signalling complex.. 2020. �hal-03088027�
Structure of the antidiuretic hormone vasopressin receptor signalling complex. 1
2
Julien Bous1,2, Hélène Orcel1, Nicolas Floquet3,4, Cédric Leyrat1,4, Joséphine Lai-Kee-Him2, 3
Gérald Gaibelet1,5, Aurélie Ancelin2,6, Julie Saint-Paul1,7, Stefano Trapani2, Maxime Louet3, 4
Rémy Sounier1, Hélène Déméné2, Sébastien Granier1*, Patrick Bron2* & Bernard 5 Mouillac1* 6 7 1Institut de Génomique Fonctionnelle, Université de Montpellier, CNRS, INSERM, 34094 8 Montpellier cedex 5, France 9
2Centre de Biochimie Structurale, Université de Montpellier, CNRS, INSERM, 34090 10
Montpellier, France 11
3Institut des Biomolécules Max Mousseron, Université de Montpellier, CNRS, 34093 12 Montpellier cedex 5, France 13 4these authors contributed equally 14 5present address: AB Science, 13288 Marseille cedex 9, France 15
6present address: Laboratoire CiTCoM, CNRS UMR8038, Faculté de Pharmacie, 16
Université Paris Descartes, 75006 Paris, France 17
7present address: iMAb, Institut de Recherche en Cancérologie de Montpellier, 34298, 18
Montpellier cedex 5, France 19
*to whom correspondence should be addressed: sebastien.granier@igf.cnrs.fr; 20
patrick.bron@cbs.cnrs.fr; bernard.mouillac@igf.cnrs.fr 21
22
Arginine-vasopressin (AVP) is a neurohypophysial peptide known as the 23
antidiuretic hormone. It forms an active signalling complex with the V2 receptor 24
(V2R) and the Gs protein, promoting a cAMP/PKA-dependent aquaporin insertion 25
in apical membranes of principal cells of the renal collecting ducts and ultimately, 1 water reabsorption. Molecular mechanisms underlying activation of this critical G 2 protein-coupled receptor (GPCR) signalling system are still unknown. To fill this 3 gap of knowledge, we report here the structure of the AVP-V2R-Gs complex using 4
cryo-electron microscopy (cryo-EM). Single-particle analysis revealed the 5
presence of three different states. The two best maps were combined with 6
computational and NMR spectroscopy constraints to reconstruct two structures of 7
the ternary complex. These structures differ in AVP and Gs binding modes and 8
could thus represent distinct complex conformations along the signalling 9
activation pathway. Importantly, as compared to those of other class A GPCR-Gs 10 complexes, the structures revealed an original receptor-Gs interface in which the 11 Gsα subunit penetrates deeper into the active V2R, notably forming an ionic bond 12 between its free C-terminal carboxylic function and the side chain of R137 in the 13
V2R. Interestingly, the structures help to explain how V2R R137H or R137L/C 14 variants can lead to two severe genetic diseases with opposite clinical outcomes, 15 cNDI or NSIAD respectively. Our study thus provides important structural insights 16 into the function of this clinically relevant GPCR signalling complex. 17 18
The biological actions of AVP, a cyclic nonapeptide, are mediated through three GPCR 19 subtypes, V1a, V1b and V21. In addition, AVP is able to activate the related oxytocin (OT) 20 receptor (OTR)2. The V2R is mainly expressed at the basolateral membrane of principal 21 cells of the kidney collecting ducts and governs the crucial physiological function of body 22
water homeostasis3. Binding of AVP to the V2R increases cAMP intracellular level via 23
coupling to the adenylyl cyclase stimulatory Gs protein, leading to activation of protein 24
kinase A, phosphorylation of aquaporin 2 water channels4 and, ultimately to water 25
reabsorption and urine concentration. Activation of the V2R also elicits arrestin-1
dependent pathways such as receptor internalization and MAP kinase phosphorylation 2
associated with cell growth and proliferation5,6. This GPCR is involved in many water 3
balance disorders (hyponatremia consecutive to congestive heart failure, hypertension 4
or hepatic cirrhosis) and voiding disorders (incontinence, nocturia), and as such 5
constitutes a major therapeutic target7. Moreover, inactivating and constitutively active 6
mutations in the V2R sequence are responsible for two rare X-linked genetic diseases 7
with opposite clinical outcomes: 1) congenital nephrogenic diabetes insipidus (cNDI) 8
characterized by excessive urine voiding8, 2) nephrogenic syndrome of inappropriate 9
antidiuresis (NSIAD) characterized by excessive water loading and hyponatremia9. V2R 10
is also a target for treating autosomal dominant polycystic kidney disease, the most 11
frequent Mendelian inherited disorder affecting millions of people worldwide10. This 12
pathology results from increased cell proliferation, apoptosis and dedifferentiation, in 13
which cAMP- and MAP kinase-dependent signaling pathways are highly activated. 14
The structural biology of GPCRs has made significant progress during the last decade 15
with a wealth of information on ligand binding and G protein coupling that shed light on 16
structural and dynamic aspects of their function11,12. Yet V2R like many GPCRs, has been 17
refractory to high-resolution structure determination. Cryo-EM has emerged as a 18
powerful method for the determination of challenging membrane protein structures13, 19
in particular when the intrinsic structural dynamics of the target prevents the use of 20
crystallogenesis. A growing list of GPCR-G protein complex structures has thus been 21
determined14,15, revealing key molecular mechanisms of agonist binding and G protein 22
(Gi, Gs, Gq, Go) coupling to class A and class B GPCRs. Here we have developed an in vitro 23
purification strategy to reconstitute the GPCR signalling complex comprising the AVP-24
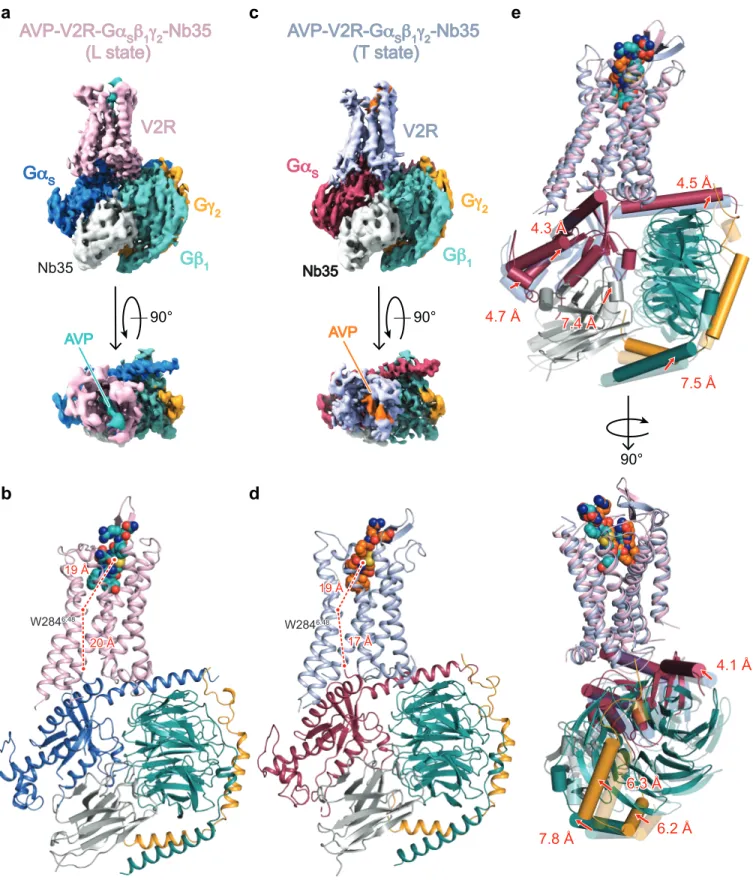
bound V2R and the heterotrimeric Gs protein stabilized with the nanobody Nb35. Cryo-25
EM single-particle analysis revealed the presence of three distinct populations of the 1
ternary complex with two best maps at a mean resolution of 4.0 and 4.1 Å. A novel 2
hybrid approach was used to build both corresponding structures. Analyses of the 3
structural features of the distinct conformations provide unprecedented molecular 4 insights into the dynamic process of ternary complex formation between the hormone 5 AVP, the V2 receptor and the Gs protein. 6 7 Determination of the AVP-V2R-Gs-Nb35 complex structure 8 After extensive biochemical optimization, validation of the complex preparation and of 9 cryo-EM grid sample vitrification, (see Methods, Extended Data Fig. 1, Supplementary 10
Figs. 1-2), a total number of 25,770 movies were recorded, with 3.5 million particles 11
picked and sorted out for further data processing (Extended data Fig. 2-3). After 3D 12
classification of projections and 3D refinement, we identified three different 13
conformational states of the complex, referred to as Loose (L), Tight-1 (T1) and Tight-2 14
(T2). Reconstruction of each state was at 4.2 Å, 4.5 Å and 4.7 Å, with a distribution of 15
16%, 48% and 36%, respectively (Extended Data Fig. 2), the local resolution varying 16
from 3.2 to 6.4 Å (Extended data Fig. 3c-d). Using the recent algorithm developed to 17
enhance cryo-EM maps by density modification16, the resolution of density maps were 18
improved to 4.0 (L state), 4.1 (T1 state) and 4.5 Å (T2 state), respectively (Extended 19
data Fig. 2, Extended Data Table 1, Supplementary Fig. 3). These maps mainly differ 20
in the angle of Gs-Nb35 with the receptor 7TM, and may reflect an inherent high 21
flexibility of the complex. A conformational heterogeneity analysis using multi-body 22 refinement revealed that more than 78% of the variance is accounted for by the fourth 23 first eigenvectors related to rotations and translations between AVP-V2R and Gs-Nb35 24 (Extended Data Fig. 4, Extended data Movie 1). The 4.5 Å map of the T2 state was not 25
well enough resolved to compute a reliable structure. Therefore, only the L and T1 1 structures, referred to as L and T states, were used for further analysis. 2 Because we could not unambiguously build the AVP in the calculated maps, we designed 3
an original hybrid strategy based on a combination of cryo-EM maps, computational 4
molecular dynamic simulations and experimental saturation transfer difference (STD) 5 NMR (Fig. 1a-e, Supplementary Discussion and Figs. 4-8). Based on this approach, the 6 L and T models were then built in a more conventional manner to match as closely as 7 possible the density maps (Fig. 1f-g, Extended Data Table 1). 8 In the final models, side chains of most residues are clearly identifiable in the 7 TM and 9 helix 8 of the V2R in both structures (Extended Data Fig. 5). Intracellular loop1 (ICL1) 10 was well defined in the maps, as well as the contacts between V2R and the Gs protein. 11 The α–helical domain of Gαs subunit was subtracted during single particle analysis for 12 high-resolution map refinement. Intracellular loops 2 and 3 and the C-terminus of V2R 13 were not seen in the density maps, and were not constructed in the final models. 14 15 Overall architecture of the ternary complex 16
Both L and T AVP-V2-Gs ternary complexes present a typical GPCR-G protein 17
architecture with the receptor 7TM helix bundle engaging the peptide agonist on the 18
extracellular side and the Gαs C-terminus domain (α5 helix) on the intracellular side 19
(Fig 2a-d). However, the L and T states present large structural differences most 20
notably in the position of the G protein heterotrimer relative to V2R (Fig. 2e). The α5 21
helix interacts more tightly in the T state than in the L state (Fig. 2b and 2d), inducing a 22
translation of the whole Gs heterotrimer (Fig. 2e). In particular, the α4 helix and the 23
Ras-like domain of Gαs are translated from 4 Å and 5 Å between the L and T states, 24
respectively. These movements position the αN helix 5 Å closer to the receptor in the T 25
state in comparison to the L state (Fig. 2e). Those Gα movements are also accompanied 1 by a 7 Å translation of the Gβ N-terminal helix, a translation of the γ subunit of 6 Å and a 2 translation of Nb35 of 7 Å (Fig. 2e). 3
The presence of several conformational states and the multi-body refinement analysis 4
reflect the dynamics of V2-Gs complex formation. From the final L structure model, a 5
principal component analysis (PCA) obtained from classical molecular dynamic 6
simulations revealed similar dynamics and suggests that the conformations captured by 7
the cryo-EM 3D reconstructions represent averaged states that are part of a much larger 8
conformational ensemble (Extended data Movie 2, Supplementary Fig. 9). Though 9
those differences are less pronounced that the ones recently described for the 10
neurotensin receptor NTSR1-Gi1 complexes17, they further indicate that GPCR-G protein 11
coupling is a dynamic process in which the G protein may explore different set of 12 conformations. 13 14 AVP binding pocket within V2R and comparison with OTR binding site 15
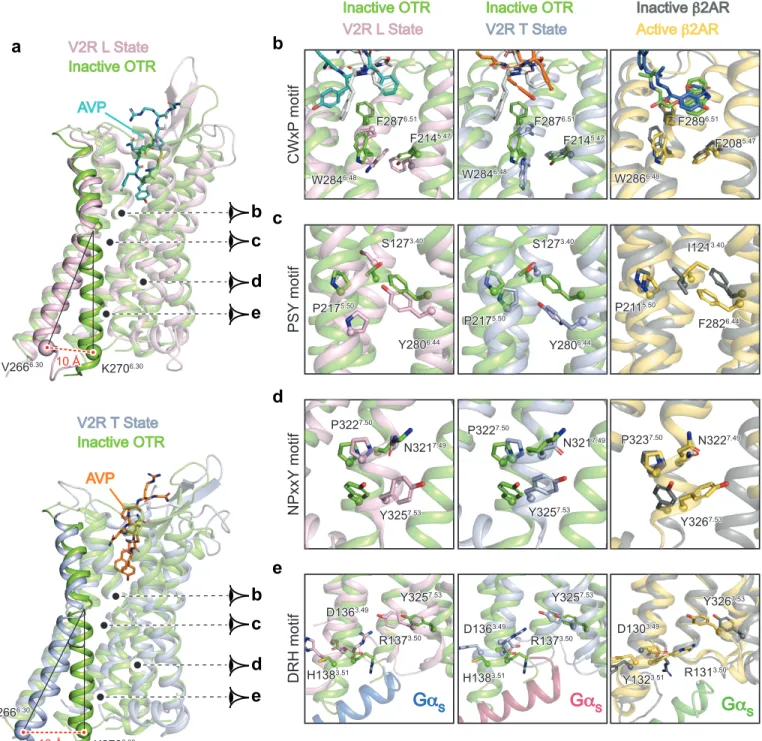
Our hybrid approach allowed us to build convincing models of AVP binding poses in 16
both L and T structures. The final calculated structures present a central position of AVP 17
in the orthosteric pocket of the V2R along the axis of the helical bundle (Fig. 3, 18 Extended Data Fig. 6). The extracellular domains of the V2R are widely opened in both 19 L and T conformations, a feature consistent with the accommodation of a cyclic peptide 20 like AVP (Extended Data Fig. 6), and in agreement with the recently reported inactive 21 OTR structure18. In the L and T structures, AVP contacts residues from both TM helices 22 and extracellular loops (Fig. 3a-c, Extended Data Fig. 6) in agreement with what was 23
originally proposed based on pharmacological data19. Consistent with its amphipathic 24
nature, AVP interacts with two chemically distinct interfaces in a 15 Å deep binding 1 pocket to form both polar and hydrophobic contacts (Fig. 3a- c). 2 While AVP conformations occupy a central position in both the L and T binding clefts, 3
interesting changes are observed due to a translation of the Tyr2 residue side-chain 4
(from TM7 to TM3), and to a movement of the C-terminal tripeptide (inversion in Arg8 5
and Gly9-NH2 positions) at the V2R surface (Extended data Fig. 6). The cyclic part of 6
AVP (Cys1 to Cys6) and the Pro7 are buried into the cleft defined by the seven-helix 7
bundle of V2R, leaving only Arg8 residue and C-terminal glycinamide exposed to the 8
solvent (Extended data Fig. 6). In both the L and T structures, the Cys1-Tyr2-Phe3 9
hydrophobic motif of AVP binds deeper in the binding site creating key contacts with the 10
receptor (Fig. 3a-c), in agreement with STD spectroscopy data (Fig. 1). 11
V2R and OTR belong to the same subfamily of peptide class A GPCRs and share a 12
common orthosteric binding site19,20. Although V2R and OTR (PDB 6TPK) structures18 13
represent different GPCR conformations (active agonist-bound V2R vs inactive 14
antagonist-bound OTR), it is interesting to compare the complete set of residues 15
involved in the binding of the natural hormone AVP with the ones involved in retosiban 16
binding to gain insights into ligand binding and efficacy in this receptor family (Fig 3b-17
e). Many OTR residues involved in the binding of retosiban are actually conserved 18
among AVP/OT receptors and also interact with AVP in the V2R (Fig. 3b-e). 19
Interestingly, the conserved W6.48 and F6.51 (Ballesteros-Weinstein numbering) in 20
AVP/OT receptors, interact with the highly hydrophobic indanyl moiety of retosiban in 21
the crystal structure of inactive OTR. AVP also makes contact with F6.51 through its Tyr2 22
but is not in contact with W6.48 in the V2R, probably because it is too bulky to bind 23
deeper in the pocket. These data confirm that hydrophobic small molecule nonpeptide 24
antagonists and AVP partially superimpose at the bottom of the orthosteric binding 1 pocket of AVP/OT receptors (Fig. 3d-e)21,22,23. 2 3 Activation of the V2R and comparison with other class A GPCRs 4
The active-state structures of the V2R reveal key structural features of the activation 5
process by comparison with the OTR inactive structure (Fig. 4a-e). Moreover, to get a 6
more general view of V2R activation, it was also important to look at the canonical 7
conformational changes of TMs and of conserved motifs involved in other ligand-8
activated GPCRs of class A24,25. Thus, compared to other active GPCR structures and to 9
the inactive antagonist-bound OTR structure (Fig. 4, Supplementary Fig. 10), the L and 10
T structures of V2R present all the features of active conformations, i.e. a large-scale 11 displacement of TM6 (Fig. 4a), conformational changes of W6.48 toggle switch (Fig. 4b), 12 a rearrangement of the P5.50-S3.40-Y6.44 transmission switch, equivalent to the PIF motif in 13 other GPCRs (Fig. 4c), a rotation of the conserved NPxxY7.53 motif (Fig. 4d) and a broken 14 D1363.49-R1373.50 ionic lock (Fig 4e, Fig. 5e). 15 Importantly by comparing the structures of the inactive antagonist-bound OTR with the 16
active agonist-bound V2R, it appears that contacts between M1233.36 and F2876.51 -17
W2846.48 motif (all in contact with Tyr2 of AVP) undergo large conformational 18 rearrangements (Extended Data Fig. 6). It is thus tempting to speculate that it is a key 19 motif regulating the activity of this family of receptor. 20 As indicated above, the V2R R1373.50 participates in the ionic lock motif involved in the 21
balance of active versus inactive states of class A GPCRs24. In the inactive structure of 22
OTR (Fig. 4e), D1363.49 and R1373.50 interact with each other through this ionic lock. For 23
comparison, this salt bridge is broken in the L and T active conformations of the V2R-Gs 24
complex (Fig. 4e, Fig. 5e). The observed constitutive activity towards Gs coupling for 25
the missense mutations C1373.50 or L1373.50 responsible for NSIAD9,26,27 can thus be 1
explained from a structural point of view since these hydrophobic residues are not able 2
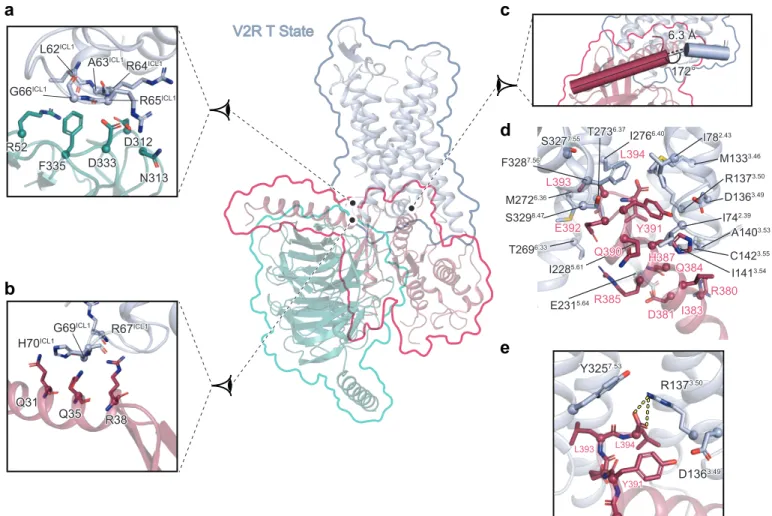
to form such an ionic lock to stabilize the inactive state. On the contrary, the mutant 3 H1373.50 causing cNDI28,29 might still be able to maintain the balance between active and 4 inactive states of the V2R through its partial positive charge. Its loss-of-function rather 5 reflects the loss of accessibility to AVP because of a constitutive internalization27, ,28,29. 6 7 V2R-Gs interactions 8 The cryo-EM maps of the ternary complex clearly establish the structural details of V2R-9
Gs coupling. As anticipated from the conserved mechanism of GPCR-G protein 10 coupling30,31, both the L and T conformations show a similar overall architecture of the 11 complex interface with the engagement of the Gαs C-terminal α5 helix in the core of the 12 7TM (Fig. 5, Extended Data Fig. 7, Supplementary Fig. 10). However, there are some 13 interesting differences compared to other GPCR-Gs complex structures. Of note, in both 14 the L and T structures, the V2R ILC1 makes many direct contacts with the Gβ subunit. In 15 the T state, ICL1 residues L62-A63-R64-R65-G66 interact with Gβ R52, D312-N313 and 16
D333-F335 (Fig5a). In the L state, ICL1 residues R65-G66-R67-R68 interact with Gβ 17
R52, D312 and D333 (Extended Data Fig. 7a). These contacts between V2R and Gβ are 18
much more numerous than in the class A GPCR β2AR- or A2AR-Gs complexes32,33. 19
Moreover in the T conformation, there are some additional contacts between V2R ICL1 20
(R67-G69-H70) with the N-terminal α helix of Gαs (Q31, Q35 and R38), resulting in a 21
more compact interaction (Fig 5b). In the L state, V2R (W71) and N-terminal α helix of 22
Gαs (Q35 and R38) contacts are more limited (Extended Data Fig. 7b). Contacts 23
between the N-terminal α helix of Gαs with GPCRs have only been seen in GLP1R and 24
CTR class B GPCR complexes34,35, not in class A GPCR-G complexes. 25
In contrast to what was observed for the β2AR32 and the μOR36, the Gαs C-terminal α5 1
helix appears to extend helix 8 (H8) of the V2 receptor, lying almost parallel to the 2
membrane plane (Fig. 5c, Extended Data Fig 7c, f-h). Also, compared with the β2AR, 3 the C-terminus of Gαs is interacting deeper in the V2R 7TM core making direct contact 4 with residues (L and T states, respectively) of V2R that are part or in close proximity to 5 the conserved NPxxY (TM7) and DRH (TM3) activation motifs (Fig 5d-e, Extended Data 6 Fig. 7d-h). In this respect, the V2-Gs interaction resembles more the interaction seen in 7
the μOR-Gi complex (Extended Data Fig. 7f-h). The V2R TM7-H8 hinge region also 8
makes a strong contact with the Gαs ELL motif, in particular through hydrophobic 9
contacts with the F3287.56 side chain (Fig. 5d). The T and L conformations differ here in 10
the position of the Gαs L394 side chain originating from a distinct F3287.56 side chain 11 conformation (pointing towards I782.43 of the receptor in the T structure or towards Gαs 12 L394 in the L structure) (Fig. 5d, Extended Data Fig. 7d). Most notably in the T state, 13 the side chain of R1373.50 which is part of the ionic lock motif, forms an ionic interaction 14 with the free carboxylic acid function of the Gαs C-terminus (Fig. 5e), a direct contact 15 that was not observed before between a GPCR and a G protein of any family (Gs, Gi, Go 16
or Gq)14,15,37. Moreover, in the L state, the density map suggests that the R1373.50 side 17
chain could adopt two conformations, one forming a similar ionic interaction with the 18
carboxylic acid of Gαs L394 main chain, and, the other one, pointing towards the 19 Y3257.53 from the NPxxY motif (Extended Data Fig. 7e). 20 21 Conclusion 22
In this study, we solved two structures of the active state of the AVP hormone-bound 23
V2R in complex with the Gs protein. The structural insights into the function of this 24
signalling system pave the way for future drug development to treat water balance 1 disorders7. 2 3 References 4 5 1. Barberis, C., Mouillac, B. & Durroux, T. Structural bases of vasopressin/oxytocin 6 receptor function. J. Endocrinol. 156, 223–9 (1998). 7 2. Barberis C., Morin D., Durroux T., Mouillac B., Guillon G., Seyer R., Hibert M, T. E. 8 and M. M. Molecular Pharmacology of AVP and OT Receptors and Therapeutic 9 Potential. Drug News Perspect. 12, 279–292 (1999). 10 3. Robben, J. H., Knoers, N. V. A. M. & Deen, P. M. T. Regulation of the vasopressin V2 11 receptor by vasopressin in polarized renal collecting duct cells. Mol. Biol. Cell 15, 12 5693–9 (2004). 13 4. Treschan, T. A. & Peters, J. The vasopressin system: physiology and clinical 14 strategies. Anesthesiology 105, 599–612; quiz 639–40 (2006). 15 5. Ren, X. R. et al. Different G protein-coupled receptor kinases govern G protein and 16 β-arrestin-mediated signaling of V2 vasopressin receptor. Proc. Natl. Acad. Sci. U. 17 S. A. 102, 1448–1453 (2005). 18 6. Alonso, G. et al. Sustained elevated levels of circulating vasopressin selectively 19 stimulate the proliferation of kidney tubular cells via the activation of V2 20 receptors. Endocrinology 150, 239–50 (2009). 21 7. Ball, S. G. Vasopressin and disorders of water balance: the physiology and 22 pathophysiology of vasopressin. Ann. Clin. Biochem. 44, 417–31 (2007). 23 8. Morello, J. P. & Bichet, D. G. Nephrogenic diabetes insipidus. Annu. Rev. Physiol. 63, 24 607–30 (2001). 25
9. Feldman, B. J. et al. Nephrogenic syndrome of inappropriate antidiuresis. N. Engl. J. 1 Med. 352, 1884–90 (2005). 2 10. Harris, P. C. & Torres, V. E. Polycystic kidney disease. Annu. Rev. Med. 60, 321–37 3 (2009). 4 11. Edward Zhou, X., Melcher, K. & Eric Xu, H. Structural biology of G protein-coupled 5 receptor signaling complexes. Protein Sci. 28, 487–501 (2019). 6 12. Gusach, A. et al. Beyond structure: emerging approaches to study GPCR dynamics. 7 Curr. Opin. Struct. Biol. 63, 18–25 (2020). 8 13. Fernandez-Leiro, R. & Scheres, S. H. W. Unravelling biological macromolecules 9 with cryo-electron microscopy. Nature 537, 339–46 (2016). 10 14. Carpenter, B. & Tate, C. G. Active state structures of G protein-coupled receptors 11 highlight the similarities and differences in the G protein and arrestin coupling 12 interfaces. Curr. Opin. Struct. Biol. 45, 124–132 (2017). 13 15. García-Nafría, J. & Tate, C. G. Cryo-EM structures of GPCRs coupled to G s , G i and 14 G o. Molecular and Cellular Endocrinology vol. 488 1–13 (2019). 15 16. Terwilliger, T. C., Ludtke, S. J., Read, R. J., Adams, P. D. & Afonine, P. V. 16 Improvement of cryo-EM maps by density modification. Nat. Methods 17, 923– 17 927 (2020). 18 17. Kato, H. E. et al. Conformational transitions of a neurotensin receptor 1–Gi1 19 complex. Nature 572, 80–85 (2019). 20 18. Waltenspühl, Y., Schöppe, J., Ehrenmann, J., Kummer, L. & Plückthun, A. Crystal 21 structure of the human oxytocin receptor. bioRxiv 2020.02.21.958090 (2020) 22 doi:10.1101/2020.02.21.958090. 23 19. Mouillac, B. et al. The binding site of neuropeptide vasopressin V1a receptor. 24 Evidence for a major localization within transmembrane regions. J. Biol. Chem. 25
270, 25771–7 (1995). 1 20. Hibert, M. et al. Functional architecture of vasopressin/oxytocin receptors. J. 2 Recept. Signal Transduct. Res. 19, 589–96 (1999). 3 21. Macion-Dazard, R. et al. Mapping the Binding Site of Six Nonpeptide Antagonists to 4 the Human V 2 -Renal Vasopressin Receptor. J. Pharmacol. Exp. Ther. 316, 564– 5 571 (2006). 6 22. Cotte, N. et al. Conserved aromatic residues in the transmembrane region VI of the 7 V 1a vasopressin receptor differentiate agonist vs. antagonist ligand binding. Eur. 8 J. Biochem. 267, 4253–4263 (2000). 9 23. Tahtaoui, C. et al. Identification of the Binding Sites of the SR49059 Nonpeptide 10 Antagonist into the V 1a Vasopressin Receptor Using Sulfydryl-reactive Ligands 11 and Cysteine Mutants as Chemical Sensors. J. Biol. Chem. 278, 40010–40019 12 (2003). 13 24. Filipek, S. Molecular switches in GPCRs. Curr. Opin. Struct. Biol. 55, 114–120 14 (2019). 15 25. Deupi, X. Relevance of rhodopsin studies for GPCR activation. Biochim. Biophys. 16 Acta - Bioenerg. 1837, 674–682 (2014). 17 26. Tenenbaum, J. et al. The constitutively active V2 receptor mutants conferring 18 NSIAD are weakly sensitive to agonist and antagonist regulation. PLoS One 4, 1–6 19 (2009). 20 27. Rochdi, M. D. et al. Functional characterization of vasopressin type 2 receptor 21 substitutions (R137H/C/L) leading to nephrogenic diabetes insipidus and 22 nephrogenic syndrome of inappropriate antidiuresis: implications for treatments. 23 Mol. Pharmacol. 77, 836–45 (2010). 24 28. Bernier, V. et al. Functional rescue of the constitutively internalized V2 25
vasopressin receptor mutant R137H by the pharmacological chaperone action of 1 SR49059. Mol. Endocrinol. 18, 2074–84 (2004). 2 29. Barak, L. S., Oakley, R. H., Laporte, S. A. & Caron, M. G. Constitutive arrestin-3 mediated desensitization of a human vasopressin receptor mutant associated with 4 nephrogenic diabetes insipidus. Proc. Natl. Acad. Sci. U. S. A. 98, 93–8 (2001). 5 30. Weis, W. I. & Kobilka, B. K. The Molecular Basis of G Protein-Coupled Receptor 6 Activation. Annu. Rev. Biochem. 87, 897–919 (2018). 7 31. Hilger, D., Masureel, M. & Kobilka, B. K. Structure and dynamics of GPCR signaling 8 complexes. Nat. Struct. Mol. Biol. 25, 4–12 (2018). 9 32. Rasmussen, S. G. F. et al. Crystal structure of the β2 adrenergic receptor-Gs protein 10 complex. Nature 477, 549–55 (2011). 11 33. García-Nafría, J., Lee, Y., Bai, X., Carpenter, B. & Tate, C. G. Cryo-EM structure of the 12 adenosine A2A receptor coupled to an engineered heterotrimeric G protein. Elife 13 7, (2018). 14 34. Liang, Y.-L. et al. Cryo-EM structure of the active, Gs-protein complexed, human 15 CGRP receptor. Nature 561, 492–497 (2018). 16 35. Liang, Y. L. et al. Phase-plate cryo-EM structure of a class B GPCR-G-protein 17 complex. Nature 546, 118–123 (2017). 18 36. Koehl, A. et al. Structure of the µ-opioid receptor–Gi protein complex. Nature 558, 19 547–552 (2018). 20 37. Kim, K. et al. Structure of a Hallucinogen-Activated Gq-Coupled 5-HT2A Serotonin 21 Receptor. Cell 182, 1574-1588.e19 (2020). 22 23
METHODS 1 2 Data analysis and Figure preparation 3
Figures were created using the PyMOL 2.3.5 Molecular Graphics System (Schrödinger, 4 LLC) and the UCSF Chimera X 0.9 package. Data were plotted with GraphPad Prism 8.3.0. 5 6 V2R expression and purification 7
The version of the human V2R used for this study in described in Supplementary 8
Methods and was cloned into a pFastBac™1 vector. It was expressed in Sf9 insect cells 9
using the Bac-to-Bac® baculovirus expression system ((Thermofisher) according to 10
manufacturer’s instructions. Insect cells were grown in suspension in EX-CELL® 420 11
medium (SigmaAldrich) to a density of 4 × 10⁶ cells per ml and infected with the 12
recombinant baculovirus at a MOI of 2-3. The culture medium was supplemented with 13
the V2R pharmacochaperone antagonist Tolvaptan (TVP, SigmaAldrich) at 1 μM to 14 increase the receptor expression levels38,39. The cells were infected for 48h-54h at 28°C 15 and expression of the V2R was checked by immunofluorescence using an anti-Flag M1 16 antibody coupled to Alexa488. Cells were then harvested by centrifugation (2 steps, 20 17 min, 3,000xg) and pellets were stored at −80°C until use. 18 The cell pellets were thawed and lysed by osmotic shock in 10 mM Tris-HCl pH 8, 1 mM 19
EDTA buffer containing 2mg.ml−1 iodoacetamide, Tolvaptan 1 µM and protease 20
inhibitors (leupeptine 5μg.ml-1, benzamidine 10μg.ml-1 and PMSF 10μg.ml-1). After 21
centrifugation (15 min, 38,400xg), the pellet containing crude membranes was 22
solubilized using a glass dounce tissue grinder (15 + 20 strokes using A and B pestles, 23
respectively) in a solubilization buffer containing 20 mM Tris-HCl pH 8, 500 mM NaCl, 24
0.5 % (w/v) n-dodecyl-β-D-maltopyranoside (DDM, Anatrace), 0.2% (w/v) sodium 25
cholate (SigmaAldrich), 0.03 % (w/v) cholesteryl hemisuccinate (CHS, SigmaAldrich), 20 1
% Glycerol, 2 mg.ml−1 iodoacetamide, 0.75 ml.L-1 Biotin Biolock (IBA), Tolvaptan 1 µM 2
and protease inhibitors. The extraction mixture was stirred for 1 h at 4 °C and 3
centrifuged (20 min, 38,400xg). The cleared supernatant was poured onto an 4
equilibrated Strep-Tactin® resin (IBA) for a first affinity purification step. After 2h of 5 incubation at 4°C under stirring, the resin was washed three times with 10 CV of a buffer 6 containing 20 mM Tris-HCl pH 8, 500 mM NaCl, 0.1 % (w/v) DDM, 0.02% (w/v) sodium 7 cholate, 0.03 % (w/v) CHS, Tolvaptan 1 µM. The bound receptor was eluted in the same 8 buffer supplemented with 2.5 mM desthiobiotin (IBA). 9 The eluate was supplemented with 2mM CaCl2 and loaded onto a M1 anti-Flag affinity 10
resin (SigmaAldrich). The resin was washed with 10 CV of two successive buffers 11
containing 20 mM HEPES pH 7.5, 100 mM NaCl, 0,1% DDM, 0,01% CHS, 10 µM AVP, 12 2mM CaCl2, then 20 mM HEPES pH 7.5, 100 mM NaCl, 0,025% DDM, 0,005% CHS, 10 µM 13 AVP, 2mM CaCl2, respectively. The receptor was eluted from the Flag resin using a buffer 14 containing 20 mM HEPES pH 7.5, 100 mM NaCl, 0,025% DDM, 0,005% CHS, 10 µM AVP, 15 2 mM EDTA and 200 μg/mL Flag peptide (Covalab). 16 After concentration using a 50kDa MWCO concentrator (Millipore), the V2R was purified 17
by size exclusion chromatography (SEC) using a Superdex 200 (10/300 column) 18 connected to an AKTA purifier system (GE Healthcare). Fractions corresponding to the 19 pure monomeric receptor were pooled (~ 2 ml) and concentrated to 50-100 µM with an 20 excess of AVP (200 µM). 21 22 Gs expression and purification 23 Human Gαs, Gβ1 with a N-terminal Twin-Strep-tag® and Gγ2 were all expressed in Sf9 24
insect cells grown in EX-CELL® 420 medium (SigmaAldrich). A recombinant 25
baculovirus for Gαs subunit was prepared using the BestBac™ (Expression Systems) 1
strategy, whereas a baculovirus for Gβ1 and Gγ2 was prepared using the Bac-to-Bac® 2
system. Gβ1 and Gγ2 were cloned in tandem into the pFastBac™ Dual vector 3
(Thermofisher). Sf9 cells, at a density of 4x10⁶ cells/ml, were co-infected with both 4 viruses at a 1:2 Gαs:Gβ1γ2 ratio for 72h at 28°C. Cells were harvested and pellets stored 5 at -80°C. 6 Co-infected Sf9 cell pellets were thawed and lysed in a buffer containing 10 mM TRIS pH 7
7.4, 1mM EDTA, 5 mM β-Mercapto-Ethanol, 10 µM GDP and protease inhibitors 8
(leupeptine 5μg.ml-1, benzamidine 10μg.ml-1 and PMSF 10μg.ml-1). Lysed cells were 9
centrifuged (20 minutes, 38,400xg). The pellets containing the crude membranes were 10
homogeneized using a glass dounce tissue grinder (20 strokes with tight B pestle) in 11
solubilization buffer containing 20 mM HEPES pH 7.5, 100 mM NaCl, 1% DDM, 5 mM 12
MgCl2 supplemented with 5 mM β-Mercapto-Ethanol, 10 µM GDP, 0.75 ml.L-1 biotin 13
biolock and protease inhibitors. The mixture was stirred for 40 minutes at 4°C and 14
centrifuged (20 min, 38,400xg). The supernatant was loaded onto a Strep-Tactin® 15
affinity resin equilibrated with the same buffer. The resin was washed 3 times, first with 16
5 CV of solubilization buffer, then with 5 CV of solubilisation buffer supplemented with 17
100 µM TCEP (instead of β-Mercapto-Ethanol), and finally with 10 CV of wash buffer 18 containing 20 mM HEPES pH 7.5, 50 mM NaCl, 0.1% DDM, 1 mM MgCl2, 100 µM TCEP, 10 19 µM GDP. The Gs heterotrimer protein was eluted in the same buffer supplemented with 20 2.5 mM desthiobiotin. After a treatment with antarctic phosphatase (5 Units, NEB Inc.) 21 for 30 minutes at 4°C, the Gs protein was concentrated to 10 mg/ml using 50 kDa MWCO 22 concentrators. 20% glycerol was added to the sample and aliquots were flash-frozen in 23 liquid nitrogen before storage at -80 °C. 24 25
Nb35 expression and purification 1
The production and purification of Nb35 were performed following a protocol 2 established by Kobilka and coworkers40. It is described in Supplementary Methods. 3 4 Purification of the AVP-V2R-Gs-Nb35 complex 5
Formation of a stable complex was done by mixing the purified V2R with 1.2 molar 6
excess of purified Gs heterotrimer, 250 µM AVP and 2.5 mM MgCl2. The coupling 7
reaction was allowed to proceed at RT for 45 minutes and was followed by addition of 8
apyrase (0.0125 Units, NEB Inc.) to hydrolyse residual GDP and maintain the high-9 affinity nucleotide-free state of Gs. 15 minutes later, Nb35 was added at a 2-fold molar 10 excess compared to Gs. After 15 more minutes at RT, the mix was incubated overnight at 11 4°C. In most reaction mixtures, the final concentration of V2R was 20-30 μM, that of Gs 12
30-40 μM and the one of Nb35 around 80 μM. To remove excess of G protein 13
heterotrimer and Nb35, the complex AVP-V2R-Gs-Nb35 was purified by a M1 anti-Flag 14
affinity chromatography. After loading, the DDM detergent was then gradually 15
exchanged with Lauryl Maltose Neopentyl Glycol (LMNG, Anatrace). The LMNG 16
concentration was then decreased gradually from 0.5% to 0.01%. The complex and the 17
unbound V2R were eluted in 20 mM HEPES pH 7.5, 100 mM NaCl, 0.01% LMNG, 0.002% 18
CHS, 2 mM EDTA, 10 µM AVP and 0.2 mg.mL-1 Flag peptide. The eluted AVP-V2R-Gs-19
Nb35 complex was separated from unbound V2R by SEC on a Superdex 200 10/300 20
with a buffer containing 20 mM HEPES pH 7.5, 100 mM NaCl, 0.002% LMNG, 0.0025% 21
glyco-diosgenin (GDN, Anatrace), 0.002% CHS, 10 µM AVP. The fractions corresponding 22
to the complex were collected, concentrated with a 50 kDa MWCO concentrator and 23
subjected to a second SEC on a Superose 6 (10/300 GL, GE Healthcare) with a buffer 24
containing 20 mM HEPES pH 7.5, 100 mM NaCl, 0.0011% LMNG, 0.001% GDN, 0.002% 25
CHS, 10 µM AVP. Peak fractions were pooled and concentrated using a 50 kDa MWCO 1
concentrator to concentrations ranging from ~1 mg.mL-1 to ~4 mg.mL-1 for Cryo-EM 2 studies. The amphipol A8-35 (Anatrace) was added at 0.001% to help in the dispersion 3 of the particles for Cryo-EM grid preparation. 4 5 Negative stain microscopy observations 6 Before preparing Cryo-EM grids, we first checked the quality and the homogeneity of the 7
AVP-V2R-Gs-Nb35 sample by NS-EM. The procedure is described in Supplementary 8 Methods. 9 10 Cryo-EM sample preparation, image acquisition 11 In this study, two datasets have been recorded from two different preparations of AVP-12
V2R-Gs-Nb35. For the first dataset acquisition, 3 µL of purified AVP-V2R-Gs-Nb35 at 13
0.75 mg/ml concentration were applied on glow-discharged Quantifoil R 1.2/1.3 300 14
mesh copper holey-carbon grids (Quantifoil Micro tools GmbH, Germany), blotted for 15
4.5s and then flash-frozen in liquid ethane using the semi-automated plunge freezing 16 device Vitrobot Mark IV (ThermoFisher) maintained at 100% relative humidity and 4°C. 17 For the second dataset acquisition, cryo-EM grids were prepared as previously, but the 18 purified V2R-Gs-Nb35 complex was at a concentration of 4 mg/ml and the cryo-EM grids 19 were prepared using a EM GP2 (Leica microsystems) plunge freezer with a 4s blotting 20 time (100% humidity and 4°C). 21 Images were collected in 2 independent sessions on a TEI Titan Krios (ThermoFisher) at 22 the EMBL of Heidelberg (Germany) at 300 keV through a Gatan Quantum 967 LS energy 23 filter using a 20 eV slit width in zero-loss mode and equipped with a K2-Summit (Gatan 24
inc.) direct electron detector configured in counting mode. Movies were recorded at a 25
nominal EFTEM (energy-filtered transmission electron microscope) magnification of 1 ×165,000 corresponding to 0.81 Å calibrated pixel size. The movies were collected in 40 2 frames in defocus range between −0.8 and −2.2 µm with a total dose of 50.19 e−/Å2 (1st 3
dataset) and 41.19 e−/Å2 (2nd dataset). Data collection was fully automated using 4 SerialEM41. 5 6 Cryo-EM data processing 7
All data processing operations were performed with RELION-3.0.742 unless otherwise 8 specified. 9 In total, 17,290 movies of the AVP-V2R-Gs-Nb35 sample at 0.75 mg/ml were collected. 10 Dose-fractionated image stacks were subjected to beam-induced motion correction and 11 dose-weighting using Motioncorr own implementation. Gctf was used to determine the 12 contrast transfer function parameters43 from non-dose weighted images. After sorting, 13 micrographs with maximum estimated resolution beyond 5 Å were discarded. Particle 14
picking was carried out using Gautomatch (K. Zhang, MRC LMB (www.mrc-15
lmb.cam.ac.uk/kzhang/)) allowing to pick out 2,291,432 particles. Particles were 16
extracted in a box-size of 240 Å, downscaled to 4 Å/pix and subjected to reference-free 17
2D classifications to discard false-positive particles or particles categorized in poorly 18
defined classes. A subset of 1,109,475 particles was selected for further processing. This 19
particle set was subjected to a 3D classification with four classes using the 30 Å low-pass 20
filtered calcitonin receptor map as reference35. Particles from the 2 classes representing 21
27% of total particles and showing a complete AVP-V2R-Gs-Nb35 complex were 22 selected, re-extracted with a pixel size of 1.62 Å, and subjected to a 3D refinement. This 23 subset of 307,125 particles yielded a map with a global resolution (FSC = 0.143) of 4.8 Å 24 resolution. Particles were then subjected to a focused 3D classification without angular 25
and translational alignments with a mask including the complex minus GαsAH. The best 1
class corresponding to 150,000 particles were re-extracted without binning and 2
submitted to a 3D refinement, allowing us to obtain a map at 4.4 Å resolution. All further 3
processing including signal substraction, using of different type of masks, CTF 4 refinement and polishing did not improved the resolution of the map. 5 In total, 8,490 movies of the AVP-V2R-Gs-Nb35 sample at 4.0 mg/ml were recorded. The 6 image processing steps were the same as previously described, except that the picking 7
was performed using boxnet from Warp software package44 allowing us to extract 8
1,214,575 particles. After a 2D classification to clean the dataset, a subset of 917,990 9
particles was subjected to two successive rounds of 3D classification. A subset of 10
150,000 particles was used for further 3D refinements yielding a final map at 4.4 Å 11
resolution. 12
Both cleaned datasets were merged, corresponding to 1,109,475 particles from dataset 13
1 and 917,990 particles from dataset 2. Particles were subjected to 3D classification 14 with 3 classes. One class displayed the expected structural features of the AVP-V2R-Gs-15 Nb35 complex corresponding to 877,003 particles and were selected for a new round of 16 3D classification with 6 classes. This classification revealed structural variability in the 17
ligand location and at the interface between the receptor and the Gs protein. Three 18
subsets of particles were selected (L, T1 and T2 states), re-extracted with a pixel size of 19
1.62 Å or 0.81 Å, and subjected to 3D refinements yielding maps at 4.5 Å, 4.7 Å and 5.5 Å 20
respectively. New rounds of 3D refinements were performed in applying a mask to 21 exclude both the micelle and the GαsAH yielding maps at 4.23 Å, 4.4 Å and 4.7 Å. CTF 22 refinement and polishing steps were applied on the three subsets of particles, allowing 23 us to improve the resolution of the best map to 4.17 Å (FSC = 0.143). The 1.62 Å/pixel 24
T1 map was resampled at 0.81 Å/pixel for visualization purposes. Final refinements 25
were processed with the option masking individual particles with zero turned-off. All 1
our attempts to refine our final subsets in cisTEM45 and cryoSPARC46 using non-uniform 2
refinement did not improve the resolution of final maps. 3
To investigate the conformational dynamics of the signalling complex, multi-body 4
refinement was performed on 877,003 particles, with two bodies corresponding to AVP-5
V2R and Gs-Nb35. Local resolution was estimated with the Bsoft 2.0.3 package47,48. Map 6
sharpening was re-evaluated with Phenix autosharpen tool49. Phenix resolve_cryoEM 7
tool16 was used to improve the map interpretability and allowed to increase the 8
estimated resolution to 4.04, 4.13 and 4.5 Å for L, T1 and T2 states, respectively 9 (Supplementary Fig. 3). 10 11 Model building and refinement 12 Receptor and AVP initial models 13 The V2R was built by comparative modelling, using the MODELLER software50 and the 14 X-ray structure of the δ-opioid receptor at 3.4 Å resolution (PDB:4EJ4) as a template51, 15
sharing a sequence similarity of about 44% with the V2R (on the modeled region). 16
Because modelling loops or terminal regions is a very challenging task and their 17 dynamical behavior is very poorly described in CG simulations, N- and C-terminus of the 18 receptor (residues 1-35 and 335-371, respectively) as well as part of the icl3 loop (237-19 262) were lacking in the used template. Thus, only residues 36 to 236 and 263 to 334 20
were modeled. 500 models were generated and the one sharing the best objective 21 function score was further selected as a starting point for the simulations. The disulfide 22 bridge conserved among the class A GPCRs was included between residues 112 and 192 23 of the V2R. 24
The AVP peptide (NH3+-CYFQNCPRG-CONH2) was built from its X-ray structure available 1
in the PDB (code 1JK4, 2.3 Å resolution) which describes the 6-residues cycle of the 2
peptide in interaction with neurophysin52. As depicted in Supplementary Fig. 4 this 3
structure shows a cycle conformation equivalent to that found in bound (PDB code: 4
1NPO) and unbound related peptide oxytocin (PDB code: 1XY2)53,54. It was thus 5
preferred to the one describing the trypsin:vasopressin complex (PDB code : 1YF4)55 6 harboring a completely different conformation of the cycle. The three last residues of the 7 peptide (7-PRG-9) were also built with the oxytocin structure templates. 8 The obtained initial models of both receptor and peptide were then converted to a CG 9
representation using the MARTINI forces field (version 2.2, Elnedyn)56. Using such a 10
model, residues (backbone beads) closer than 9.0 Å are bound by a spring displaying a 11
force constant of 500 kJ.mol-1.nm-2 (default value from the Elnedyn force field). Such a 12
link is meant to maintain both the secondary and the tertiary structures of the 13
polypeptides. The resulting elastic networks of both the peptide and the receptor are 14
represented in Supplementary Fig. 4. For the peptide, only the springs involving two 15
residues of the cycle were conserved for further calculations, the three last residues 16
being free to move. The standard elastic network of the receptor was not modified and 17
allowed the latter to open or close freely as no spring was bridging the extracellular 18 loops. 19 MD simulations 20 The receptor was inserted in a 100x100 Å2 lipid bilayer exclusively composed of POPC. 21 To avoid the exploration by the peptide of the intracellular side of the membrane during 22 MD (because of periodic boundary conditions), the system was duplicated/rotated along 23 the z-axis (the two extracellular sides of the receptors were facing each other), in order 24
to create an extracellular compartment. Two copies of the peptide were added to 25
increase the interaction sampling with a 1:1 ratio. In a last step, water and chloride 1
counter-ions were added to neutralize the system. The fully-solvated system included 2
20004 beads. A representation of the simulated box with two receptors and two 3
peptides is reported in Supplementary Fig. 3. After 10 000 steps of energy minimization 4
using the conjugate gradient algorithm, the system was further equilibrated at 51 5 different temperatures (in the range 300:450 K by steps of 3 K) in the NVT ensemble, 6 using an integration step of 20 fs and over a period of 5 ns. The final production step 7 was performed in the NPT ensemble, using an integration step of 20 fs and was stopped 8 after 20 µs. During production, Replica-Exchange MD (REMD) was used to improve the 9
sampling of all possible configurations of the peptide:receptor complex. The potential 10
energy difference of adjacent replicas was computed every 1000 steps (20 ps) and their 11
coordinates were exchanged according to a Boltzmann criterion. With the used 12
parameters, the probability of exchange between adjacent replica was in the range 0.11 13
(300K):0.23(450K). Three independent CG-REMD simulations were run to verify the 14
convergence of the obtained models, together representing a cumulated sampling time 15
of ~3 ms (Supplementary Fig. 5). For each of these simulations, a clustering was 16
performed on all conformations of the peptide:receptor complex obtained at the lowest 17
temperature (300 K). To do so, we first concatenated the data corresponding to the four 18
possible complexes (peptide1:receptor1, peptide1:receptor2, peptide2:receptor1 and 19
peptide2:receptor2). For that step, only the conformations displaying at least one 20 peptide:receptor contact were kept (a contact was defined using a cut-off distance of 7 21 Å). For clustering, we used the algorithm of Daura et al.57 with a RMSD cut-off of 3.0 Å. 22 The RMSD was computed only on the backbone beads of the peptide’s residues 1 to 6 23 after structural fit onto those of the V2R. The two cysteines side-chains beads were also 24
included for RMSD calculations. All simulations and analyzes were performed with the 1 Gromacs software (version 5)58. Figures were produced with VMD59. 2 Refinement of the obtained CG-models in the cryo-EM maps 3 The Correlation-Driven Molecular Dynamics (CDMD) method60 was employed to refine 4 the most populated clusters obtained in CG-REMD using the L state cryo-EM map of the 5 AVP-V2-Gs-Nb35 complex. The principle of the method is to use an accurate force field 6
and thermodynamic sampling to improve the real-space correlation between the 7
modeled structure and the cryo-EM maps. Before this refinement step, the Gs 8
heterotrimer and the Nb35 were modeled using the structure of the β2AR-Gs-Nb35 9 complex40 as a reference. The MARTINI force field restrained the internal conformations 10 of the different partners with an internal elastic network. To increase significantly the 11 conformational plasticity of the receptor and explore new conformations specific to the 12 V2R, we modified its default elastic network. We automatically deleted the “long-range” 13
springs involving two beads whose indexes differ by at least 15. This contributed to 14
delete all inter-helices springs. The resulting elastic network used at this step for the 15
receptor is reported in Supplementary Fig. 4. The standard elastic network was 16
conserved for all other partners including the AVP peptide, the G protein and the Nb35. 17
No inter-chains springs were included for the G protein. After conversion of Gs and 18
Nb35 into the CG model, the two proteins were placed at a rational position in respect to 19
the V2R using the β2AR-Gs-Nb35 complex40. The full system was inserted in a larger 20
membrane (150x150 Å2) and solvated on each side for further calculations. 21
The fit in each cryo-EM maps was performed in four successive steps summarized in 22
Supplementary Fig. 6. First, a quick energy minimization (2000 steps of conjugate 23
gradient) was performed on the full system without taking the map into account. This 24
step was dedicated to the removal of bad contacts resulting from the addition of Gs and 25
Nb35 proteins. Then the second step consisted in a first equilibration of 5 ns (10 fs time-1 step; NVT; 300 K) performed with CDMD and using a constant targeted low resolution of 2 5 Å together with a strength constant of 10000 kJ.mol-1 for the map potential. This bias 3 was applied only to the backbone beads of the system. This step was useful to quickly 4 optimize the alignment of the system with the targeted map. During this second step, an 5 additional force of 50000 kJ.mol-1.nm-2 was added to keep the distance between the two 6 centers of masses (COMs) of both the peptide and surrounding residues of the receptor 7 close to its initial value. This force prevented a quick motion of the AVP peptide in the 8 first steps of the simulation that resulted from large forces applying to the receptor. For 9
the subsequent steps of the fitting procedure, this additional force on COMs was 10
removed. During the step 3 (30 ns), the same MD parameters were used but with a 11 gradual increase of both the resolution (from 5 to 3 Å) and the strength constant (from 12 10000 to 50000 KJ.mol-1), over a period of 25 ns. During the last 5 ns these values were 13 kept constant. This step was the key step allowing the whole system to adapt and fit to 14
the maps. Finally, the last step (10 ns) consisted in keeping the resolution and the 15
strength constant at their reached values (3 Å; 50000 KJ.mol-1), but this time applying 16
the force only to the backbone and side-chain beads of the peptide. All the other 17
backbone beads of the system were restrained in positions during this step with a force 18
constant of 5000 KJ.mol-1. This step was useful to refine the position of the peptide in the 19
density, especially of its side-chains. For every step of the fitting procedure, the fit of 20
each cluster was performed 5 times to verify the convergence of the obtained models 21 (Supplementary Fig. 7). 22 23 All-atom refinement of the models in the maps 24
The CG-models obtained from the fitting procedure were back-mapped to a full-atom 1
representation. We used the standard “initram” procedure provided by the developers 2
of Martini61 with subtle changes. These changes concerned restrains on omega angles 3
and Cα-positions for all chains (V2R, Gs, Nb-35), to keep omega angles in trans 4
conformation and avoid large backbone motions which inevitably would lead to models 5
out of cryo-EM maps. Those restrains were added during the minimization and the MD 6
simulations inherent to the default “initram” procedure. In practice, the “initram” 7 procedure was as follow: 1/ after the very raw guess of atomic positions, from CG-beads, 8 done by the “initram” script, 2/ the Charmm36 force field62 was used for 10000 steps of 9 steepest descent disabling the non-bonded terms, 3/ followed by 5000 steps of steepest 10
descent including all terms of the force field, and finally 4/ 300 steps of MD were 11
performed. Except the number of steps, the parameters for minimization and MD 12
simulations were set as default from the “initram” procedure. Minimization and MD 13
simulations were performed using the Gromacs package58. 14
As a final step, iterative manual adjustments were carried out in COOT63, and real space 15
refinement using Phenix programs64. The model statistics were validated using 16 Molprobity65. 17 18 Classical all-atom molecular dynamics simulations 19 The L state cryoEM structure was subjected to molecular dynamics simulations (MDS). 20 The procedure is described in Supplementary Methods. 21 22 NMR data analysis 23
The purified V2R was prepared either in neutral amphipol (NAPol)66,67 or in LMNG 24
detergent. In both cases, the V2R was expressed in Sf9 insect cells and purified as 25
described above, except it was cleaved overnight at 4°C using the HRV3C protease at a 1
1:20 weight ratio (HRV3C:V2R) before concentration and purification by SEC. 2
1D STD NMR spectra68 were recorded either on a mixture of AVP with V2R (400 3
µM:2 µM), or on AVP (Supplementary Fig. 8). Selective methyl resonance saturation 4
was achieved by equally spaced 60 ms Gaussian 180° pulses separated by 1 ms delay at 5
0 ppm (−50 ppm for reference spectra) at 274K and 283K. An irradiation test was 6
performed on a free peptide sample (400 µM) to verify that only V2R resonances were 7
irradiated. Subtraction of free induction decay with on- and off-resonance protein 8
saturation was achieved by phase cycling. A relaxation delay of 2.6s (Aq+D1) and 128 9
dummy scans were employed to reduce subtraction artifacts. Investigation of the time 10
dependence of the saturation transfer from 0.5 to 4 s with equally spaced 50-ms 11
Gaussian shaped pulses (separated by a 1-ms delay) showed that 2 s was needed for 12
efficient transfer of saturation from V2R to the AVP. A T1ρ filter of 30 ms was applied to 13
eliminate background resonances of V2R. The transient number was typically 4k. To 14
determine the specificity of STD signals, similar samples were prepared with the 15
antagonist TVP as competitor, using 3 µM V2R, 80 µM AVP and 550 µM TVP. The STD 16
effect was then calculated as (I0-Isat)/I0 where I0 and Isat are the intensities of one signal 17
in the reference NMR spectrum and in the on-resonance spectrum, respectively. 18
We discriminated the different molecular models issued from CG-MD simulations by 19
comparing the experimental STD values and the expected simulated STD from model 20
structures. Back calculation of STD intensities were calculated with the 3.8 version of 21
CORCEMA-ST software69. An order parameter value of 0.85 for methyl groups, and a Kon 22
value of a 108 s-1 value were used. The correlation times were set to 0.5 and 40 ns for the 23
free and bound states respectively. Calculations with different correlation time values 24
exploring the 0.2-2 ns and 10-30 ns for the free and bound forms, respectively, showed 25
that the simulated profiles, and in particular the correlation coefficient between 1
calculated and experimental values, were much more dependent on the template model 2
than on the correlation time values. Coefficient correlations between simulated and 3
experimental values were calculated for the whole peptide (residues 1-9). Mean 4
correlations factors R1-9 were calculated for five representative structures of each 5 cluster. 6 7 TR-FRET binding assays 8
V2R binding studies using TagLite® assays (Cisbio, Codolet, France) based on time-9
resolved-FRET measurements were previously described70,71. These are detailed in 10 Supplementary Methods. 11 12 cAMP accumulation assays 13
As for V2R binding studies, V2R functional studies based on time-resolved FRET 14
measurements were described previously39,26. These are detailed in Supplementary 15 Methods. 16 17 Data Availability 18
The cryo-EM density maps for the AVP-V2R-Gs-Nb35 complex have been deposited in 19
the Electron Microscopy Data Bank (EMDB) under accession code EMD-12128 (L state) 20
and EMD-12129 (T state). The coordinates for the models of AVP-V2R-Gs-Nb35 complex 21
have been deposited in the PDB under accession numbers 7BB6 and 7BB7 (L and T 22 states, respectively). We declare that the data supporting findings for this study are all 23 available upon request to the corresponding authors. 24 25
References 1 38. Morello, J. P., Bouvier, M., Petäjä-Repo, U. E. & Bichet, D. G. Pharmacological 2 chaperones: A new twist on receptor folding. Trends Pharmacol. Sci. 21, 466–469 3 (2000). 4 39. Jean-Alphonse, F. et al. Biased agonist pharmacochaperones of the AVP V2 5 receptor may treat congenital nephrogenic diabetes insipidus. J. Am. Soc. Nephrol. 6 20, 2190–2203 (2009). 7 40. Rasmussen, S. G. F. et al. Crystal structure of the human β2 adrenergic G-protein-8 coupled receptor. Nature 450, 383–387 (2007). 9 41. Mastronarde, D. N. Automated electron microscope tomography using robust 10 prediction of specimen movements. J. Struct. Biol. 152, 36–51 (2005). 11 42. Zivanov, J. et al. New tools for automated high-resolution cryo-EM structure 12 determination in RELION-3. Elife 7, 1–39 (2018). 13 43. Zhang, K. Gctf: Real-time CTF determination and correction. J. Struct. Biol. 193, 1– 14 12 (2016). 15 44. Tegunov, D. & Cramer, P. Real-time cryo-EM data pre-processing with Warp. 16 bioRxiv 338558 (2018) doi:10.1101/338558. 17 45. Grant, T., Rohou, A. & Grigorieff, N. cisTEM, user-friendly software for single-18 particle image processing. Elife 7, (2018). 19 46. Punjani, A., Rubinstein, J. L., Fleet, D. J. & Brubaker, M. A. CryoSPARC: Algorithms 20 for rapid unsupervised cryo-EM structure determination. Nat. Methods 14, 290– 21 296 (2017). 22 47. Heymann, J. B. Guidelines for using Bsoft for high resolution reconstruction and 23 validation of biomolecular structures from electron micrographs. Protein Sci. 27, 24 159–171 (2018). 25
48. Cardone, G., Heymann, J. B. & Steven, A. C. One number does not fit all: mapping 1 local variations in resolution in cryo-EM reconstructions. J. Struct. Biol. 184, 226– 2 36 (2013). 3 49. Terwilliger, T. C., Sobolev, O. V, Afonine, P. V & Adams, P. D. Automated map 4 sharpening by maximization of detail and connectivity. Acta Crystallogr. Sect. D, 5 Struct. Biol. 74, 545–559 (2018). 6 50. Webb, B. & Sali, A. Protein Structure Modeling with MODELLER. Methods Mol. Biol. 7 1654, 39–54 (2017). 8 51. Granier, S. et al. Structure of the δ-opioid receptor bound to naltrindole. Nature 9 485, 400–404 (2012). 10 52. Wu, C. K. et al. Structures of an unliganded neurophysin and its vasopressin 11 complex: Implications for binding and allosteric mechanisms. Protein Sci. 10, 12 1869–1880 (2001). 13 53. Rose, J. P., Wu, C., Hsiao, C., Breslow, E. & Wang, B. Crystal structure of the 14 neurophysin-oxytocin complex. Nat. Struct. Biol. 3, 163–169 (1996). 15 54. Schmidt, J. M. et al. Conformation of [8-arginine]vasopressin and V1 antagonists in 16 dimethyl sulfoxide solution derived from two-dimensional NMR spectroscopy and 17 molecular dynamics simulation. Eur. J. Biochem. 201, 355–71 (1991). 18 55. Ibrahim, B. S. & Pattabhi, V. Trypsin inhibition by a peptide hormone: Crystal 19 structure of trypsin-vasopressin complex. J. Mol. Biol. 348, 1191–1198 (2005). 20 56. Marrink, S. J., Risselada, H. J., Yefimov, S., Tieleman, D. P. & De Vries, A. H. The 21 MARTINI force field: Coarse grained model for biomolecular simulations. J. Phys. 22 Chem. B 111, 7812–7824 (2007). 23 57. Daura, X., Jaun, B., Seebach, D., van Gunsteren, W. F. & Mark, A. E. Reversible 24 peptide folding in solution by molecular dynamics simulation. J. Mol. Biol. 280, 25
925–932 (1998). 1 58. Abraham, M. J. et al. Gromacs: High performance molecular simulations through 2 multi-level parallelism from laptops to supercomputers. SoftwareX 1–2, 19–25 3 (2015). 4 59. Humphrey, W., Dalke, A. & Schulten, K. VMD: visual molecular dynamics. J. Mol. 5 Graph. 14, 33–38 (1996). 6 60. Igaev, M., Kutzner, C., Bock, L. V, Vaiana, A. C. & Grubmüller, H. Automated cryo-EM 7 structure refinement using correlation-driven molecular dynamics. Elife 8, (2019). 8 61. Wassenaar, T. A., Pluhackova, K., Böckmann, R. A., Marrink, S. J. & Tieleman, D. P. 9 Going Backward: A Flexible Geometric Approach to Reverse Transformation from 10 Coarse Grained to Atomistic Models. J. Chem. Theory Comput. 10, 676–90 (2014). 11 62. Best, R. B. et al. Optimization of the additive CHARMM all-atom protein force field 12 targeting improved sampling of the backbone φ, ψ and side-chain χ(1) and χ(2) 13 dihedral angles. J. Chem. Theory Comput. 8, 3257–3273 (2012). 14 63. Emsley, P. & Cowtan, K. Coot: Model-building tools for molecular graphics. Acta 15 Crystallogr. Sect. D Biol. Crystallogr. 60, 2126–2132 (2004). 16 64. Afonine, P. V et al. Joint X-ray and neutron refinement with phenix.refine. Acta 17 Crystallogr. D. Biol. Crystallogr. 66, 1153–63 (2010). 18 65. Chen, V. B. et al. MolProbity: all-atom structure validation for macromolecular 19 crystallography. Acta Crystallogr. D. Biol. Crystallogr. 66, 12–21 (2010). 20 66. Sharma, K. S. et al. Non-ionic amphiphilic homopolymers: synthesis, solution 21 properties, and biochemical validation. Langmuir 28, 4625–39 (2012). 22 67. Rahmeh, R. et al. Structural insights into biased G protein-coupled receptor 23 signaling revealed by fluorescence spectroscopy. Proc. Natl. Acad. Sci. U. S. A. 109, 24 6733–6738 (2012). 25
68. Mayer, M. & Meyer, B. Characterization of ligand binding by saturation transfer 1 difference NMR spectroscopy. Angew. Chemie - Int. Ed. 38, 1784–1788 (1999). 2 69. Krishna, N. R. & Jayalakshmi, V. Quantitative Analysis of STD-NMR Spectra of 3 Reversibly Forming Ligand-Receptor Complexes. Top Curr Chem 273, 15–54 4 (2008). 5 70. Zwier, J. M. et al. A fluorescent ligand-binding alternative using Tag-lite® 6 technology. J. Biomol. Screen. 15, 1248–59 (2010). 7 71. Loison, S. et al. Selective fluorescent nonpeptidic antagonists for vasopressin V₂ 8 GPCR: application to ligand screening and oligomerization assays. J. Med. Chem. 9 55, 8588–602 (2012). 10 11 12 13 14
Acknowledgements This work was supported by grants from FRM (grant 1
DEQ20150331736) and ANR (grant ANR-19-CE11-0014) and core funding from CNRS, 2
INSERM and University of Montpellier. The CBS is a member of the French 3
Infrastructure for Integrated Structural Biology (FRISBI) supported by ANR (ANR-10-4
INBS-05). J.B. was supported by a doctoral fellowship from the Ministère de 5
L’Enseignement Supérieur, de la Recherche et de l’Innovation. We thank the cryo-EM 6 staff at EMBL of Heidelberg (Germany) and the IGF Arpege platform of Pharmacology. 7 We thank Dr. Robert Healey for critical reading of the manuscript and Dr. Amin Sagar for 8 helping in software installation. 9 10
Author contributions J.B. purified V2R and AVP-V2R-Gs-Nb35 complexes, screened 11
samples by negative staining EM and cryo-EM, prepared grids, collected and processed 12
cryo-EM data, generated the cryo-EM maps and built some Extended data Figures. H.O. 13
managed the Sf9 cell culture and baculoviral infections, expressed and purified V2R, 14
purified AVP-V2R-Gs-Nb35 complexes, prepared grids for cryo-EM. N.F. developed the 15
CG-REMD modelling approach, fitted the models onto the cryo-EM maps and back-16
mapped the models to all-atom representation. C.L. built the final models of AVP-V2R-17
Gs-Nb35 complexes into cryo-EM and performed MD simulations. J. L-K-H and A. A. 18
screened samples by negative staining EM and prepared grids for cryo-EM. G.G. 19
contributed to the expression and purification of V2R. J. S-P expressed and purified Gs 20
protein and Nb35 nanobody. S.T. contributed to processing cryo-EM data for generating 21
cryo-EM maps. M.L. contributed to CG-REMD molecular dynamics modelling. S.G. 22
established all the initial procedures for the ternary complex purification. R.S. designed 23
Gs constructs, expressed and purified Gs protein and built most of the Figures. H.D. 24
managed STD NMR experiments and generated the STD NMR data. B.M. designed the 25
V2R construct and determined its pharmacological properties with the help of H.O. S.G. 1 P.B. and B.M. wrote the paper with the input from J.B., N.F. and H.D. Finally, S.G., P.B and 2 B.M. supervised the project. 3 4 Competing interests 5 The authors declare no competing interests. 6 7 Additional information 8 Supplementary information is available in the online version of the paper. 9 Correspondence and requests for materials should be addressed to S.G, P.B or B.M. 10 11 12