Publisher’s version / Version de l'éditeur:
Recent Research Developments in Materials Science - RESEARCH SIGNPOST, INDIA, 3, pp. 117-124, 2002-07-01
READ THESE TERMS AND CONDITIONS CAREFULLY BEFORE USING THIS WEBSITE. https://nrc-publications.canada.ca/eng/copyright
Vous avez des questions? Nous pouvons vous aider. Pour communiquer directement avec un auteur, consultez la
première page de la revue dans laquelle son article a été publié afin de trouver ses coordonnées. Si vous n’arrivez pas à les repérer, communiquez avec nous à PublicationsArchive-ArchivesPublications@nrc-cnrc.gc.ca.
Questions? Contact the NRC Publications Archive team at
PublicationsArchive-ArchivesPublications@nrc-cnrc.gc.ca. If you wish to email the authors directly, please see the first page of the publication for their contact information.
NRC Publications Archive
Archives des publications du CNRC
This publication could be one of several versions: author’s original, accepted manuscript or the publisher’s version. / La version de cette publication peut être l’une des suivantes : la version prépublication de l’auteur, la version acceptée du manuscrit ou la version de l’éditeur.
Access and use of this website and the material on it are subject to the Terms and Conditions set forth at
Nanostructural changes due to the removal of water from hydrated portland cement and other inorganic hydrates
Beaudoin, J. J.; Marchand, J.; Raki, L.
https://publications-cnrc.canada.ca/fra/droits
L’accès à ce site Web et l’utilisation de son contenu sont assujettis aux conditions présentées dans le site LISEZ CES CONDITIONS ATTENTIVEMENT AVANT D’UTILISER CE SITE WEB.
NRC Publications Record / Notice d'Archives des publications de CNRC: https://nrc-publications.canada.ca/eng/view/object/?id=361bfa18-e6df-400a-accf-29923a4466d5 https://publications-cnrc.canada.ca/fra/voir/objet/?id=361bfa18-e6df-400a-accf-29923a4466d5
Nanostructural changes due to the removal of water from hydrated Portland cement and other inorganic hydrates
Beaudoin, J.J.; Marchand, J.; Raki, L.
A version of this document is published in / Une version de ce document se trouve dans : Recent Research Developments in Materials Science, v. 3, 2002, pp. 117-124
www.nrc.ca/irc/ircpubs
NANOSTRUCTURAL CHANGES DUE TO THE REMOVAL OF WATER FROM HYDRATED PORTLAND CEMENT AND OTHER
INORGANIC HYDRATES
J. J. Beaudoin*, J. Marchand ** and L. Raki*
*Institute for Research in Construction, National Research Council of Canada, Ottawa, Ontario, Canada K1A 0R6
ABSTRACT
The removal of water from Portland cement hydrates results in irreversible volume changes that are concomitant to nanoscale changes in the structure of these materials. The flow of helium into spaces of nanodimensions vacated by water enables estimates of the density of the water and changes in solid volume, surface area, and pore structure descriptors. Influences regarding the nature and behavior of the layered calcium silicate hydrates (C-S-H) in Portland cement paste can be made from quantities derived from helium inflow measurements on drying experiments. Helium inflow measurements on other more well defined layered silicates e. g.
sepiolite have provided evidence that these techniques are sensitive to the structural events that occur on the incremental removal of water.
In addition study of the hydration of non-Portland cements (magnesium oxychloride and magnesium oxysulfate) and gypsum has established confidence in the physico-chemical and physico-mechanical interpretation of the quantities estimated by the helium inflow techniques. The recently determined multiple step dehydration-helium inflow characteristics of CuSO4. 5H2O reinforce the general conclusions drawn for Portland cement systems.
INTRODUCTION
An exact description of the structure of hydrated Portland cement paste at the nano level has not yet been possible [1, 2]. The role of water in this system has not been well defined. The removal of water from hydrated Portland cement paste results in solid volume changes that can be monitored using helium pychnometry. Spaces vacated by water removed from specimens equilibrated at the 11% RH condition can be quantified by measuring the amount of helium that has diffused into these locations within the solid structure. The significance of the inflow of helium gas into the nano structure of hydrated calcium silicate phases (C-S-H), present in Portland
cement binder systems is explored with reference to structural changes accompanying the dehydration of several compounds including hydrated tricalcium silicate, gypsum, magnesium oxysulfate hydrates, sepiolite and copper sulfate penta hydrate.
These “model” materials were selected to illustrate the ability of the helium inflow techniques to quantify the effect of the removal of water from hydrate systems that generally have a more well defined structure than that of C-S-H in hydrated Portland cement. The intent is to support the interpretation of the effects of water removal from the latter on nanostructural change.
EXPERIMENTAL Materials
C3S paste: The C3S used was prepared by calcination of CaCO3 and SiO2 and was grounded to a fineness of 3310 m2/g Blaine. It contained 0.4% free CaO. This material was supplied by the Portland Cement Association, USA. Specimens were prepared at water-solid ratios of 0.5 and 0.8 and were allowed to cure in the wet state in rubber membrane for
2.5 years. They were then cut in discs 3.2 cm in diameter and 1.25 mm thick for use as samples for helium flow and density measurements. Surface areas for the pastes were measured by nitrogen adsorption and found to be 56 and 67 m2/g for pastes with water-solid ratios of 0.5 and 0.5 respectively.
CaSO4. 2H2O: Reagent grade
CaSO4.2H2O powder was pressed into compacts (3.2 cm diameter
and 1.25 mm thick) at 680 MPa. These were conditioned at 11% RH and usesd in helium inflow experiments.
Sepiolite: Vallecas sepiolite was used for all sepiolite samples. The sepiolite sample contained minor amounts of quartz. Samples were prepared by compacting sepiolite powder into discs (3.2 cm in diameter and 1.25 mm thick) at pressures up to 680 MPa conditioning the compacts at 11 % RH preceded the helium inflow experiments.
Magnesium oxysulfate: Pastes were prepared at MgSO4.7H2O/MgO solution-solid ratios of 0.72 and 1.07. The MgSO4.7H2O solution was prepared with specific gravities of 1.18 and 1.303.
Samples were cured at 50% RH for 2 weeks. Discs (3.2 cm in diameter and 1.85 mm thick) were cut and stored at 11% RH for 3 months. These samples were then used for the helium inflow experiments.
CuSO4.5H2O: Reagent grade
CuSO4.5H2O was used. Powders were pressed into compacts (3.2 cm in diameter and 1.25 mm thick) at 680 MPa. The compacts were condioned to 11% RH prior to use in the helium inflow experiments. Portland cement paste: Portland cement (ASTM type I) was paste-hydrated at water-cement ratios 0.4-1.0 in 3.2 cm diameter cylinders for 2.5 years. Discs 1.25 mm think were cut and used as samples for helium inflow measurements.
PROCEDURES
Helium comparison pycnometry uses the gas laws and the ideal gas assumptions to calculate the solid volume of a sample. Small pores or interlayer spaces, which cause a delayed flow of helium into the sample, are in the first instance regarded as part of the solid.
The helium inflow and density curve measurements were obtained at different moisture contents, starting from the 11% RH condition at which the samples were originally stored. Moisture
was then removed incrementally by evacuation alone or heating plus evacuation for different periods of time. This was done in a separate vacuum vessel and the sample was then transferred to the pycnometer. Helium was allowed to flow into the sample for 40 h at 2 atm (0.2 MPa). Further details regarding the dehydration procedures for the various inorganic hydrates are presented in Table 1.
Table 1 Procedure for incremental removal of water for inorganic hydrates investigated
Material Dehydration Steps*
CaSO4.2H2O
C3S paste
Portland cement paste Sepiolite
Magnesium oxysulfate paste
CuSO4.5H2O
Heating in vacuo for 1 h at temperatures between 50 and 200°C Degassing in vacuo at 22°C followed by degassing at temperatures up to 100°C for various periods.
Same treatment as C3S paste.
Degassing in vacuo at temperature ranging from 40 to 850°C
Degassing in vacuo at temperatures ranging from 22 to 200°C
Degassing in vacuo at temperatures ranging from 30 to 400°C
*The duration of each dehydration step is about 1 hour
RESULTS AND DISCUSSION
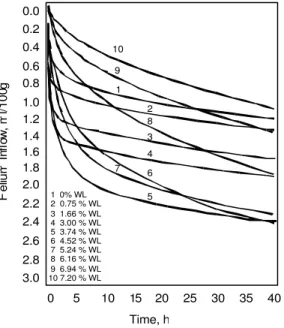
Helium inflow versus time curves Typical helium inflow versus time curves for tricalcium silicate paste (water: solid = 0.5) are presented in Figure 1 [3]. The total helium inflow as equilibrium is approached (usually about 40 h) increases as water is removed from the 11% RH condition. A maximum is reached at about 3.74 % weight loss. The curves cross
over and total inflow at 40 hours decreases as additional incremental water is removed. This evidence for nanostructural collapse will be documented further as this discussion progress. A similar pattern was observed for Portland cement paste.
The total helium inflow versus weight loss curves for sepiolite, magnesium oxysulfate, copper sulfate pentahydrate and gypsum
are more complex as they exhibit two or more maxima. [4-6].
Figure 1. Helium inflow into C3S paste
(water-solid ratio = 0.5) at different water contents as a function of time. Reference 3.
The curve for sepiolite (Figure 2) exhibits two maxima at about 6.5 and 12.5% weight loss [4]. Water in sepiolite is held in various states. Zeolitic water is lost at temperatures near 110°C. The first water of coordination at each edge Mg in the layered silicate structure is removed at 175°C under vacuum. The second water of coordination is removed at higher temperatures from collapsed channels where diffusion problems delay its escape from the crystal (anhydride forms at about 500°C). Octahedral hydroxyls react and disappear as water by 780°C. Removal of coordination water
corresponds to the positions of the two maxima. The decrease following each of the maxima is attributed to folding (structural collapse) of the sepiolite crystal. The folding processes, themselves, may produce trapped space into which helium may subsequently flow. Further weight loss probably involves dehydroxylation especially at the highest temperatures.
Figure 2. Total helium inflow at 40 hours versus weight loss for sepiolite which has been dried from 11% RH. Reference 4.
The relevant observation is that dehydration of sepiolite, a silicate with a reasonably well-defined structure results in a collapse of structure that can be detected by helium inflow measurements. It is argued that this is analogous to 0 2 4 6 8 10 12 14 16 18 Weight loss, % 0 1 2 3 4 5 6 T o ta l H e liu m I n fl o w , m l/ 1 0 0 g Sepiolite: 8MgO·12SiO ·nH O2 2 0.2 0.4 0.6 0.8 1.0 1.2 1.4 1.6 1.8 2.0 2.2 2.4 2.6 2.8 3.0 0.0 1 0% WL 2 0.75 % WL 3 1.66 % WL 4 3.00 % WL 5 3.74 % WL 6 4.52 % WL 7 5.24 % WL 8 6.16 % WL 9 6.94 % WL 10 7.20 % WL 5 0 10 15 20 25 30 35 40 Time, h H e liu m I nf lo w , m l/1 0 0g 10 1 2 9 3 4 8 6 7 5
behavior that occurs in the hydrated Portland cement and tricalcium silicate systems.
Two maxima were also observed when the total helium intake versus weight changes data was plotted for magnesium oxysulfate paste [5]. These maxima occurred after water was removed by heating in vacuo at approximately 100 and 150°C. Again these observations for the magnesium oxysulfate system are attributed to the creation of space occupied by water followed by a structural collapse resulting from the thermal decomposition of oxysulfate complexes at these temperatures. Processes that result in the opening of diffusion paths to previously discrete or trapped empty space can result in large increases in rate and amount of helium intake with very little weight change.
Two maxima were also observed in the total helium intake versus weight change plots for CaSO4.2H2O [6]. The maxima at weight changes values of 8.63 and 14.60 % correspond to 0.82 and 1.40 H2O molecules respectively. The decrease in helium intake between 8.63 and 12.79 % may be due to structural collapse of gypsum as holes due to dehydration increase. At 20.33% weight change there is a large increase in helium intake with a small weight change. Space has suddenly become accessible to
helium although there is ca. 0.58% water remaining in the sample possibly because water blocking some of the micropores has been removed.
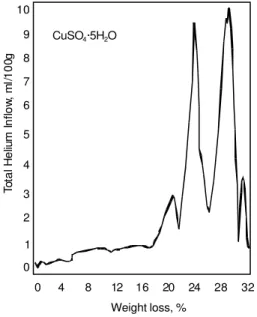
The total helium intake versus weight change curve for CuSO4.5H2O (Figure 3) exhibits fine zones and form well defined maxima. These occur at 6.5, 21.0, 23.0, 29.5 and 31.5% weight loss corresponding to 0.93, 2.9, 3.2, 4.1 and 4.4 moles of water. This corresponds to the fine endothermic effects observed in the DSC thermogram (not shown) at 50°Cm 100°C, 110°C, 140°C and 246°C. It is apparent that structural collapse occurs as holes form in the crystal due to the exit of water on drying.
Figure 3. Total helium inflow at 40 hours versus weight loss for CuSO4.
5H2O starting from the 11% RH
condition. 8 7 6 5 4 3 2 1 0 4 0 8 12 16 20 24 28 32 Weight loss, % T o ta l H e liu m I n fl o w , m l/ 1 0 0 g 9 10 CuSO ·5H O4 2
The ∆V-∆D parameter
The incremental removal of water (with reference to the 11% RH state) from the various hydrated systems investigated results in a decrease in solid volume. The negative volume change is denoted
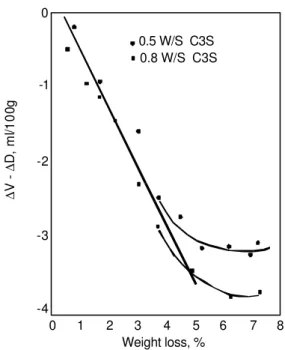
∆V [7]. The change in total helium inflow at 40 h is designated ∆D. An increase in helium inflow is regarded as a positive ∆D. The parameter ∆V-∆D is plotted against weight loss in Figure 4 for two C3S pastes [3]. This parameter can be regarded as the space vacated by the water. This quantity therefore enables the determination of the density of the water removed in addition to the actual solid density of the material. The curve in Figure 4 is linear up to about 4.5% weight loss. Beyond this weight loss there is only a small rate of change of ∆V-∆D. From the inverse of the slope of the straight line the average density of the water removed was 1.27±0.08 g/cc. It is suggested that helium is flowing into interlayer space and that collapse of structure (at 4.5% weight loss) limits the amount of helium able to penetrate the layers.
The ∆V-∆D versus weight loss curve can deviate from linearity due to structural collapse or the renewed accessibility of discrete empty space or trapped space.
Figure 4. Plot of the parameter, ∆V-∆D, as a function of weight loss for C3S
pastes prepared at water-solid ratios of 0.5 and 0.8. Reference 3.
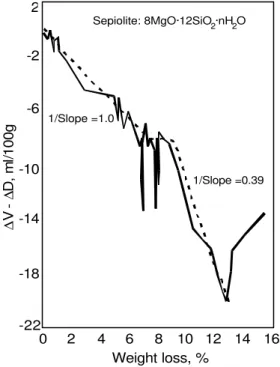
The latter occurrence would result in large increases in ∆V-∆D with small weight changes. A typical example is the curve for sepiolite, Figure 5 [5]. There is a linear dependence between the two terms up to a loss of approximately 6.80%. The inerse slope of this curve is approximately 1.00.
In the weight loss region 6.80-8.96% there are three occurrences of large changes in ∆V-∆D with very small increases in weight loss. The inverse slope of the curve up to 6.75% weight loss (1.00) represents the density of the
0 -1 -2 -3 -4 ∆ ∆ V -D , m l/1 0 0 g 0 1 2 3 4 5 6 7 8 Weight loss, % 0.5 W/S C3S 0.8 W/S C3S
zeolitic water, which has been removed from the molecular sized channels. The three verticle “spikes” are attributed to the diffusion of helium into empty discrete space, which has opened up during the folding of the crystal. Opening up and filling of discrete spaces has been observed in other systems [8].
Results of the regression analysis of the initial region of the ∆V-∆D versus weight loss curves for the various hydrates is presented in Table 2.
The inverse slope values represent the densities of the water removed from the nanospaces within the system. Values range from 1.00-1.40 g/cm3.
Errors in the calculation would obviously result if helium entered space, which was not water filled or if the space was inaccessible to helium. A higher value can also occur if previously water-filled space is incompletely filled with helium possibly because of structural collapse, which may involve a change in the dimension of pore entrances.
Estimates of the density of adsorbed water in clays of about 1.20 g/cc have been previously reported [9].
Figure 5. The parameter, ∆V-∆D, versus weight loss for sepiolite which has been dried from 11% RH. Reference 4.
Density Measurements
The merits of helium inflow as a nonstructural probe are particularly significant for estimates of solid density. The structural water that is removed from C-S-H for example changes the nature of the solid and occupies spaces that should enter into a density calculation. The use of water as a displacement fluid rehydrates the cement paste with the result that density values are too high. Density of D-dried cement paste determined using helium pycnometry is typically 2.19-2.27 g/cm3 and 2.60 g/cm3 with water as the fluid [10]. Density versus weight loss curves 0 2 4 6 8 10 12 14 16 Weight loss, % ∆ ∆ V -D , m l/ 1 0 0 g Sepiolite: 8MgO·12SiO ·nH O 2 2 -22 -18 -14 -10 -6 -2 2 1/Slope =1.0 1/Slope =0.39
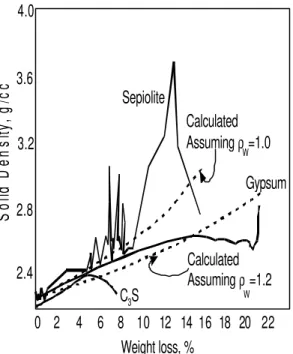
for sepiolite, gypsum and C3S paste are illustrated in Figure 6. The initial values are those typically reported for these systems at 11% RH. An increase in density value with water removal
is generally observed. Deviations above and below the linear portion of the curve are for reasons discussed above. These include effects due to collapse of nanostructure.
Figure 6. Solid density versus weight loss for C3S paste, gypsum, and sepiolite
determined from the 11% RH datum point.
Table 2. Inverse slopes of ∆V-∆D vs weight loss curves System Inverse slope
(g/cc)
Weight Loss Region (%)
Reference
CaSO4.2H2O
C3S paste
Portland cement paste
Sepiolite Magnesium oxysulfate paste CuSO4.5H2O 1.26 1.27 1.27 1.00 1.40 1.34 0-13.9 0-4.5 0-6.00 0-6.75 0-15.0 0-27.0 [6] [3] [7] [4] [5] This Work Sepiolite Calculated Assuming =1.0ρ W Gypsum Calculated Assuming =1.2ρ W 2.4 2.8 3.2 3.6 4.0 0 2 4 6 8 10 12 14 16 18 20 22 Weight loss, % S o lid D e n s ity , g /c c C S3
CONCLUSIONS
1. Helium inflow measurements provide the capability of monitoring nanostructural effects due the removal of water from inorganic hydrates including layered silicates in cement-based products.
2. Helium inflow measurements on C3S pastes are qualitatively similar to those formed for hydrated Portland cement.
3. Collapse of structure due to removal of water in hydrated Portland cement and other hydrates occurs and affects the inflow of helium into the material.
4. A parameter (∆V-∆D), which represents the space vacated by water via drying is the algebraic
sum of the solid volume change and total helium inflow. It is dependent on the change in water content and can be used to estimate the density of interlayer or crystal water.
5. The solid density of C-S-H (in Portland cement paste) and other inorganic hydrates changes with removal of non-structural water and can be determined by accounting for the space vacated by the water. 6. Factors influencing
physico-chemical processes due to removal of interlayer water or compositional water or other types of decomposition can be studied using helium pycnometric techniques.
REFERENCES
1. Feldman, R. F., 1971, High Res. Rec., 370, 8. 2. Jennings, H. M., 2000, Cem. Concr. Res., 30, 101. 3. Feldman, R. F., 1972, Cem. Concr. Res., 2, 123.
4. Beaudoin, J. J., and Grattan-Bellew, P., 1980, Cem. Concr. Res., 10, 347. 5. Beaudoin, J. J., and Feldman, R. F., 1977, Cem. Concr. Res., 7, 585. 6. Beaudoin, J. J., and Feldman, R. F., 1983, J. Chem. Soc. Far. Trans. I.,
79, 2071.
7. Feldman, R. F. 1971, Cem. Concr. Res., 1, 285.
8. Beaudoin, J. J., and Feldman R. F., 1978, Cem. Concr. Res., 8, 223. 9. Martin, R. T., 1962, Proc. Int. Conf. Clay Minerals, p 28.