HAL Id: hal-00331606
https://hal.archives-ouvertes.fr/hal-00331606
Submitted on 17 Oct 2008
HAL is a multi-disciplinary open access
archive for the deposit and dissemination of
sci-entific research documents, whether they are
pub-lished or not. The documents may come from
teaching and research institutions in France or
abroad, or from public or private research centers.
L’archive ouverte pluridisciplinaire HAL, est
destinée au dépôt et à la diffusion de documents
scientifiques de niveau recherche, publiés ou non,
émanant des établissements d’enseignement et de
recherche français ou étrangers, des laboratoires
publics ou privés.
Independent component analysis reveals the unity of
cognitive control
Clémence Roger, Christian G. Bénar, Franck Vidal, Thierry Hasbroucq, Boris
Burle
To cite this version:
Clémence Roger, Christian G. Bénar, Franck Vidal, Thierry Hasbroucq, Boris Burle. Independent
component analysis reveals the unity of cognitive control. Deuxième conférence française de
Neuro-sciences Computationnelles, ”Neurocomp08”, Oct 2008, Marseille, France. �hal-00331606�
INDEPENDENT COMPONENT ANALYSIS REVEALS THE UNITY OF
COGNITIVE CONTROL
C. Roger,
Laboratoire de Neurobiologie de la Cognition, Aix-Marseille Universit´e, CNRS,
Marseille, France [email protected]
C-G. B´enar, Epilepsie et Cognition
Aix-Marseille Universit´e, INSERM U751 Marseille, France
F. Vidal, T. Hasbroucq and B. Burle Laboratoire de Neurobiologie de la Cognition,
Aix-Marseille Universit´e, CNRS, Marseille, France
ABSTRACT
In reaction time tasks, when subjects commit an error, a negative wave peaking approximately 50-100 ms after the erroneous response is recorded with EEG. This negativ-ity, called “Error (Related) Negativity” (Ne or ERN[1, 2]), is maximal fronto-centrally, above the Anterior Cingulate Cortex and/or Supplementary Motor Area and was first in-terpreted as reflecting an error detection mechanism. How-ever, after Laplacian estimation, a similar component was later observed on correct trials [3]. If this component on correct trials were to be the same as the one observed on errors, this would put important constraints on computa-tional models of cognitive control. To address this issue we used Independent Component Analysis (ICA) to evaluate whether a single component (in ICA terms) could account for the waves observed in both erroneous and correct trials. For all the participants, a single component that accounts for the waves observed in the three categories of trials was found. The localisation of the sources is consistent with a rostral-cingulate zone origin, where control mechanisms are likely implemented [4]. This novel use of ICA allowed us to conclude that the negativities observed on error and correct trials are reflecting the same physiological mecha-nism whose amplitude is modulated as function of the per-formance.
KEY WORDS
Independent Component Analysis, Functional analysis, source localisation, EEG, Error Negativity
1
Introduction
Errors are essential to adapt our behaviour to the environ-ment. In the early 90’s, Falkenstein and colleagues [1] ob-served a fronto central EEG component just after subjects committed an error in reaction time (RT) task: a negative wave develops just before the response, and peaks between 50 and 100 ms after it. Since, with traditional monopo-lar recordings, this wave has originally been observed only in errors it was first interpreted as an “Error Detection”
mechanism and was called “Error Negativity” (Ne, [1]) or “Error-Related Negativity” (ERN, [2]). Source localiza-tion methods located the Ne in the anterior cingulate cortex and/or the supplementary motor area [5, 6]. A similar ac-tivity was later also observed on non-erroneous trials. Vidal et al. [3] analysed correct trials in which “partial error” oc-curred, that is a subthreshold EMG activity on the incorrect response muscle. The EEG data on the partial error EMG onset revealed a fronto-central negativity which a latency similar to the Ne recorded in overt errors but with a smaller amplitude. More importantly, after laplacian (or Current Source Density) computation, that dramatically improves the spatial resolution of EEG [7], they also observed a simi-lar negativity on correct trials. This “Ne-like wave” seemed to be a scaled-down Ne, with a smaller amplitude but the same topography as the negativities recorded in errors and in partial errors. If this “Ne-like” is indeed of same nature as the Ne on errors, its significance needs to be reconsid-ered. Although the very existence of this wave on correct trials has been disputed [8], it has been reported by sev-eral groups [9, 10, 11, 12], and there is now a conscensus on the existence of this wave [13]. The question remains, however, whether the negativities recorded in correct, er-ror and partial erer-ror trials reflect the same functional and physiological mechanism. Although Vidal and colleagues [3, 13] argued for a single process, Yordanova and collabo-rators [14] argued that the negativity on correct trials re-flects a different processes than the one reflected by the negativity on errors: they reported that on correct trials the topography of the negativity is lateralized toward the hemisphere controlateral to the responding hand whereas on errors, the topography is central. They also reported that time-frequency characteristics of the two waves are differ-ent. The debate on the origin of these negativities is im-portant since it largely constraints the neurocomputational model of cognitive control.
1.1
Independent Component Analysis to
evaluate the unicity of those waves
We assessed the unicity of those waves with Independent Component Analysis (ICA), one of the blind source sepa-ration (BSS) algorithms. When the signals recorded by dif-ferent sensors are a linear mixture of independent sources, with different sensors corresponding to different mixture of the source, BSS allows to recover the original sources at the origin of the recorded signals. Within this frame-work, ICA tries to separate the raw data into components by seeking a decomposition that maximizes the indepen-dence between the extracted components. This methodol-ogy is well adapted to EEG since ”ICA algorithms have proved capable of isolating both artefactual and neurally generated EEG sources [15, 16] whose EEG contributions, across the training data are maximally independent of one another”[17]. We reasoned that, if the three negativities recorded on errors, partial errors and correct trials reflect different mechanisms, the ICA algorithm will not be able to find any single component accounting for those three waves, whereas, if they correspond to the same physio-logical phenomenon whose amplitude is modulated, they should be accounted for by a single component (in ICA terms). If a component of this type exists in all subjects, we will localize them with a dipolar inverse problem method-ology. In parallels, we will localize the Ne in errors, in partial errors and in correct trials. Then we will able to compare the results of the ICA component localization and the EEG data localization. This new analysis will probably help us to conclude on the origin(s) of the negativities.
2
Methods
2.1
Participants
Ten subjects aged from 20 to 31 years (mean: 25 years) volunteered for this experiment. All of them were right-handed and had normal or corrected-to-normal vision.
2.2
Task and recordings
The participants performed the Eriksen’s flanker task [18]. On each trial, three letters were presented to participants who had to respond to the central one (target) while ig-noring the others (distractors). They ran 20 experimen-tal blocks of 128 trials each. Electroencephalographic ac-tivity (EEG) was recorded with 64 Ag/AgCl scalp elec-trodes and electromyographic activity (EMG) from the flexor pollicis brevisof each hand was recorded by paired surface Ag/AgCl electrodes (BIOSEMI Active-two elec-trodes, Amsterdam). For further details, see [19]
2.3
EEG Data analysis
The trials were sorted as function of the nature of the re-sponse. We distinguished three types of trial: correct, er-ror and partial erer-ror trials. The two first types are charac-terized by full blown EMG bursts on the side of the cor-rect or the erroneous response, respectively. The third one is characterized by a small incorrect EMG burst followed by a correct EMG burst. EEG data were analyzed time-locked to the correct EMG onset for correct trials, and to the incorrect-EMG onset on errors and on partial errors.
2.4
Independent Component Analysis (ICA)
The monopolar recordings were segmented in windows centered on EMG onset for each trial (from -400 to 400 ms). For each electrode, all the segments were paste to create a single time–course vector. Those vectors were composed of all the segments of all trial types (correct, errors and partial errors). This resulted in a matrix of size (number of segments × number points per segment)×number of electrodes in which each line corresponds to the electrical activity recorded by one electrode and each columns corresponds to a time step. Note that the data matrix is mainly com-posed of correct trials (76.8%) compared to errors and partial errors trials (5.2% and 18% respectively).
ICA algorithm decomposes the input matrix X (elec-trodes space) into two new matrices:
X = A × S.
where A is the mixing matrix, and S the time-course of the sources. The A matrix (size: sources × electrodes) repre-sent the contribution of each source to each captor. Those values are time-independent and each column of the A ma-trix corresponds to the topography of one source. The S matrix is organized as the X matrix, with lines correspond-ing to sources (instead of captors) and rows correspondcorrespond-ing to the time-course.
ICA computations were performed with EEGLAB software [17]. The infomax ICA algorithm (function runica()) was used. The time course of the compo-nents were then averaged (time–locked to EMG onset, see above), for the three types of trials separately.
For each participant, we searched for a component with a fronto-central distribution and with a time course in errors trials that fits the one of the Ne recorded in errors trials after the Laplacian transform. Note that the selec-tion of the component of interest was based only on errors. Once the component was selected, we evaluated if the av-eraged time-course of this component on partial errors and on correct trials correspond to the time-course of the EEG Laplacian data on partial errors and correct trials. We also localized the source of interest thanks to the “Dipfit” plug-ins of EEGLAB for each subject. We then compared those components localization with a source localization of the raw data using the LORETA algorithm [20].
a b c
d e
Figure 1. In the three graphs the time-zero corresponds to the EMG onset. Colours correspond to the nature of the trial: error trials (red), partial errors (green) and correct trials (blue). (a) grand average of the monopolar data (µV ) and (b) Laplacian ones (in µV /cm2), (c) grand
average of the ICA component (in arbitrary units). (d) the 3-D topography of the grand average Ne in partial errors. (e) topographical 2-D scalp map of the ICA-components selected for their fronto-central distribution from each of 10 participants
3
Results
As expected, in both monopolar EEG data and after the Laplacian estimation, the Ne is clearly visible in errors and in partials errors trials (the red and the green line in Fig.1a and Fig.1b). The scalp distribution of the Ne is fronto-central (FCz electrode, Fig.1d) and its amplitude is higher in errors than in partial error trials. Note that, on correct trials, no Ne–like activity is visible on monopolar record-ings. Such a component emerges after laplacian compu-tation (blue line Fig.1b) although its amplitude is much smaller.
For all the participants, ICA was able to find a single component with a fronto-central distribution (Fig.1e), and whose time-course accounts for the Ne on errors (Fig.1c). More importantly, the averaged time course of the same component for correct and partial-error revealed a smaller negativity just after EMG onset, whose time course and am-plitude nicely fit the one of the Laplacian transformed data (Fig.1b, Fig.1c).
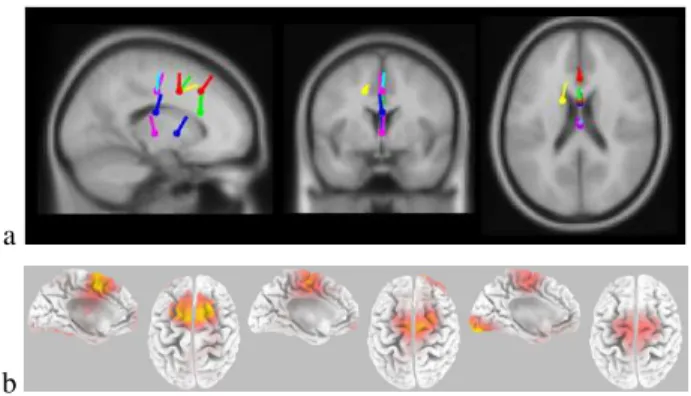
The localizations of the selected sources for each indi-vidual subjects (Fig 2a) revealed a clear cluster of sources in the Rostral Cingulate Zone [4], although some sources are a bit deeper. LORETA applied to the raw data on errors and partial error trials confirms the clear localization in the ACC and/or the SMA, as already reported (Fig 2b). More importantly, the localization in correct trials also shows an activity focused in the Rostral Cingulate Zone which is known to be involved on cognitive control mechanism [4].
4
Discussion
ICA is a powerful algorithm to recover the sources at the origin of a mixed signal, and is therefore often used to
sep-a
b
Figure 2. (a) Dipole localisation of the ICA component projected in a brain template. (b) Solutions of the LORETA inverse problem at timing when the negativity is at its maximum in the three categories of trials: in errors on the left panel at 173 ms post-EMG, in partial errors on the middle panel at 96 ms post-EMG and correct trials on the right panel at 119 ms post-EMG .
arate activities. In the present study, we used it in a slightly different way, since we investigated whether a single com-ponent could account for electrical activities in different conditions. To do so, we applied ICA on a dataset matrix containing all the trial types of interest. After the extraction of a component for one condition, we analyzed whether this component could account for the other conditions. In the present case, this new approach revealed that the Ne ob-served on error and the “Ne–like” obob-served on correct trials can be accounted for by a single process, hence revealing the unicity of the processes underlying those activities. In-deed, although the time course may appear slightly differ-ent for correct trials, maybe signaling some later activity more intense for erroneous trials, this activity on correct trials was identified as the same as on errors by ICA. This unicity has important consequences for neural-modeling of cognitive control, since it shows that the difference between correct and erroneous trials, is a matter of degree, not a matter of nature.
Another conclusion that derives from the present study is the proximity of the results obtained with two mathematically independent source separation methods. Indeed, as can be seen from Figure 1a, on monopolar recordings, the “Ne-like” wave is not observable on cor-rect trials. It was, however, revealed by laplacian compu-tation [3, 13], which acts as a high-pass spatial filter [7]. The same holds for the present data: a negative wave ap-pears after laplacian computation. Interestingly, the time course and the topographies of the laplacian transformed data nicely fit with the ICA component ones. However, although both laplacian and ICA aim at separating over-lapping sources, their mathematical foundations are com-pletely different, and there is thus no theoretical reason to expect such a similarity. The fact that these two methods lead to very similar results strengthen the validity of those findings.
Acknowledgements
This work was supported by a doctoral grant from the French Ministry of research to C.R., a CNRS grant “Neu-roInformatique” and by a European COST grant BM0601 NeuroMath to B.B.
References
[1] M. Falkenstein, J. Hohnsbein, J. Hoormann, and L. Blanke. Effects of crossmodal divided attention on late ERP components. II. Error processing in choice reaction tasks. Electroencephalography and Clinical Neurophysiology, 78:447–455, 1991.
[2] W. J. Gehring, B. Goss, M. G. H. Coles, D. E. Meyer, and E. Donchin. A neural system for error detection and compensation. Psychological Science, 4(6):385– 390, 1993.
[3] F. Vidal, T. Hasbroucq, J. Grapperon, and M. Bonnet. Is the “error negativity” specific to errors? Biological Psychology, 51:109–128, 2000.
[4] K. R. Ridderinkhof, M. Ullsperger, E. A. Crone, and S. Nieuwenhuis. The role of the medial frontal cortex in cognitive control. Science, 306:443–447, 2004. [5] S. Dehaene, M.I. Posner, and D.M. Tucker.
Localiza-tion of a neural system for error detecLocaliza-tion and com-pensation. Psychological Science, 5:303–305, 1994. [6] V. van Veen and C. Carter. The timing of
action-monitoring processes in the anterior cingulate cortex. Journal of Cognitive Neuroscience, 14(4):593–602, 2002.
[7] F. Babiloni, F. Cincotti, F. Carducci, P. M. Rossini, and C. Babiloni. Spatial enhancement of EEG data by surface Laplacian estimation: the use of magnetic resonance imaging-based head models. Clinical Neu-rophysiology, 112:724–727, 2001.
[8] M. G. H. Coles, M. K. Scheffers, and C. B. Holroyd. Why is there an ERN/Ne on correct trials? Response representations, stimulus-related components, and the theory of error-processing. Biological Psychology, 56:173–189, 2001.
[9] J. M. Ford. Schizophrenia: the broken p300 and be-yond. Psychophysiology, 36:667–682, 1999.
[10] M. Falkenstein, J. Hoormann, S. Christ, and J . Hohnsbein. ERP components on reaction errors and their functional significance: a tutorial. Biological Psychology, 51:87–107, 2000.
[11] P. Luu, T. Flaisch, and D. M. Tucker. Medial frontal cortex in action monitoring. Journal of Neu-rosciences, 20(1):464–469, 2000.
[12] B. Suchan, D. Zoppelt, and I. Daum. Frontocentral negativity in electroencephalogram reflects motor re-sponse evaluation in humans on correct trials. Neuro-science Letters, 350(2):101–104, Oct 2003.
[13] F. Vidal, B. Burle, M. Bonnet, J. Grapperon, and T. Hasbroucq. Error negativity on correct trials: a re-examination of avalaible data. Biological Psychology, 64:265–282, 2003.
[14] J. Yordanova, M. Falkenstein, J. Hohnsbein, and V. Kolev. Parallel systems of error processing in the brain. NeuroImage, 22:590–602, 2004.
[15] S. Makeig, M. Westerfield, T. P. Jung, J. Covington, J. Townsend, T. J. Sejnowski, and E. Courchesne. Functionally independent components of the late pos-itive event-related potential during visual spatial at-tention. Journal of Neurosciences, 19(7):2665–2680, Apr 1999.
[16] T-P. Jung, S. Makeig, M. Westerfield, J. Townsend, E. Courchesne, and T. J. Sejnowski. Analysis and visualizations of single-trial event related potentials. Human Brain Mapping, 14:166–185, 2001.
[17] A. Delorme and S. Makeig. EEGLAB: an open source toolbox for analysis of single-trial EEG dynamics. Journal of Neuroscience Methods, 134:9–21, 2004. [18] B. A. Eriksen and C. W. Eriksen. Effects of noise
let-ters upon the identification of target letter in a non-search task. Perception & Psychophysics, 16:143– 149, 1974.
[19] B. Burle, C. Roger, S. Allain, F. Vidal, and T. Has-broucq. Error negativity does not reflect conflict: A re-appraisal of conflict monitoring and Anterior Cin-gulate Cortex activity. Journal of Cognitive Neuro-science, 20:1637–1655, 2008.
[20] R. D. Pascual-Marqui, C. M. Michel, and D. Lehmann. Low resolution electromagnetic tomography: a new method for localizing electri-cal activity in the brain. International Journal of Psychophysiology, 18:49–65, 1994.