Publisher’s version / Version de l'éditeur:
Nondestructive Characterization of Materials VIII, pp. 27-32, 1998
READ THESE TERMS AND CONDITIONS CAREFULLY BEFORE USING THIS WEBSITE. https://nrc-publications.canada.ca/eng/copyright
Vous avez des questions? Nous pouvons vous aider. Pour communiquer directement avec un auteur, consultez la
première page de la revue dans laquelle son article a été publié afin de trouver ses coordonnées. Si vous n’arrivez pas à les repérer, communiquez avec nous à [email protected].
Questions? Contact the NRC Publications Archive team at
[email protected]. If you wish to email the authors directly, please see the first page of the publication for their contact information.
NRC Publications Archive
Archives des publications du CNRC
For the publisher’s version, please access the DOI link below./ Pour consulter la version de l’éditeur, utilisez le lien DOI ci-dessous.
https://doi.org/10.1007/978-1-4615-4847-8_5
Access and use of this website and the material on it are subject to the Terms and Conditions set forth at
High frequency laser-ultrasonics
Moreau, A.; Lord, M.
https://publications-cnrc.canada.ca/fra/droits
L’accès à ce site Web et l’utilisation de son contenu sont assujettis aux conditions présentées dans le site LISEZ CES CONDITIONS ATTENTIVEMENT AVANT D’UTILISER CE SITE WEB.
NRC Publications Record / Notice d'Archives des publications de CNRC:
https://nrc-publications.canada.ca/eng/view/object/?id=bc1ce715-7d09-4a7c-b80c-e95a0c283bea https://publications-cnrc.canada.ca/fra/voir/objet/?id=bc1ce715-7d09-4a7c-b80c-e95a0c283bea
HIGH FREQUENCY LASER-ULTRASONICS
A. Moreau and M. Lord Industrial Materials Institute
National Research Council of Canada 75 de Mortagne Blvd.
Boucherville, Québec, J4B 6Y4
ABSTRACT
The usual frequency bandwidth of laser-ultrasonics is in most cases of order 1 to 30 MHz. Although this is sufficient for most applications, applications involving attenuation measurements in weakly attenuating materials, or velocity measurement in thin samples or coatings may require a much higher detection bandwidth. By shortening the generation light pulse and improving the interferometer electronics, laser-ultrasonic bandwidths of 500 MHz were achieved. Much higher bandwidths (up to 100 GHz) have been achieved by others using delayed femtosecond laser pulses, but what distinguishes our technique is the capability to acquire a full A-scan with a single generation pulse. The capabilities of high frequency laser-ultrasonics will be illustrated with measurements in aluminum foil and sheet, fused quartz, and galvanized steel.
INTRODUCTION
The usual frequency bandwidth of laser-ultrasonics is in most cases of order 1 to 30 MHz. The most important factors that determine the ultrasonic bandwidth are the optical penetration depth of the material and the generation laser pulse duration. In metals, the penetration depth is very small and it has been shown that very short pulses of light may be used to generate high frequency ultrasound. In particular, frequencies as high as 50 to 100 GHz were obtained using laser pulses of 100 to 200 fs duration and delayed probing
techniques.1,2 In this paper, a 2.5 ns fwhm excimer laser was used to generate ultrasound in
the frequency bandwidth of 10 to 500 MHz. The experimental setup will be discussed first with a special emphasis on the characterization of the Fabry-Pérot interferometer used to detect the high frequency ultrasound. Then, selected examples will be shown to illustrate the characteristic behavior of the system, and to indicate potential applications of high-frequency laser-ultrasonics to weakly attenuating or thin materials
EXPERIMENTAL SETUP
All ultrasonic measurements presented in this paper were made by generating on one side of a sample, and detecting on the other side. The excimer (KrF) generation laser produced UV (248 nm) light pulses of roughly 100 mJ which were weakly focused to a square or rectangular area of 4 to 10 mm to a side. This produced an irradiance of roughly
40 to 250 MW/cm2, which corresponds to the beginning of the ablation regime in metals.
The detection light source was a 3 kW (peak power) long-pulse (50µs fwhm), Nd:YAG (1.06 µm) laser focused to a circular area of 4 mm diameter. An attenuator keeps the received light peak power below 300 mW to avoid saturating the photodetector.
To detect the ultrasound, a 50 cm confocal Fabry-Pérot interferometer was used in the reflection mode. Its detection electronics was carefully redesigned. A fast photodiode was coupled to a high-pass filter followed by a DC-500 MHz amplifier. The first low-pass RC time constant of the detection circuit (300 MHz) was set by the internal capacitance of the photodiode and the 50 Ohm load impedance. However, given that simple RC filters have a rolloff of only 6 dB per octave, the detection interferometer worked well up to the cutoff frequency of the amplifier (more than 500 MHz).
The confocal Fabry-Pérot interferometer has the great practical advantage of being
able to process multiple speckles without loss of signal to noise ratio.3 Therefore, it is
especially well suited for detection on rough surfaces. However, the amplitude and phase response depend on the frequency of the ultrasound. The response predicted in the
literature4was computed with the parameters of our interferometer (mirror reflectivities of
91 an 99.5%, 50 cm cavity length). This was compared to that measured using a laser beam
modulated in phase and amplitude using a electrooptic cell.5 The results are shown in
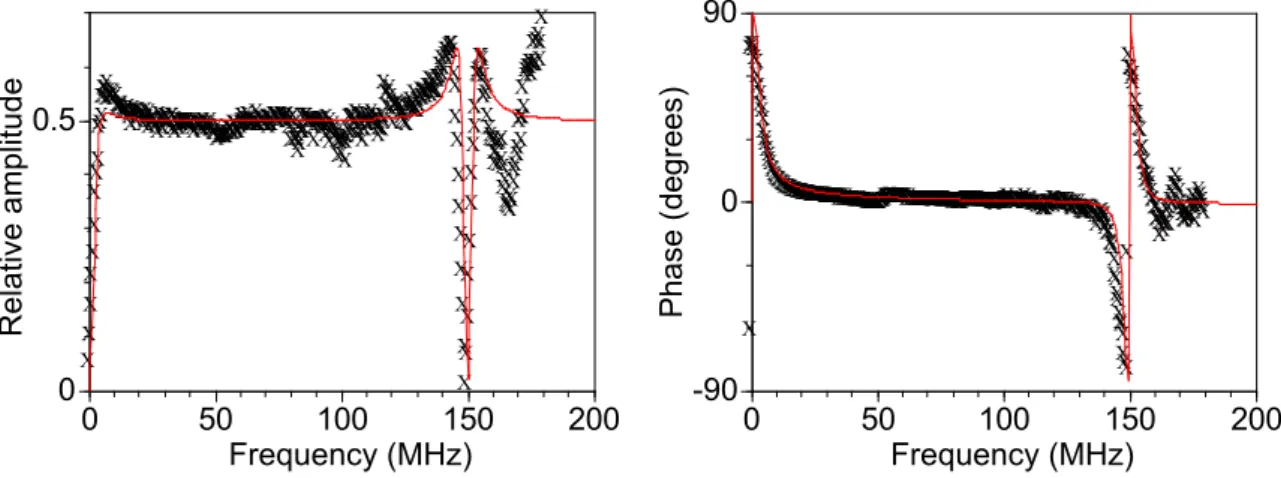
Figure 1. One can see that the interferometer has a nearly flat amplitude and phase response with rejection bands beginning at zero frequency and every 150 MHz thereafter. These rejection bands are approximately 10 MHz wide, except near zero frequency, where the rejection bandwidth is approximately 5 MHz wide.
X X X XX X XX X XXX XXXXXXXXXXXXXXXXXX X XXXXXXXXXXXXXXXXXXXXXXX XXXXXXXXXXXXXXXXXXXXXXXXXXXXXXXXXXXXXXXXXXXXXXXXXXXXXXXXXXXX XXXXXXXXXXXXXXXXXXXXXXXXXXXXXXXXXXXXXXXXXXXXXXXXXXXXXXXXXXXXXXXXX XXXXXXXXXXXXXXXXXXXXXXXXXXXXXXX X X X XXXXXXX XXXXXXXXX X XXXXXXXXXXXXXXXXXXXXXXXXXXXXXXX XXX XXXX XXXXXXXXXXXXXXXXXXX X XXXXXXXXXXXXX X XXXXXXXX XXXXXXXXXXXXX X X X X X X X X X X X X X X X X XX X XXXXXX X X X X XX X XXX XXXXX X X X XXX XXXXX X X XXX X X XX X X X X XXXXXXXXX X X XX 0 0.5 0 50 100 150 200 Relative amplitude Frequency (MHz) X X XXXX X XX X XX X XX X XXX XXXXX XXXXXXXXXXXXXXXXXXXXXXXXXXXXXXXXXXXXXXXXXXXXXXXXXXXXXXXXXXXXXXXXXXXXXXXXXXXXXXXXXXXXXXXXXXXXXXXXXXXXXXXXXXXXXXXXXXXXXXXXXXXXXXXXXXXXXXXXXXXXXXXXXXXXXXXXXXXXXXXXXXXXXXXXXXXXXXXXXXXXXXXXXXXXXXXXXXXXXXXXXXXXXXXXXXXXXXXXXXXXXXXXXXXXXXXXXXXXXXXXXXXXXXXXXXXXXXXXXXXXXXXXXXXXXXXXXXXXXXXXXXXXXXXXXX XXXXXX X X XX X X X X XX X XX X XX XXX X X X XX X XX X X X XXXX X X XXX XX X XXXXXXXXXXX XXXXXX X XXX X XXXXXXXXXXXXXXXXX -90 0 90 0 50 100 150 200 P ha se ( de gr ee s) Frequency (MHz)
Figure 1. Amplitude and phase response of the Fabry-Pérot interferometer: theory (solid line) and experiment (dots). The experimental signal to noise ratio was very poor above 160 MHz.
The effect of these rejection bands on the ultrasonic signal is observed when the bandwidth exceeds 150 MHz. Figure 2 compares the ultrasonic signal measured using the
Fabry-Pérot interferometer to that obtained using a photorefractive interferometer.6 The
rejection bands of the Fabry-Pérot interferometer cause oscillations to follow the laser-generated longitudinal acoustic pulse (negative displacements correspond to outwards motion of the surface). These oscillations are not observed with the photorefractive interferometer because its response is completely linear below the cutoff frequency of the photodetectors and above the response frequency of the photorefractive crystal (100 kHz).
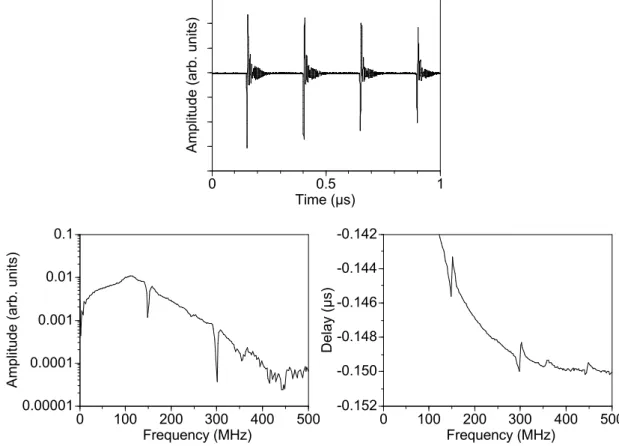
Effects of the response of the Fabry-Pérot interferometer can also be observed on the ultrasonic signal obtained in a 6061-T6 aluminum plate of 800 µm thickness (Figure 3). Ripples similar to those observed in Figure 2 are observed in the time domain. However, in the frequency domain, the first four rejection bands are clearly observed. Although the theory predicts zero amplitude response at the bottom of the rejection bands, the finite resolution of the Fourier transform techniques utilized to analyze the data limits the sharpness of the measurement. The zero-frequency rejection band is also widened by a 100 MHz high-pass filter. This filter reduces the low-frequency amplitude because otherwise, the dynamic range of the digitizer would be exceeded. The theory also predicts 174°, 288°, and 174° phase shifts at the 150, 300, and 450 MHz rejection bands. This
corresponds to delay shifts of 3.2, 2.7, and 1.1 ns. This is experimentally observed in Figure 3 as three sudden discontinuities in the arrival time of the first echo as a function of frequency. Again, the finite resolution of the Fourier transform reduces the amplitude of the discontinuities below the predicted values. However, the relative amplitudes of the three discontinuities, 2.3, 1.7, and 0.7 ns, agree with the prediction. No explanation is offered for another apparent discontinuity in the amplitude and delay spectra near 350 MHz.
150 200 250 300 350 400
Amplitude (arb. units)
Time (ns)
Fabry-Perot
Photorefractive
Figure 2. High frequency ultrasonic signal in a fused quartz sample measured with a Fabry-Pérot interferometer and a photorefractive interferometer. The 150 MHz oscillations are due to the filtering effect of the Fabry-Pérot interferometer. The generation laser area measured 10x12 mm and the generation surface was lightly oiled. This A-scan is a single trace sampled at 5 GSamples/second using an 8-bit digitizer.
0 0.5 1
Amplitude (arb. units)
Time (µs) 0.00001 0.0001 0.001 0.01 0.1 0 100 200 300 400 500 A m pl itu de ( ar b. u ni ts ) Frequency (MHz) -0.152 -0.150 -0.148 -0.146 -0.144 -0.142 0 100 200 300 400 500 Delay (µs) Frequency (MHz)
Figure 3. Top: Amplitude as a function of time (A-scan) showing the first four acoustic echoes in an 800 µm thick aluminum plate (grade 6061-T6). Left: Amplitude spectrum and Right: Delay spectrum of the first echo. Signal to noise ratio reaches unity near 500 or 600 MHz. The two spectra were calculated from the A-scan using a 350 ns rectangular window and Fourier transform techniques. The generation laser area measured 4x8 mm. Average of 400 traces sampled at 5 GSamples/second using an 8-bit digitizer.
APPLICATIONS
Ultrasonic Attenuation in an 800 µm Thick Aluminum Plate
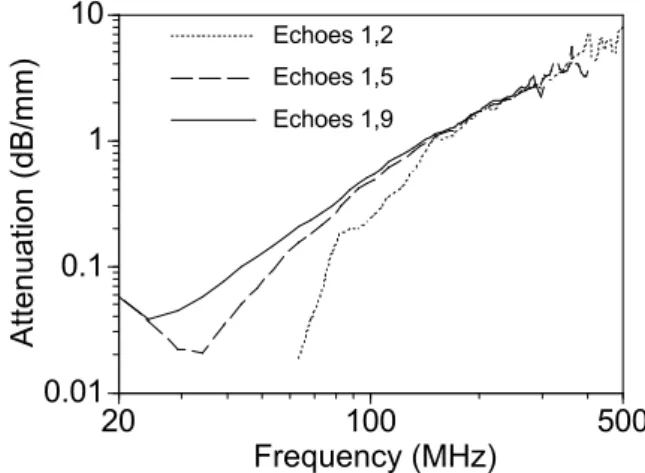
The fine grain size and low single crystal anisotropy of aluminum cause low ultrasonic attenuation in this material. However, ultrasonic attenuation caused by grain scattering, absorption, or other effect, generally increases with frequency. Therefore, high frequency laser-ultrasonics may be used to measure ultrasonic attenuation in aluminum and other weakly attenuating materials. Figure 4 shows the attenuation spectrum obtained using Fourier transform techniques on pairs of echoes in the same 800 µm aluminum plate as shown in Figure 3. It is best to utilize the first two echoes to measure attenuation at high frequencies because the highest frequency components are below the noise level of subsequent echoes. At low frequencies, however, the attenuation is so low that measurement accuracy is much improved if the first echo is compared to a more distant echo. The effect of diffraction must also be considered. The large dimensions of our source (4x8 mm) insures that the measurement is made in the near acoustic field. The Fresnel
parameter s = z/a2, where is the acoustic wavelength (= 640 µm at 10 MHz from
ref. 7), z is the distance from the source (z = (2n - 1) * 800 µm, where n is the echo number), and a is the radius of the source (3 mm) is approximately equal to 0.057 for the first echo at 10 MHz. One may assume that no diffraction correction is required when s < 0.3 and detection occurs over an area comparable to the generation area.7 Here, this
inequality is verified for frequencies higher than 32 MHz for the ninth or earlier echoes. It is interesting to note the absence of anomaly in the attenuation spectrum near 150 and 300 MHz. In theory, no signal is detected at these frequencies and the measured attenuation should be random. However, the finite resolution of the Fourier transform methods used to obtain the attenuation spectrum smoothes out this anomaly. Also, as mentioned earlier, the amplitude response of the Fabry-Pérot interferometer is nearly flat between the rejection bands, but it is not exactly flat. However, because these distortions apply in the same way to both echoes, they have no effect on the attenuation spectrum.
0.01 0.1 1 10 20 100 500 Attenuation (dB/mm) Frequency (MHz) Echoes 1,2 Echoes 1,5 Echoes 1,9
Figure 4. Attenuation spectra in an 800 µm thick aluminum plate. Blackmann-Harris windows of 200 ns and Fourier transform techniques were used to obtain these spectra from Figure 3.
Thickness and Attenuation Measurement in a 17 µm Thick Aluminum Foil
Thin materials present a challenge for ultrasonic measurement through the thickness because, at low frequencies, the echoes cannot be resolved in the time domain. In the frequency domain, the simple through-transmission configuration utilized here excites the natural resonances in the foil thickness. Because the foil is very thin, these resonances occur at high frequencies.
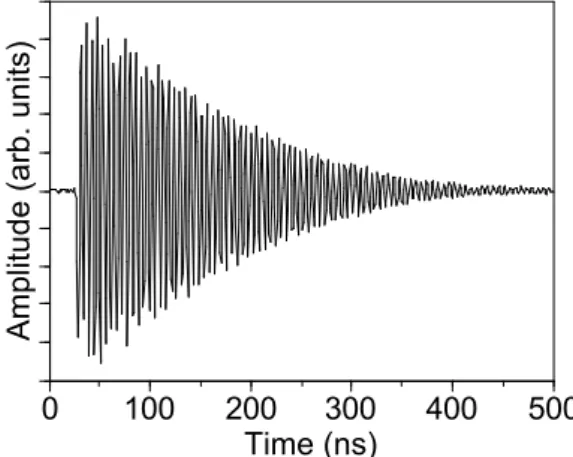
Figure 5 shows the signal obtained in an aluminum foil of the type sold in supermarkets. The amplitude spectrum shows a strong resonance at 184 MHz in the
thickness of the foil (the second harmonic could also be observed at 365 MHz). Using an
ultrasonic velocity of 6410 m/s for an isotropic aggregate,8this resonance can be used to
calculate the foil thickness. The value obtained, 17.4 µm, agrees with that measured using a hand-held micrometer (17 ± 1 µm). Because a single frequency is present, and because the experiment is in the very near acoustic field (s << 0.1), the ultrasonic attenuation may be measured from the decay of the signal envelope in the time domain. This procedure yields a value of approximately 100 dB/µs, or 16 dB/mm. This is substantially more than that observed in the 800 µm plate.
0 100 200 300 400 500
Amplitude (arb. units)
Time (ns)
Figure 5. Ultrasonic signal in a 17 µm thick aluminum foil. The generation laser area measured 6x7 mm. Average of 100 traces sampled at 1 GSamples/second using an 8-bit digitizer.
Coating Thickness Measurement for Galvanized Steel
Another area of potential application of high frequency laser-ultrasonics is to obtain information about coatings. Again, multiple echoes in the coating thickness occur at high frequencies. Figure 6 compares the ultrasonic signal obtained in a hot-dipped galvanized, high-strength low-alloy (HSLA) steel sheet of 1.38 mm thickness, to that obtained in the same sheet after the two coatings were removed by dissolving them in dilute HCl acid.
0 0.5 1
Signal Amplitude (arb. units)
Time (µs)
Bare
Galvanized
Figure 6. Laser-ultrasonic signal in a bare and hot-dipped galvanized sample of HSLA steel. The generation laser area measured 5x4 mm. Average of 25 traces sampled at 1 GSamples/second using an 8-bit digitizer.
Inspection of the first echo in the galvanized samples reveals a second negative pulse of 10 to 40 % of the amplitude of the first pulse. This second pulse occurs 23 ns after the arrival of the first pulse. Because the acoustic impedance of zinc is less than that of iron, the generated acoustic pulse interferes constructively with echoes that travel an even number of times through the coating thickness. Therefore, this second negative pulse would
have traveled four times the coating thickness. In between these two negative echoes, there should be a positive echo corresponding to the first round trip through the zinc thickness. This may be observed by comparing the signal obtained on the coated sheet to that obtained on the bare sheet: the positive echo manifests itself in the higher “positive overshoot” for the coated sheet. Using the ultrasonic velocity of the isotropic aggregate
(approximately 4100 m/s),7 one then calculates that the zinc coating had a thickness of
24 µm. On the other hand, the coating is known to have a preferential [0001] texture. Assuming an ideal [0001] texture, the ultrasonic velocity would be 2983 m/s and the estimated coating thickness would be 17.5 µm. The actual thickness was measured by weighting a sample before and after removing the coatings, and by dividing half the missing mass by the mass density of zinc. A value of 16.4 µm was obtained. This is somewhat lower than that measured using ultrasonics, but other factors such as chemical and phase composition of the coating may affect the measurement.
In Figure 6, it may also be noticed that the arrival time of the various echoes is earlier in the bare sample because the two zinc coatings were removed. Assuming that only the coatings (no steel) were removed, then the arrival time of the first echo in the bare sample should precede that of the galvanized sample by the travel time through twice the coating thickness, i.e. by 11.5 ns. The measured value was 11 ns.
CONCLUSION
The extension of the capabilities of laser-ultrasonics to frequencies as high as 500 MHz was demonstrated. Examples were shown using weakly attenuating or thin samples. In particular, ultrasonic attenuation was measured in an 800 µm aluminum plate to frequencies as high as 500 MHz; the thickness and ultrasonic attenuation at 184 MHz of a 17 µm thick aluminum foil was obtained from the first two acoustic through-thickness resonances; and the thickness of zinc coatings was measured on a hot-dipped galvanized HSLA steel sheet. The non-contact nature of laser-ultrasonics is a great advantage in doing such high-frequency measurements because no coupling material needs to be characterized and because no fancy alignment of transducers is required. Moreover, the measurements are very quick: all A-scans presented for metallic samples may be obtained without sample preparation and within seconds after the sample is mounted in front of the lasers. Finally, the authors believe that with shorter laser pulses and faster electronics, much higher frequencies could be obtained.
ACKNOWLEDGMENT
This work was funded in part by the American Iron and Steel Institute and the United States Department of Energy.
REFERENCES
1 C. Thomsen, H. T. Grahn, H. J. Maris, and J. Tauc, Surface generation and detection of phonons by
picosecond light pulses, Phys. Rev. B, 34:4129-4138 (1986).
2Curtis Jon Fiedler. The Interferometric Detection of Ultrafast Pulses of Laser Generated Ultrasound, Report
WL-TR-96-4057, Materials Directorate, Wright Laboratory, Air Force Material Command, Wright-Patterson Air Force Base, OH 45433-7734, Final report, 1 April 1996.
3J.-P. Monchalin, Optical detection of ultrasound, IEEE Trans. Sonics, Ultrasonics, Freq. Control.
UFFC-33:485-499 (1986).
4J.-P. Monchalin, R. Héon, P. Bouchard, C. Padioleau, Broadband optical detection of ultrasound by optical
sideband stripping with a confocal Fabry-Perot, Appl. Phys. Lett. 55:1612-1614 (1989).
5P. Basséras, A. Moreau, and J.-P Monchalin, unpublished (1994).
6A. Blouin and J.-P. Monchalin, Detection of ultrasonic motion of a scattering surface by two-wave mixing
in a photorefractive GaAs crystal, Appl. Phys. Lett., 65:932-934 (1994).
7 J.-D. Aussel and J.-P. Monchalin, Measurement of ultrasound attenuation by laser ultrasonics, J. Appl.
8 G. Simmons and H. Wang. Single Crystal Elastic Constants and Calculated Aggregater Properties: A