Publisher’s version / Version de l'éditeur:
Vous avez des questions? Nous pouvons vous aider. Pour communiquer directement avec un auteur, consultez la
première page de la revue dans laquelle son article a été publié afin de trouver ses coordonnées. Si vous n’arrivez pas à les repérer, communiquez avec nous à PublicationsArchive-ArchivesPublications@nrc-cnrc.gc.ca.
Questions? Contact the NRC Publications Archive team at
PublicationsArchive-ArchivesPublications@nrc-cnrc.gc.ca. If you wish to email the authors directly, please see the first page of the publication for their contact information.
https://publications-cnrc.canada.ca/fra/droits
L’accès à ce site Web et l’utilisation de son contenu sont assujettis aux conditions présentées dans le site LISEZ CES CONDITIONS ATTENTIVEMENT AVANT D’UTILISER CE SITE WEB.
Additive Manufacturing, 35, 2020-05-11
READ THESE TERMS AND CONDITIONS CAREFULLY BEFORE USING THIS WEBSITE. https://nrc-publications.canada.ca/eng/copyright
NRC Publications Archive Record / Notice des Archives des publications du CNRC :
https://nrc-publications.canada.ca/eng/view/object/?id=8394f3dc-c8c5-4f51-a6f6-cdaa6d6bc35f https://publications-cnrc.canada.ca/fra/voir/objet/?id=8394f3dc-c8c5-4f51-a6f6-cdaa6d6bc35f
This publication could be one of several versions: author’s original, accepted manuscript or the publisher’s version. / La version de cette publication peut être l’une des suivantes : la version prépublication de l’auteur, la version acceptée du manuscrit ou la version de l’éditeur.
For the publisher’s version, please access the DOI link below./ Pour consulter la version de l’éditeur, utilisez le lien DOI ci-dessous.
https://doi.org/10.1016/j.addma.2020.101203
Access and use of this website and the material on it are subject to the Terms and Conditions set forth at
Assessing the robustness of powder rheology and permeability measurements
Lefebvre, L. P.; Whiting, J.; Nijikovsky, B.; Brika, S. E.; Fayazfar, H.; Lyckfeldt, O.
Assessing the Robustness of Powder Rheology and Permeability Measurements.
1 2
L.P. Lefebvre1, J. Whiting2, B. Nijikovsky3, S.E. Brika3, H. Fayazfar4, O. Lyckfeldt5
3 4 5
1National Research Council Canada, 75 de Mortagne, Boucherville (QC), H1Y 2V9, Canada.
6
2Engineering Laboratory, National Institute of Standards and Technology (NIST), Gaithersburg,
7
MD 20899, USA
8
3Laboratoire sur les alliages à mémoire et les systèmes intelligents (LAMSI), École de
9
technologie supérieure ,1100 Notre-Dame Ouest, Montréal (QC), Canada H3C1K3
10
4Multi-Scale Additive Manufacturing Lab, Mechanical and Mechatronics Engineering
11
Department, University of Waterloo, Waterloo, ON, N2L 3G1, Canada
12
5RISE IVF AB, Argongatan 30, SE-431 53 Mölndal, Sweden 13
Corresponding author: Louis-Philippe Lefebvre: louis-philippe.lefebvre@cnrc-nrc.gc.ca,
450-14 641-5031, 15 16 Highlights: 17
Factors affecting the powder rheology measurements and results variability.
18 19
Abstract
20
Powder metallurgy processes rely on powder flowability. However, flowability is not an intrinsic
21
property and depends on the measurement conditions. Standards have been developed to adjust
22
measurement methods to various flow conditions but there is presently questions whether current
23
methods are adapted to the specific requirements of powder bed additive manufacturing.
24
Rheology has been used to assess powder flowability but there is still limited information
25
available on the robustness of the method. This paper presents the flow characteristics measured
26
in five laboratories with a powder rheometer. Attempts were made to understand the sources of
27
intra and inter laboratory variations and find ways to reduce them. The variations do not seem to
28
be associated with sampling or environmental conditions. Experimental setup, calibration and/or
29
the modification of the powder during handling could be associated with the variations observed.
30
However, additional tests would be required to confirm the sources and improve the repeatability
31 of the measurements. 32 33 34 35 36 37 38 39 40 41 42 43 44 45
46
Graphical Abstract
47
48
Keywords:Powder flowability, rheology, round robin, reproducibility,repeat abilit y. 49 50 51 1. Introduction 52 53
There is an interest to quantify how powder flows and associate the values measured with
54
powder behavior during a fabrication process [1]. Flowability is affected by many powder
55
characteristics (e.g., particle size distribution, morphology, presence of satellites, density, and
56
surface interaction) as well as the environmental and handling conditions (e.g., humidity,
57
temperature, atmosphere, and measurement method). Depending on the manufacturing process,
58
powders are exposed to different flow conditions, including plastic, inertial, fluidized, and
59
entrained flow [2].
60 61
It is recognized that powder flowability has an important impact on additive manufacturing
62
(AM) processes. For the powder bed fusion process, part quality relies on the characteristics of
63
the powder layer (conductivity, density, uniformity) spread during the manufacturing process
64
and the presence of defects in the powder layer. Besides, build rate and productivity are affected
65
by the time to spread the powder layer, which is a function of the powder flowability. However,
66
the correspondence between powder performance in powder bed fusion machines and powder
67
properties is not yet understood and therefore cannot be used to control final part properties. AM
68
machine users have reported that powders appearing to be identical when measured using
69
standardized methods may behave differently in the machines. Recently, America Makes &
70
ANSI AMSC Standardization Roadmap for Additive Manufacturing [3] reported that existing
71
standards for flowability do not account for the range of conditions that a powder may encounter
during the AM processes and R&D is needed to measure and quantify flowability, and increase
73
process productivity and robustness. Therefore, reliable measurement methods are required for
74
the wide acceptance and adoption of AM technologies by industry.
75 76
Quantification of the flowability of powders is important for different reasons including quality
77
control, powder selection, certification, simulation, research and product development. For
78
qualification and quality control purposes, the method must be simple, robust and widely
79
available. In addition to these requirements, flexibility and precision are required for research
80
activities. Different techniques have been developed to quantify powder flowability. The most
81
common methods are based on funnel discharge time measurements such as the Hall flowmeter.
82
The methods are covered by various standards (MPIF [4], ATSM [5] and ISO [6]) and are
83
extensively used in industry. One of the advantages of these methods is their simplicity and
84
accessibility (i.e., relatively low cost and rapid compared with more sophisticated methods).
85
One of the limitations of the approach comes from its inability to quantify the flowability when
86
the powder doesn’t flow through the orifice of the funnel. Other funnel flow meters (Carney,
87
Gustavsson) have been developed to compensate for this limitation. These techniques reproduce
88
relatively well the way the powder flows in an open funnel. However, they do not correspond to
89
the conditions encountered in various processes (e.g., spreading thin layers of powder as is the
90
case in the powder bed fusion process). The Hausner Ratio (ASTM D7481 [7]), defined as the
91
ratio of the tapped density and the apparent density, has also been used to quantify powder
92
cohesion.
93 94
B.H.Kayes [8,9] studied the avalanching behavior of a powder using a rotating disc filled with
95
powder and described the pattern of events generated by an avalanching powder using fractal
96
geometry. A strange attractor plotted in discreet time maps were used to evaluate the effect of
97
particle size distribution, humidity, and temperature on the rheological behaviour of powders.
98
Avalanche concept was recently adapted to develop commercial systems [10,11] that have
99
generated interest in the powder metallurgy community. Different flow indicators such as the
100
avalanche angle ordynamic angle of repose, avalanche energy, surface fractal and linearity, or
101
deviations in any of these metrics can be used to quantify the flow characteristics of the powders.
102 103
The flowability can also be evaluated by measuring the cohesion between particles using
104
rheology approaches, by measuring the resistance of a powder to flow (e.g., resistance seen by a
105
blade when moving through a cylinder filled with powder) or shear tests (ASTM D6467 [12] and
106
D3080/D3080M [13]). Commercial equipment has been developed to conduct such tests
107
[14,15,16]. These methods have recently generated interest to qualify the flowability for powder
108
metallurgy applications and additive manufacturing.
109 110
In order to use flowability tests for quality control, certification, simulation, research and product
111
development, it is essential to evaluate the repeatability and robustness of the methods. Data
112
obtained in an interlaboratory study performed by seven laboratories and presented in the ASTM
113
B213-17 standard indicated that the relative reproducibility of Hall flow can be as high as 21 %
114
[5]. More recently, results obtained by 19 different laboratories in a proficiency program
115
organized by the ASTM B09 committee showed a large span in the results and relative standard
116
variations (average 32.4 s ± 5.9 s) with AM grade Ti6Al4V powders [17]. These variations may
be problematic when comparing results from different laboratories or if results cannot be
118
reproduced within a laboratory.
119 120
The objective of the work presented in this paper was to investigate the inter-laboratory
121
variability of the rheology method to quantify the flowability of a Ti6Al4V powder (15 µm to 63
122
µm sieve range), typically used in powder bed fusion AM processes. Both resistance to flow and
123
permeability were evaluated. The tests were conducted in different laboratories and were
124
measured by different operators using the same equipment and procedures.
125 126
2. Experimental Procedures
127
All tests were conducted with a plasma atomized Ti6Al4V grade 23 (15 µm to 63 µm sieve
128
range) powder (from AP&C, a GE additive company1). Scanning electron micrographs of the
129
powder were taken at different magnifications using a Hitachi S-4700 scanning electron
130
microscope. The particle size distribution was evaluated using laser diffraction (Beckman
131
Coulter LS 13 320, 0.4 µm to 2000 μm range, dry measurement using the Tornado DPS module).
132
The powder, from the same batch, was split into five polyethylene bottles (1.5 kg each) using a
133
2-sides splitter (i.e., SP-171X from Gilson) employing a combination of splitting and
134
recombination to make sure the samples were similar and homogeneous. A bottle was sent to
135
five different laboratories to conduct different tests (stability, variable flow tests, aeration and
136
permeability) using the same model of powder rheometer (FT4 from Freeman Technology, a
137
Micromeritics company). The five laboratories that participated in the study were the National
138
Research Council Canada (Canada), the National Institute of Standards and Technology (USA),
139
the Multi-Scale Additive Manufacturing (MSAM) at the University of Waterloo (Canada), RISE
140
AB (Sweden), and the École de Technologie Supérieure (Canada).
141 142
All rheology tests were done in triplicate after conditioning the powder using the instrument
143
manufacturer’s suggested methodology. The rheology tests were conducted using a 25 mm x 25
144
ml split vessel. The splitting device, provided with the instrument, is intended to provide a fixed
145
volume and mass of powder. The conditioning, recommended by the rheometer manufacturer,
146
consisted of gently disturbing the powder using the blade as it enters in the powder and rotating
147
clockwise to create a lightly packed test sample prior to testing. This conditioning was used to
148
prepare the sample in a reproducible manner, removing stress history or excess air prior to the
149
measurements and to minimise the effect of handling the powder prior to the measurements (i.e.,
150
reduce operator to operator variability).
151 152
Flow tests (stability, variable flow and aeration) were evaluated by measuring the powder
153
resistance when moving a rotating stainless-steel blade (23.5 mm diameter) in a glass cylinder
154
(borosilicate, 25 mm internal diameter) filled with powder (see Figure 1). The powder resistance
155
was measured using torque (resolution 0.002 mNm) and linear force (resolution 0.0001 N)
156
sensors. The energy (integral of the energy gradient over the distance travelled) was calculated
157
1Certain commercial entities, equipment, or materials may be identified in this document in order to describe an
experimental procedure or concept adequately. Such identification is not intended to imply recommendation or endorsement by the participating laboratories, nor is it intended to imply that the entities, materials, or equipment are necessarily the best available for the purpose.
using the resultant of the torque and linear forces as the blade was moving downward and forcing
158
the powder towards the bottom of the cylinder.
159 160
The stability tests were done by measuring the flow energy for seven identical repeat tests on
161
each sample, with conditioning of the powder prior to subsequent tests. The speed of the tip of
162
the blade was fixed at 100 mm/s. The Basic Flowability Energy (BFE) index, used as a measure
163
of powder flowability, represents the energy measured at test repeat #7, as set in the FT4
164
procedure. The sensitivity of the flow energy to shear rate (see Figure 2) was evaluated using the
165
variable flow rate tests (energy vs tip speed). These tests were conducted by measuring the flow
166
energy with tip speed varying from 100 mm/s down to 10 mm/s. The flow rate index (FRI),
167
defined as the ratio of the values measured at 10 mm/s divided by the value measured at 100
168
mm/s, was used as an index of the sensitivity of flowability to the shear rate (i.e., tip speed).
169
Stability and variable flow rate tests were done in the same cycle but the results are presented
170
separately in the results section.
171 172
The sensitivity of the flowability to air flow was evaluated using aeration tests. These tests were
173
done by measuring the flow energy as a function of dry air flow rate introduced through a porous
174
mesh at the base of the cylinder (35 ml). The flow energy was measured in a similar way to the
175
stability and variable flow tests. The range of air velocity was varied from 0 mm/s to 10 mm/s,
176
with a conditioning before each test cycle. The maximum of 10 mm/s was selected to minimise
177
the formation of dust clouds out of the cylinder during the measurements. The aeration ratio was
178
evaluated at two air flow rates (4 mm/s and 10 mm/s). AR_4 was derived by dividing the flow
179
energy measured at 0 mm/s by the value measured at 4 mm/s while AR_10 was derived by
180
dividing the flow energy measured at 0 mm/s by the value measured at 10 mm/s.
181 182
The resistance to air flow was measured by evaluating the pressure drop across the volume of
183
powder while air was flowing (at a constant 2 mm/s) through the powder-filled cylinder (25 mm
184
diameter, 10 ml glass vessel). The powder was subjected to varying vertical loads via a vented
185
piston (i.e., applied consolidation pressure). The measurements were done under different
186
applied consolidation pressures (0 kPa to 15 kPa). The results are reported as the pressure drop
187
as a function of the applied consolidation pressure. Values measured at 15 kPa were compared to
188
assess the reproducibility of the measurements.
189 190
For all tests, three specimens (i.e., three different powder samples) were characterised in each
191
laboratory using the manufacturer’s recommended procedure. A first set of experiments,
192
henceforth referenced as round 1, were conducted with no other recommendations than those
193
provided in the FT4 user manual. A second series of tests, henceforth referenced as round 2, was
194
subsequently conducted using a procedure with tighter constraints for the operator to see if the
195
variability could be reduced. Also, during these tests, each laboratory recorded the temperature
196
and humidity level with a hygrometer. Standard deviations reported were calculated using the
197
Bessel's correction to provide an adjustment for the bias associated with the small sample data (3
198
data point per conditions). Deviations were also calculated for all BFE data points (30 points: 3
199
replicates in 5 laboratories measured in 2 rounds).
201
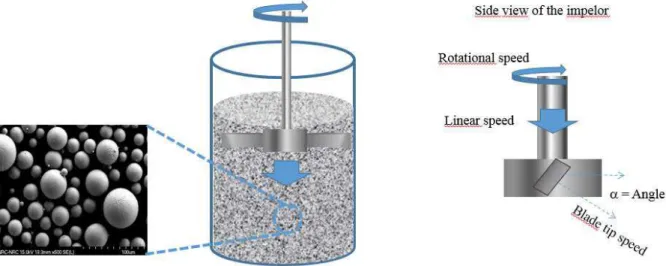
Figure 1: Schematic description of the method to measure the flow energy showing the movement
202
of the blade and the method to calculate the tip speed. [18]
203 204
205 206
Figure 2: Schematic representation of the results obtained with the FT4 rheometer. The first
207
seven measurements are conducted at constant tip speed of 100 mm/s to evaluate the stability of
208
the measurements. The seventh measurement was used as the basic flow energy (BFE) index.
209
Measurements 8 to 11 were obtained by varying the tip speed from 100 mm/s down to 10 mm/s
210
to investigate the effect of shear rate. While the stability and variable flow tests were conducted
211
during the same test, they are reported separately in the result section.
212 213 214 215
3. Results.
216
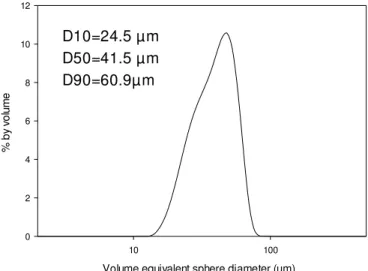
Figure 3 presents low (100x) and high (500x) magnification images of the powder. Images show
217
that the powder is highly spherical with minimal satellites. The laser diffraction particle size
218
distribution of the powder is shown in Figure 4. The measured particle size distribution agrees
219
roughly with the sieve range provided by the manufacturer (15 µm to 63 µm). Table 1 presents
220
different indices measured in the 5 laboratories in round 1.
221 222 223 224 225 226 227 228 229 230 231 232 233 234 a) b) 235
Figure 3: SEM micrographs of the Ti6Al4V powder used in this study: a) low magnification
236
and b) high magnification.
237
Volume equivalent sphere diameter (µm)
10 100 % by v ol u m e 0 2 4 6 8 10 12 238
Figure 4: Particle size distribution of the powder investigated in this study (measured by Laser
239
Diffraction, Beckman Coulter LS 13 320) with corresponding D10, D50 and D90 that represent
240
the intercepts at 10%, 50% and 90% of the cumulative mass (dry measurement).
241 242
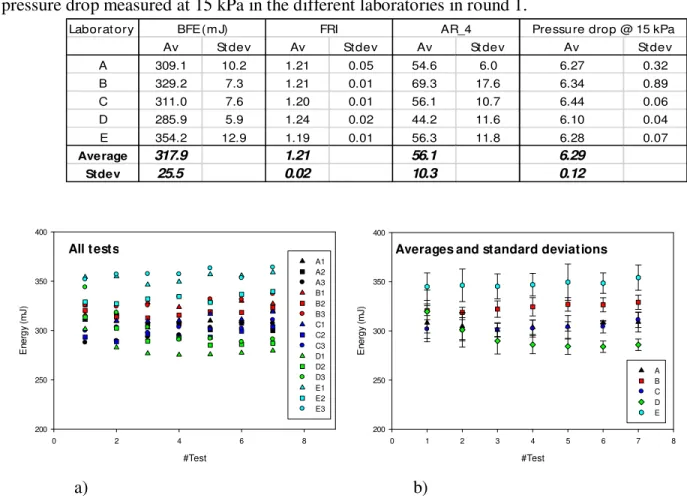
Figure 5 presents the results of the stability tests measured in the different laboratories (Figure 5a
243
presents all results and Figure 5b the averages and standard deviations in each lab). The results
244
indicate that the values are relatively stable during the test (curves are flat and the energy does
245
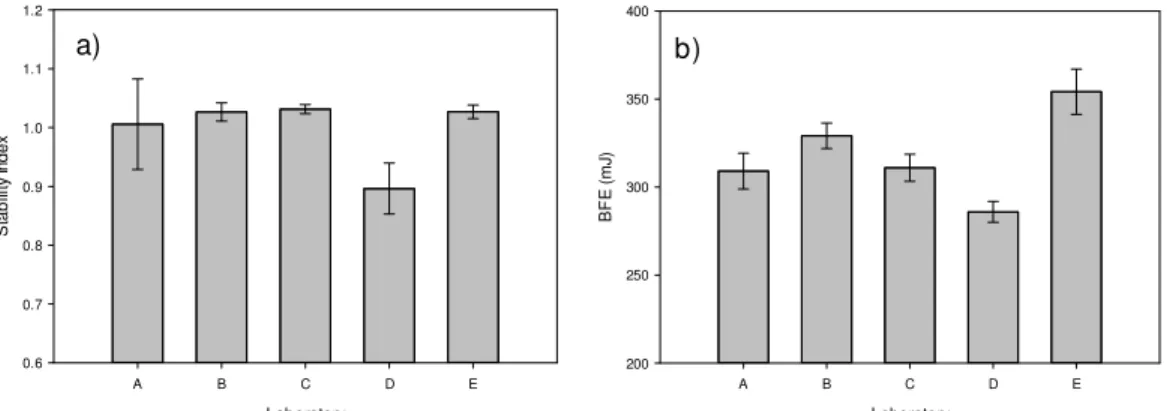
not vary a lot during a test). Indeed, Figure 6a shows the stability indices (i.e., value measured
246
during test #7 divided by value measured during test #1) are close to one for most laboratory.
247
D10=24.5 µm D50=41.5 µm D90=60.9µm
This suggests that the powder is relatively stable and not significantly altered during the tests by
248
consolidation, attrition, agglomeration, electrostatic charging, shear and/or humidity
249
sorption/desorption. However, there are differences between the laboratories: the
inter-250
laboratory variability is higher than the intra-laboratory variability. This observation is coherent
251
with the comparison of the basic flow energy index (BFE, test #7 reported in Figure 6b for all
252
laboratories) that shows there are variations from lab to lab and these variations are more
253
important than those measured within each laboratory. When analysing all BFE results (three
254
measurements done in the five different laboratories), the values range from 279 mJ to 364 mJ,
255
with an average of 318 mJ ± 25 mJ (see Table 1). The spread between the minimum and
256
maximum values (85 mJ) is significant and represent a relative variation ((Max-Min)/Average)
257
of 27 %.
258 259
Table 1: Basic flow energy (BFE), the flow rate index (FRI), the aeration index (AR_4
260
representing the value measured at v = 0 mm/sec divided by the value measured at 4 mm/sec) and
261
pressure drop measured at 15 kPa in the different laboratories in round 1.
262 263 264 265 266 267 268 269 270 271 #Test 0 2 4 6 8 E n e rg y (m J) 200 250 300 350 400 A1 A2 A3 B1 B2 B3 C1 C2 C3 D1 D2 D3 E1 E2 E3 #Test 0 1 2 3 4 5 6 7 8 E n e rg y ( m J) 200 250 300 350 400 A B C D E 272 a) b) 273
Figure 5: Stability test results (round 1) a) all data points recorded by the different laboratories
274
and b) averages and standard deviations for each laboratory.
275
Laborat ory
Av St dev Av Stdev Av St dev Av Stdev
A 309.1 10.2 1.21 0.05 54.6 6.0 6.27 0.32 B 329.2 7.3 1.21 0.01 69.3 17.6 6.34 0.89 C 311.0 7.6 1.20 0.01 56.1 10.7 6.44 0.06 D 285.9 5.9 1.24 0.02 44.2 11.6 6.10 0.04 E 354.2 12.9 1.19 0.01 56.3 11.8 6.28 0.07 Average 317.9 1.21 56.1 6.29 Stdev 25.5 0.02 10.3 0.12
BFE (m J) FRI AR_4 Pressure drop @ 15 kPa
Laboratory A B C D E S tab ili ty In dex 0.6 0.7 0.8 0.9 1.0 1.1 1.2 Laboratory A B C D E B F E (mJ ) 200 250 300 350 400 276
Figure 6: a) Stability index (energy at Test #7 divided by the energy at Test #1) and b) averages
277
and standard deviations of BFE index (Test #7 in figure 5b) measured by all laboratories in
278
round 1.
279 280
The effect of the tip speed is presented in Figure 7. While the effect of the shear rate appears to
281
be similar for all labs (i.e., all measurements show the same trend), a spreading of the results is
282
observed, for reasons similar to those observed in the stability tests (Figure 5). Indeed, the
283
variations at 100 mm/s are similar to those observed in the stability test. Once again, the
inter-284
laboratory variations are greater than the intra-laboratory variations. The Flow Rate Index (FRI,
285
Figure 8) is similar for all labs with low standard deviations, confirming that the effect of the tip
286
speed was similar for all tests.
287
Tip speed (mm/sec)
20 40 60 80 100 120 E nergy ( m J ) 200 250 300 350 400 450 A1 A2 A3 B1 B2 B3 C1 C2 C3 D1 D2 D3 E1 E2 E3
Tip speed (mm/sec)
0 20 40 60 80 100 120 E n e rg y (mJ ) 200 250 300 350 400 450 A B C D E 288 a) b) 289
Figure 7: Effect of the tip speed on the flow energy a) all data measured and b) averages and
290
standard deviations measured by the different laboratories.
291
Laboratory A B C D E FR I 1.00 1.05 1.10 1.15 1.20 1.25 1.30 292
Figure 8: Flow rate index (averages and standard deviations) obtained in the different
293
laboratories. The flow rate index represents the flow energy measured at 10 mm/s divided by the
294
energy measured at 100 mm/s.
295 296
The effect of air flow on the energy required to move the blade through the powder is presented
297
in Figure 9. The air flow range was selected to achieve significant variations in energy while
298
avoiding particles to flow out of the cylinders. The conditions allow a decrease in energy to be
299
observed followed by a plateau, where the impact of further increases in air flow on energy is
300
minimal. The flow energy is significantly reduced when air is injected at the bottom of the
301
cylinder, as expected. This is caused by the fluidisation of the powder, which results in an
302
increase of the distance and a reduction of the forces between the particles. The conditions allow
303
observing a rapid decrease followed by a plateau, where the impact of the increase of air flow on
304
the energy is minimal.
305 306
The results presented in Figure 9 show significant variations. At 0 mm/s, the energy varies from
307
301 mJ to 627 mJ (average 417 mJ ± 106 mJ). This variation is much greater than that observed
308
during the stability tests (Figure 5). Indeed, the variation (Max-Min = 326 mJ; representing a
309
relative variation of 78 %) is significantly greater than the one observed with the BFE (i.e.,
310
27%). In addition, the average value (417 mJ) is significantly different from the average BFE
311
(318 mJ, Figure 6b). It was observed that not all laboratories used the same procedure. The
312
rheometer manufacturer recommend to avoid splitting the powder before these tests and use the
313
same amount of powder after splitting measured during the stability tests. However, some
314
laboratories used the amount of powder before splitting while others used the amount after
315
splitting. Consequently, not all tests were conducted with the same amount of powders (i.e. the
316
powder mass was varying between 67.3 to 79.8 g). Analysis of the results showed there was a
317
correlation between the force measured and the mass of powder and the variation of the mass
318
could be a source of the difference observed during these tests (see discussion section).
319 320
When the powder is fluidised, the forces gets small and variation appears more significant.
321
For the powder and conditions investigated, this causes large relative variations in the AR_10
322
results (67 to 159) which represents the energy measured at 0 mm/s divided by the energy
323
measured at 10 mm/s. When measuring the aeration ratio at 4 mm/sec (in the linear portion of
the energy vs air velocity curve), variations are significantly smaller and aeration ratios ranging
325
from 44 to 69 are calculated. Obviously, the absolute AR_4 and AR_10 values are different as
326
these values represent ratios of energies measured under different conditions. Therefore, these
327
indices should only be used to compare powders if measurements are made under similar
328
conditions.
329
Air velocity (mm/sec)
0 2 4 6 8 10 12 En er gy ( m J) 1 10 100 1000 A B C D E 330 331
Figure 9: Effect of air velocity on the flow energy (averages and standard deviations) presented
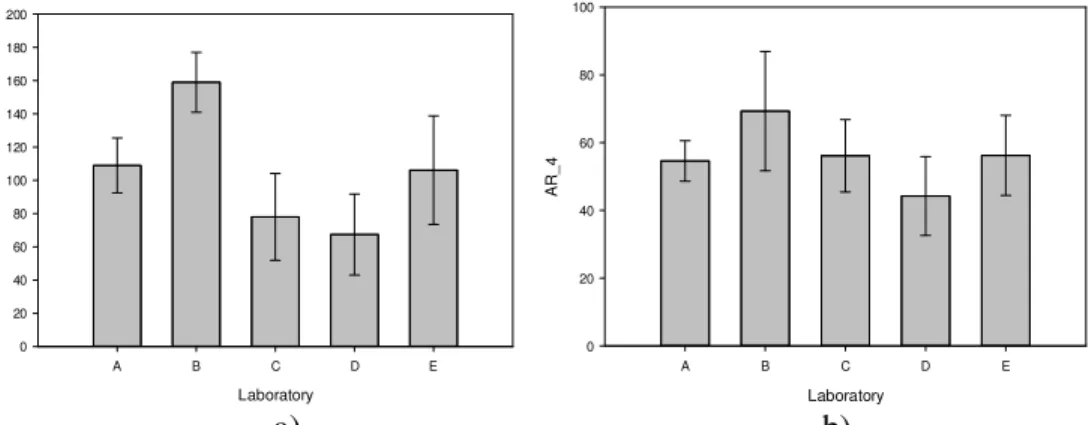
332 on a log scale. 333 Laboratory A B C D E AR _ 10 0 20 40 60 80 100 120 140 160 180 200 Laboratory A B C D E AR_ 4 0 20 40 60 80 100 334 a) b) 335
Figure 10: Aeration ratio (averages and standard deviations) obtained in different laboratories a)
336
energy measured at 0 mm/s divided by the energy measured at 10 mm/s (AR_10) and b) energy
337
measured at 0 mm/s divided by the energy measured at 4 mm/s (AR_4).
338 339 340
Permeability results presented in Figure 11 and 12 show that the air pressure drop through the
341
powder is not significantly affected by the applied pressure. Indeed, the consolidation of the
342
powder is minimal under the pressures used in the tests and once the powder is packed (already
343
observed under 1 kPa), the density of the powder and permeability are little affected by the
344
pressure. Variations were observed in the different laboratories (1.58 mBar spreading observed
345
at 15 kPa). Standard variations of all results equals 6 % while the standard variations of the
346
average of all laboratories was 0.12 mBar, representing 2 % of the average of all data at 15 kPa.
Applied pressure (kPa) 0 2 4 6 8 10 12 14 16 Pre ssu re d ro p (mBa r) 0 2 4 6 8 10 A1 A2 A3 B1 B2 B3 C1 C2 C3 D1 D2 D3
Applied pressure (kPa)
0 2 4 6 8 10 12 14 16 Pressur e drop (mB ar) 0 2 4 6 8 10 A B C D E 348 a) b) 349
Figure 11: Pressure drop as a function of applied pressure, a) all data measured and b) averages
350
and standard deviations measured by the different laboratories.
351 Laboratory A B C D E P ressu re dr op (m B ar @ 15.0k P a) 0 2 4 6 8 352
Figure 12: Pressure drop (averages and standard deviations) measured at 15 kPa by the different
353
laboratories.
354 355
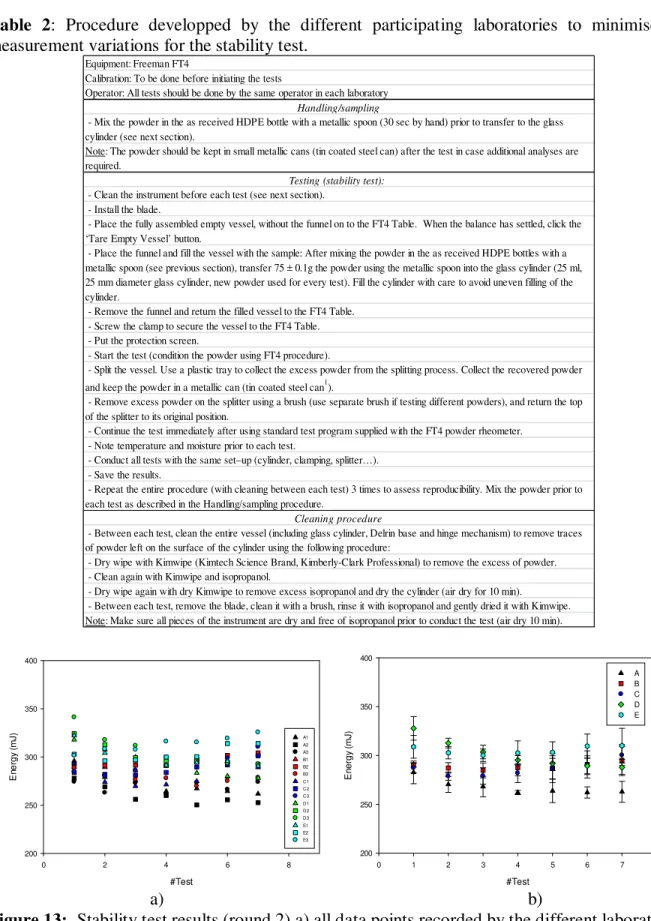
To minimize the variations coming from the handling of the powder, a test procedure was prepared
356
(Table 2) and a new series of stability tests was conducted in the different laboratories (round 2).
357
The results obtained (Figure 13) show that the new procedure did not allow reducing the variations
358
between the different laboratories. In fact, a BFE average of 291 mJ ± 20 mJ was obtained with
359
results spanning from 253 mJ up to 326 mJ (representing a relative variation of 25 %).
360
Interestingly, the BFE values obtained in the second round are lower than those obtained in the
361
first series of tests. Besides, there is an apparent correlation between the values measured during
362
the two rounds (Figure 14b).
363 364 365
Table 2: Procedure developped by the different participating laboratories to minimise the
366
measurement variations for the stability test.
367
Equipment: Freeman FT4
Calibration: To be done before initiating the tests
Operator: All tests should be done by the same operator in each laboratory
Handling/sampling
- Mix the powder in the as received HDPE bottle with a metallic spoon (30 sec by hand) prior to transfer to the glass cylinder (see next section).
Note: The powder should be kept in small metallic cans (tin coated steel can) after the test in case additional analyses are required.
Testing (stability test):
- Clean the instrument before each test (see next section). - Install the blade.
- Place the fully assembled empty vessel, without the funnel on to the FT4 Table. When the balance has settled, click the ‘Tare Empty Vessel’ button.
- Place the funnel and fill the vessel with the sample: After mixing the powder in the as received HDPE bottles with a metallic spoon (see previous section), transfer 75 ± 0.1g the powder using the metallic spoon into the glass cylinder (25 ml, 25 mm diameter glass cylinder, new powder used for every test). Fill the cylinder with care to avoid uneven filling of the cylinder.
- Remove the funnel and return the filled vessel to the FT4 Table. - Screw the clamp to secure the vessel to the FT4 Table. - Put the protection screen.
- Start the test (condition the powder using FT4 procedure).
- Split the vessel. Use a plastic tray to collect the excess powder from the splitting process. Collect the recovered powder and keep the powder in a metallic can (tin coated steel can1).
- Remove excess powder on the splitter using a brush (use separate brush if testing different powders), and return the top of the splitter to its original position.
- Continue the test immediately after using standard test program supplied with the FT4 powder rheometer. - Note temperature and moisture prior to each test.
- Conduct all tests with the same set–up (cylinder, clamping, splitter…). - Save the results.
- Repeat the entire procedure (with cleaning between each test) 3 times to assess reproducibility. Mix the powder prior to each test as described in the Handling/sampling procedure.
Cleaning procedure
- Between each test, clean the entire vessel (including glass cylinder, Delrin base and hinge mechanism) to remove traces of powder left on the surface of the cylinder using the following procedure:
- Dry wipe with Kimwipe (Kimtech Science Brand, Kimberly-Clark Professional) to remove the excess of powder. - Clean again with Kimwipe and isopropanol.
- Dry wipe again with dry Kimwipe to remove excess isopropanol and dry the cylinder (air dry for 10 min). - Between each test, remove the blade, clean it with a brush, rinse it with isopropanol and gently dried it with Kimwipe. Note: Make sure all pieces of the instrument are dry and free of isopropanol prior to conduct the test (air dry 10 min).
368 #Test 0 2 4 6 8 E ne rgy ( m J) 200 250 300 350 400 A1 A2 A3 B1 B2 B3 C1 C2 C3 D1 D2 D3 E1 E2 E3 #Test 0 1 2 3 4 5 6 7 8 E n ergy ( m J) 200 250 300 350 400 A B C D E 369 a) b) 370
Figure 13: Stability test results (round 2) a) all data points recorded by the different laboratories
371
and b) averages and standard deviations for each laboratory.
372 373
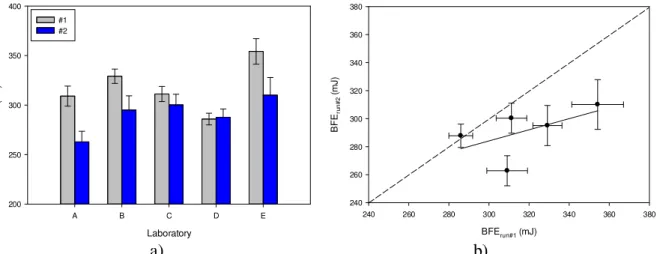
Laboratory A B C D E B F E ( mJ) 200 250 300 350 400 #1 #2 BFErun#1 (mJ) 240 260 280 300 320 340 360 380 B FE ru n # 2 ( m J) 240 260 280 300 320 340 360 380 374 a) b) 375 376
Figure 14: Comparison of the basic flow energy (BFE) data measured during round 1 and 2 a)
377
averages and standard deviations and b) correlation between the results obtained in round 1 and 2
378
in the different laboratories.
379 380 381 4. Discussion 382 383
The results show that there were variations during the measurement of the flow energies. The
384
variations provided for each data point on the reproducibility tests were calculated on only three
385
replicates and the reported values should only be used as an indication of the variability.
386
Deviations were, however, also calculated on the entire BFE data set and the trend observed was
387
the same. Indeed, when the BFE standard deviations is calculated with the entire population (30
388
data points coming from the 3 replicates in 5 laboratories measured in 2 rounds), the average
389
BFE measured is 305 ± 26 mJ (with Bessel’s correction) or ± 25 mJ (stdev P, without
390
corrections). These values (with and without Bessel’s corrections) represent 8% relative
391
standard deviations and corresponds to the values reported in Table 1 for round 1.
392 393
Variations have already been observed by other researchers. S.V.Søgaard et al. [19] investigated
394
the reproducibility of the measurement of the flowability of microcrystalline cellulose and
395
anhydrous lactose using a powder rheometer and observed that the measurements of the basic
396
flow energy of anhydrous lactose were reproducible (relative standard deviation of 3.6 %) while
397
the variations obtained with the microcrystalline cellulose were significant (relative standard
398
deviation of 13.2 %). The authors suggested that the variations observed were most likely not
399
associated with environmental conditions as all tests were conducted under controlled
400
atmosphere (50 % RH ± 5 % RH and 21 °C ± 1 °C). Besides, the authors considered that
401
electrostatic forces were not responsible for the variations observed as the amount of charge
402
decreases with increasing humidity and were estimated as being barely present at 50 % RH [20].
403
J. Whiting [21] investigated the repeatability of the measurement of stainless steel powder (17-4
404
SS, AM grade) also using a powder rheometer. Significant variations (540 mJ to 1010 mJ) were
405
observed, even if the testing was conducted on the exact same sample of powder (basic flow
406
energy ranging from 650 mJ to 900 mJ with the exact same sample).
407 408
While variations were observed within each lab (BFE relative standard variations between 2.1 to
409
3.6%), the inter-laboratory variations appear to be larger in the present investigation (8%).
410
These variations are, however, smaller than those observed with a Hall flowmeter in a
411
proficiency test program (19 laboratories) using similar powders (relative standard deviations of
412
18%) [17].
413 414
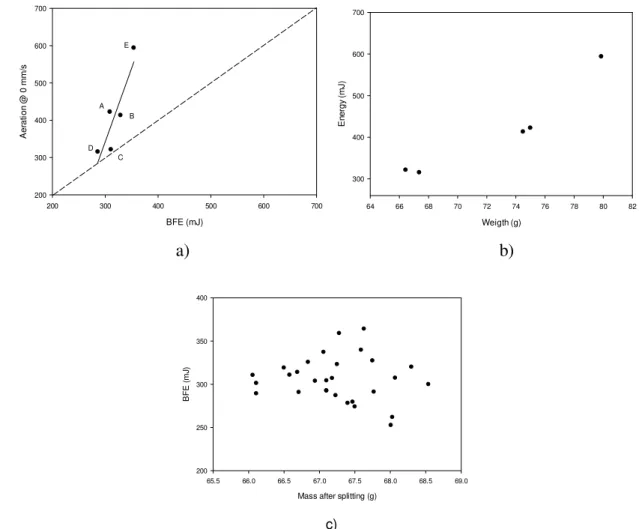
Comparison between the flow energy measured during the aeration test at zero air velocity and
415
the BFE values suggests there is a correlation between the flow energy measured during the two
416
experiments (Figure 15a). Figure 15b shows that the deviation comes essentially from the mass
417
used during the tests. Indeed, analysis of the procedures indicated that not all laboratories used
418
the same mass for these tests and the variation of the mass significantly affected the results. An
419
analysis of the BFE vs mass for all tests (Figure 15c) shows that the variation of the mass during
420
those tests was relatively small (66.7 to 68.5 g) and could not explain the variations of BFE
421
observed during round 1 and 2.
422 BFE (mJ) 200 300 400 500 600 700 A er at ion @ 0 m m /s 200 300 400 500 600 700 E D C B A Weigth (g) 64 66 68 70 72 74 76 78 80 82 E n e rgy (m J) 300 400 500 600 700 423 a) b) 424
Mass after splitting (g)
65.5 66.0 66.5 67.0 67.5 68.0 68.5 69.0 B FE ( mJ ) 200 250 300 350 400 425 c) 426
Figure 15: Correlation between a) the flow energy measured during the aeration test at zero air
427
velocity and BFE; b) the mass used for the aeration test and the energy measured at v=0 mm/sec
428
during the aeration tests and c) the BFEs and mass used in the stability tests (after splitting
429
procedure).
430 431
The variations observed by S.V.Søgaard et al. [19] were dependant on the material and not
432
associated with the variation of environmental conditions such as temperature and humidity nor
433
electrostatic forces. In a similar way, the present investigation showed there is no clear
434
correlation between the flow energy and humidity level measured in the laboratory during the
435
tests. While the humidity was not controlled in the different laboratories (measured humidity
436
ranged between 13 % RH and 58 % RH), there is no correlation between the humidity and the
437
flow energy measured (Figure 16).
438 439
While it is recognized that humidity does affect the flowability of fine Ti6Al4V powders [22],
440
the sensitivity of the stability tests (and BFE) to humidity seems to be minimal, at least for the
441
powder and conditions used in this study. In fact, previous tests conducted on the impact of
442
humidity (0 % RH to 44 % RH) on the energy flow energy of Ti6Al4V (smaller than 45µ m
443
particles as identified by the manufacturer) showed the limited effect of the humidity in the
444
laboratory on the flow energy measured with the rheometer [22]. This hypothesis is consistent
445
with observations from J. Whiting [21], who did not observe the effect of drying (24 h at 100 °C)
446
and exposure to moisture (powder left out in lab air at 45 % RH for >100 h) on the variability of
447
tests measured on a 17-4 SS AM powder.
448 449
Modification of interparticle forces caused by humidity adsorption are potentially too small to be
450
measured using the BFE index, at least for the material and conditions investigated in this study.
451
Indeed, BFE is measured while the blade is moving downward and the powder is confined and
452
pushed toward the bottom of the vessel. Under those conditions, the stresses are probably much
453
higher than the variations of stresses that could be caused by the atmospheric adsorption of
454
moisture. In addition, conditioning of the powder was most likely not constant from one test to
455
the other and moisture adsorption was probably not perfectly correlated with the amount of
456
humidity in the laboratory. Indeed, moisture adsorption may take time and vary more or less
457
rapidly depending on powder storage, exposure to the laboratory environment and set-up of the
458
experiment. Consequently, additional tests should be done to confirm the effect of humidity on
459
the rheology of the powders and validate how it may impact the variability of the results.
460 %RH 10 20 30 40 50 60 70 B FE ( mJ ) 200 250 300 350 400 461
Figure 16: Effect of relative humidity on the BFE (averages and standard deviations) measured
462
during tests conducted in round 1 and 2.
463 464
Electrostatic charging of the powder during production, shipping, handling and/or testing could
465
potentially affect the rheology of the powder and influence the variability of the measurements.
466
A previous study showed that charging Ti6Al4V powder by mixing in a polyethylene bottle
467
affects the Carney flowability of the powder [22]. Unfortunately, the electrostatic potential of the
468
powder before and after the tests was not evaluated in the present study and it was not possible to
469
correlate the variations observed with charging. As the energy appeared to be relatively stable
470
during the stability tests (Figures 5, 13), particles modification and charging probably did not
471
significantly impact the measurements of the flow energy during the tests. As charging was
472
previously observed in other experiments [23], it is believed that the tests were probably not long
473
enough with the materials and conditions used in the present study to observe a significant
474
charging, sufficient to impact the flow energy.
475 476
A source of variation to consider is the handling of the powder during the test (may impact
477
humidity adsorption or desorption, charging, segregation, packing of the particles…). The
478
development of a more direct procedure to make the measurements more reproducible from
479
laboratory to laboratory was not, however, effective to reduce the variations between the
480
different laboratories. Indeed, the variations observed when the laboratories were using their
481
internal procedures (as long as they were conforming to the general guidelines of the rheometer
482
manufacturer) are of the same order of magnitude as those obtained when each step of the
483
measurement was fixed.
484 485
While the variations remained more or less unchanged, the average values obtained in the second
486
sets of experiments (i.e., round 2), are in most cases smaller. The largest variations observed
487
from round 1 and 2 came from two labs that had performed an instrument calibration (the
488
instrument failed the calibration audit and equipment set-up had to be adjusted according to the
489
manufacturer recommendations). Beside calibration, it would be valuable to develop reference
490
materials that could be used to validate that the equipment is well calibrated and measurements
491
are stable and reliable.
492
It is worth mentioning that previous investigations showed that the flow energy can be
493
significantly different when the powder is characterized in cylinders made from different
494
materials. Indeed, tests conducted on Ti6Al4V powder (less than 45 µm in size as identified by
495
the powder manufacturer) measured in glass, stainless steel and aluminum cylinders led to very
496
different results (BFE ranging from 259 mJ to 380 mJ) [22]. As the stresses measured in [22]
497
were relatively stable from test to test, it is believed that the differences observed were not
498
coming from the charging of the powder but from the interaction between the powder and the
499
surface of the cylinder (i.e., effect of composition and surface finish). The effect is not
500
surprising considering that the clearance between the rotating stainless steel blade (23.5 mm
501
diameter) in the cylinder (25 mm diameter) is relatively small (750 µ m) and the interaction
502
between the powder and the surface of the cylinder may represent a significant portion of the
503
stress measured. J.Whiting [24] observed a similar trend with 17-4 SS powder and noticed that
504
the variations were larger with a glass cylinder when compared with results obtained with an
505
aluminum cylinder (the difference was in this case associated with charging). In the same study,
506
the effect of cleaning the cylinder (warm tap water, doused in isopropanol and dried with
507
compressed air) on the results was observed, also suggesting that the interaction between the
508
powder and the cylinder was significant. It is worth mentioning that the impact of
flowmeter surface interaction has been observed with other test methods, such as Hall and
510
Carney flowmeters.
511 512
Figure 17 presenting the BFE as a function of the particle size (i.e., D50 or 50th percentile by
513
volume measured on the different samples) shows that the difference of size distribution is very
514
small from one sample to the other (data collected for samples of round 2 characterized by labs
515
A, D and E), and there is no correlation between the BFE and the particle size (similar
516
observations were obtained when comparing the D10 and D90 results). This suggests that the
517
variations observed cannot be directly linked to variations of particle size from sample to sample
518
(or segregation during handling or shipping).
519 520 D50 (µm) 39.2 39.4 39.6 39.8 40.0 40.2 BFE ( m J) 200 220 240 260 280 300 320 340 521
Figure 17: BFE as a function of the particle size (D50). Measurements were done on a
522
subsample (obtained by riffling) of the samples tested in the rheometer.
523 524
In order to eliminate the potential effect of equipment calibration, specimens (2) were
525
characterized in two of the participating laboratories to see if similar results could be obtained
526
when the exact same specimens are characterized in different laboratories. Samples with the
527
lowest (L) and highest (H) values in round 2 were exchanged between laboratories A and E. BFE
528
results presented in Figure 18 show that while Lab A obtained lower BFE values for both
529
specimens, the difference was relatively small for sample E. As the sample was the same, the
530
variations was most likely not coming from differences of particle size. It is not, however,
531
possible to confirm if the variations observed are coming from differences of procedures or the
532
modification of the powder during shipping and handling (i.e. humidity, charging). As the
533
difference is not systematically the same between the two laboratories, the differences are
534
probably not coming for the calibration of the instruments. Additional tests should, however, be
535
conducted with more samples to investigate further the sources of the variations observed.
Sample L Sample H B FE ( m J) 200 250 300 350 400 Lab A Lab E 537
Figure 18: BFE measured in laboratory A and E with the samples that provided the lowest (L)
538
and highest (H) BFE in round 2 (single specimen).
539 540
Attempts to correlate the differences of powder behaviour with the measurement procedure,
541
powder sampling, charging or humidity did not enable to isolate the sources of the variations
542
observed. Among the sources that may potentially be responsible for the variation of the results,
543
the stability of the machine needs to be further investigated. While calibration tests done by J.
544
Whiting [21] showed no substantial differences in measured torque or normal force (< 0.5 %
545
change), an investigation of the calibration of the equipment in different laboratories could be
546
done to confirm that the variations are not coming from differences in the rheometer or
547
inadequate calibration procedures. Additional tests should also be done to further investigate the
548
effect of particle characteristics on the flow energy. The evolution of the properties of the
549
powder during shipping, storage, handling and testing as well as the impact of the operators on
550
the results should also be further investigated.
551 552
5. Conclusions
553
Different flow tests (basic flow energy, sensitivity to blade speed, effect of powder aeration,
554
permeability) were conducted using a powder rheometer. All tests were conducted with the
555
same powder (different samples of the same batch that was divided by splitting into different
556
bottles) shipped to different laboratories. Differences were observed in the powder rheology
557
metrics. These observations were consistent with observations made in other investigations on
558
the stability of the results obtained with a powder rheometer or flowmeter. Differences observed
559
during the aeration tests were more important due to differences in the procedures in the different
560
laboratories (i.e. mass of the powder used) while the variations observed during the permeability
561
tests were minimal.
562 563
While variations have been observed in other inter and intra-laboratories studies using other flow
564
measurement techniques, it would be important to understand the source of the variations and
565
find ways to minimize them. Different sources were investigated (powder sampling,
566
measurement procedures, humidity) in the present study but the variations could not be
567
correlated to a single source. Among the parameters that need to be further investigated is the
568
stability and calibration of the equipment as well as the effect of the blades and cylinders on the
569
measurements. The effect of the modifications of the properties of the powder during shipping,
570
handling, storage and testing also needs to be further investigated.
571 572 573
6. Acknowledgements
574
The authors would like to acknowledge the contribution of Shirley Mercier and Roger Pelletier
575
for setting up the tests and the characterisation at the National Research Council Canada (NRC)
576
and their support in the preparation of the test protocol. The authors would also like to thank
577
Vladimir Brailovski from the École de technologie Supérieure (ETS), Ehsan Toyserkani from the
578
University of Waterloo for their support of this work and Ed Garboczi and Shawn Moylan from
579
theNational Institute of Standards and Technology(NIST) for suggestions in the manuscript.
580 581 582 583 584 585 586 587 588 589 590 591 592 593
594
7. References
[1] J. K. Prescott, R.A. Barnum, On Powder Flowability, Pharmaceutical Technology, October (2000) 60-84.
[2] A. Castellanos, J. M. Valverde, A. T. Pérez, A. Ramos, and P. K. Watson, Flow Regimes in Fine Cohesive Powders, Physical Review Letters, 82, 6, (1999), 1156-59.
https://doi.org/10.1103/PhysRevLett.82.1156
[3] AMSC 18-001, PRELIMINARY FINAL DRAFT AMSC ROADMAP VERSION 2.0 4/6/18, America Makes & ANSI AMSC Standardization Roadmap for Additive Manufacturing, (2018). [4] MPIF 03, Method for Determination of Flow Rate of Free-Flowing Metal Powders Using Hall Apparatus, Standard test methods for metal powder and powder metallurgy products, Metal Powder Industries Federation, (2016).
[5] ASTM B213-17, Standard Test Methods for Flow Rate of Metal Powders Using the Hall Flowmeter Funnel, ASTM International, West Conshohocken, PA, 2017, www.astm.org,
http://dx.doi.org/10.1520/B0213-17
[6] ISO 4490 Metallic powders – Determination of flow rate by means of a calibrated funnel [7] ASTM D7481-18, Standard Test Methods for Determining Loose and Tapped Bulk Densities of Powders using a Graduated Cylinder, ASTM International, West Conshohocken, PA,
2018, www.astm.org, http://dx.doi.org/10.1520/D7481-18
[8] B.H.Kaye, Characterizing the Flowability of a Powder Using the Concepts of Fractal
Geometry and Chaos Theory, Particle & Particle Systems Characterization, 14 (1997) 53-66. [9] B.H Kaye., J. Gratton-Liimatainen, N. Faddis, Studying the Avalanching Behaviour of a Powder in a Rotating Disc, Particle & Particle Systems Characterization, 12,5 (1995) 232-236. [10] Mercury Scientific Inc., Flowability analysis with the revolution,
http://www.mercuryscientific.com/instruments/flowability-analysis-revolution, (accessed 25 July 2019)
[11] GranuTools, GranuDrum- Granular material flow analyzer-Powder rheometer, https://granutools.com/products/granudrum/, (accessed 25 July 2019)
[12] ASTM D6467-13e1, Standard Test Method for Torsional Ring Shear Test to Determine Drained Residual Shear Strength of Cohesive Soils, ASTM International, West Conshohocken, PA, 2013, www.astm.org,
http://dx.doi.org/10.1520/D6467-13E01
[13] ASTM D3080 / D3080M-11, Standard Test Method for Direct Shear Test of Soils Under
Consolidated Drained Conditions, ASTM International, West Conshohocken, PA, 2011,w w w .ast m.org, http://dx.doi.org/10.1520/D3080_D3080M-11
[14] Freeman technology, Powder Flow Testing with the FT4 Powder Rheometer.
https://www.freemantech.co.uk/_powders/ft4-powder-rheometer-universal-powder-tester, (accessed 25 July 2019)
[15]Anton Paar, Rheometer, https://www.anton-paar.com/us-en/products/group/rheometer/, (accessed 25 July 2019)
[16] Controls Group Inc., Bromhead ring shear apparatus,
http://m.controls- group.com/eng/products/rock-mechanics-testing-equipment-testing-equipment-testing-equipment/bromhead-ring-shear-apparatus
[17] Committee B09 Proficiency Test Program Additive Manufacturing Powder Metallurgy Sample ID: AMPM1804 April 2018, Report Issue Date: September 13, 2018. ASTM
International, West Conshohocken, PA
[18] https://www.freemantech.co.uk/learn/product-brochures.
[19] S.V.Søgaard, M.Allesø, J.Garnaes, S.Baldursdottir,, J.Rantanen, Development of a
Reproductible Powder Charactrization Method Using a Powder Rheometer, Annual Transactions of the Nordic Rheology Society, 20 (2012) 239-245.
[20] G. Léonard, N. Abatzoglou, Lubrication of pharmaceutical powder/wall interfaces and electrostatic effects, Powder Technology, 208 (2011) 54–62.
[21] J. Whiting, Repeatability of the FT4 Rheometer Evaluating AM Powder, presented at
Additive Manufacturing with Powder Metallurgy (AMPM), June 13-15, 2017 MPIF, Las Vegas, USA.
[22] L.P.Lefebvre, F.Bernier, R.Pelletier, Flowability of powders: Adapting the measurements to AM requirements, presented at Additive Manufacturing with Powder Metallurgy (AMPM), June 17–20, 2018 MPIF, San Antonio, USA.
[23] L.P.Lefebvre, F.Bernier, N.Orsoni-Wiemer, C.Charbonneau, B.Alchikh-Sulaiman, S.Yue: Rheology of Powders: Assessing the Robustness and Impact of Humidity, Tribocharging, Particle Size and Composition, submitted to Powder Metallurgy.
[24] J.G.Whiting, Key Parameters and Issues: Effects of Particle Size, Particle Size Distribution, and Particle Morphology, presented at the HPC4Mfg workshop on Modeling of Powder