Critical role of IRF1 and BATF in forming chromatin
landscape during type 1 regulatory cell differentiation
The MIT Faculty has made this article openly available.
Please share
how this access benefits you. Your story matters.
Citation
Karwacz, Katarzyna et al. “Critical Role of IRF1 and BATF in
Forming Chromatin Landscape During Type 1 Regulatory Cell
Differentiation.” Nature Immunology 18, 4 (February 2017): 412–421
© 2017 Nature America Inc, part of Springer Nature
As Published
http://dx.doi.org/10.1038/NI.3683
Publisher
Nature Publishing Group
Version
Author's final manuscript
Citable link
http://hdl.handle.net/1721.1/116739
Terms of Use
Creative Commons Attribution-Noncommercial-Share Alike
Critical role of the transcription factors IRF1 and BATF in
preparing the chromatin landscape during Type 1 regulatory cell
differentiation
Katarzyna Karwacz1, Emily R. Miraldi2,3, Maria Pokrovskii3, Asaf Madi1, Nir Yosef4, Ivo
Wortman5, Xi Chen6, Aaron Watters2, Nicholas Carriero2, Amit Awashti7, Aviv Regev5, Richard Bonneau2,6, Dan Littman3, and Vijay K. Kuchroo1,*
1Evergrande Center for Immunologic Diseases, Harvard Medical School and Brigham and
Women’s Hospital, Boston, MA 02115, USA
2Center for Computational Biology, Flatiron Institute, Simons Foundation New York, NY 10010,
USA
3Skirball Institute for Biomolecular Medicine, NYU School of Medicine
4Department of Electrical Engineering and Computer Science and Center for Computational
Biology, University of California, Berkeley, Berkeley, CA 94720, USA
5Broad Institute of MIT and Harvard, Cambridge, MA 02142, USA 6Department of Biology, New York University, New York, NY 10003, USA
7Center for Human Microbial Ecology, Translational Health Science and Technology Institute (an
autonomous institute of Department of Biotechnology, Govt. of India), NCR Biotech Science Cluster, 3rd Milestone, Faridabad-Gurgaon Expressway, PO box # 4, Faridabad-121001, India
Abstract
Type 1 regulatory T (Tr1) cells are induced by interleukin-27 (IL-27) and have critical roles in the control of autoimmunity and resolution of inflammation. Here, we show that the transcription
*Corresponding author: Vijay Kuchroo (vkuchroo@evergrande.hms.harvard.edu).
Accession codes
GSE92994, GSE92940
COMPETING FINANCIAL INTERESTS
The authors declare no competing financial interests.
AUHTOR CONTRIBUTIONS
KK planned, performed and analyzed all biological experiments and wrote the manuscript.
ERM designed and actuated computational analyses for RNA-seq/ATAC-seq, contributed to interpretation of the results and writing of the manuscript.
MP prepared ATAC-seq libraries, coordinated sequencing with the NYUMC genomics core, contributed to interpretation of the results and general discussion.
AM, NY, XC, AW and NC contributed to computational analysis. IW prepared RNA-seq libraries and coordinated sequencing. AA provided reagents and advice.
AR developed and undertook transcriptional analysis of IL-27 induced Tr1 cells.
RB contributed to computational analysis, interpretation of the results and writing of the manuscript.
HHS Public Access
Author manuscript
Nat Immunol
. Author manuscript; available in PMC 2018 April 16. Published in final edited form as:Nat Immunol. 2017 April ; 18(4): 412–421. doi:10.1038/ni.3683.
A
uthor Man
uscr
ipt
A
uthor Man
uscr
ipt
A
uthor Man
uscr
ipt
A
uthor Man
uscr
ipt
factors IRF1 and BATF are induced early during treatment with IL-27 and are required for the differentiation and function of Tr1 cells in vitro and in vivo. Epigenetic and transcriptional analyses reveal that both transcription factors influence chromatin accessibility and expression of genes required for Tr1 cell function. IRF1 and BATF deficiencies uniquely alter the chromatin landscape, suggesting that these factors serve a pioneering function during Tr1 cell differentiation.
INTRODUCTION
IL-10-producing Type 1 regulatory T cells (Tr1 cells) were first described as a distinct subset of T cells induced in vitro by activating naive T cells in the presence of IL-10 1. They produce copious amounts of IL-10, their signature cytokine, but lack expression of Foxp3, the key transcription factor for differentiation of regulatory T (Treg) cells. Tr1 cells’ strong
immunosuppressive capacity allows them to restrain autoimmune responses and alleviate pathology in models of autoimmune disease 2, 3, 4. IL-27 suppresses Foxp3 expression but induces differentiation of Tr1 cells in vitro and in vivo 5, 6, 7. Il27ra−/− mice lack Tr1 cells, have an increased number of TH17 cells, both in the periphery and in the CNS, and, as a
result, develop more severe EAE 8.
IL-27 receptor signaling induces expression of the transcription factor c-Maf, as well as the ligand-activated transcription factor aryl hydrocarbon receptor (AhR), which physically associate during Tr1 induction and together bind to and transactivate Il10 and Il21 promoters9. IL-21 acts as an autocrine growth factor for Tr1 cells 10. IL-27 induces early growth response gene 2 (Egr-2) which controls Blimp1-mediated IL-10 upregulation through direct activation of the Prdm1 promoter 11. IL-27 thus induces transcription factors that regulate IL-10 production, but it is unclear whether it additionally regulates the chromatin landscape and access of transcription factors to key target genes.
During CD4+ T cell differentiation, besides the “master regulator” transcription factors (TFs), a set of “pioneering factors” are induced that shape the epigenetic landscape in differentiating T cells, and regulate accessibility of transcriptional regulators to lineage specific genomic elements 12, 13, 14. Recently, BATF and IRF4, were shown to regulate chromatin accessibility and exhibit pioneer-like functions during differentiation of TH17 15
and CD8+ T cells 16. Here we report that BATF and IRF1 are induced early during Tr1 differentiation and act as pioneering factors for differentiation of Tr1 cells.
RESULTS
IRF1 and BATF control Tr1 differentiation in vitro
We analyzed global gene expression following engagement of the TCR on naive CD4+ T cells cultured in the presence (Tr1) or absence (TH0) of IL-27. Analysis at 2 hours placed
IRF1 and BATF amongst highly ranked putative transcription factors crucial for the regulation of Tr1 differentiation (Fig. 1a). Using qPCR, we found two waves of Irf1 expression, peaking at around 3–6 hours and 12–15 hours after activation in the presence of IL-27, and two waves of Batf expression, peaking at roughly 1 and 24 hours (Fig. 1b). We activated naive CD4+ T cells from Irf1−/− and Batf−/− mice in the presence of IL-27 and
A
uthor Man
uscr
ipt
A
uthor Man
uscr
ipt
A
uthor Man
uscr
ipt
A
uthor Man
uscr
ipt
analyzed T cell differentiation 72 hours later. Both Irf1−/− (Fig. 1c, d) and Batf−/− (Fig. 1e, f) cells failed to produce IL-10 (mRNA and protein), or differentiate into Tr1 cells and
expressed decreased levels of interferon-γ (IFN-γ) (Fig. 1c, 1e).
Although there was a decrease in the percentage of total IFN-γ+ cells and IFN-γ+IL-10+ cells in Batf−/− cells treated with IL-27, the frequency of IFN-γ+IL-10– cells remained unchanged in the Batf−/− cells (Supplementary Fig. 1a). This may reflect the role of BATF in TH1 cells, as IL-27 regulates TH1 differentiation 17. In contrast to Tr1 cells, we found
enhanced differentiation of both Irf1−/− and Batf−/− cells into Foxp3+ Tregs (Supplementary
Fig. 1b). Thus, IRF1 and BATF are indispensable for generation of IL-27 induced Tr1 cells in vitro.
The effects of IRF1 and BATF deficiency on Tr1 function
IL-27 treatment activates phosphorylation of STAT1 and STAT3, both of which are required for Tr1 differentiation 18. We found that Irf1 expression was STAT1-dependent, but STAT3-independent (Fig. 2a). In contrast, Batf expression was reduced in Stat3−/− cells, but remained unchanged in Stat1−/− cells (Fig. 2b).
Overexpression of IRF1, but not BATF, enhanced Il10 expression in IL-27-treated cells (Fig. 2c), although concurrent overexpression of IRF1 and BATF did not induce Il10 expression (Supplementary Fig. 1c). BATF overexpression strongly induced Maf and Il21 in Tr1 conditions, while both IRF1 and BATF augmented Ahr expression in cells treated with IL-27. These results point to separate roles played by IRF1 and BATF during Tr1 differentiation.
IRF1 affects induction and resolution of autoimmune disease
We induced EAE in Irf1−/− mice to assess the role of IRF1 in autoimmunity. In contrast to wild-type mice, in which clinical scores peak and diminish over time, Irf1−/− mice developed progressively more severe disease (Fig. 3a).
We found an increased percentage of IL-17A+ and IFN-γ+ CD4+ T cells, with the most prominent change in the frequency of double cytokine-producing cells (IL-17A+IFN-γ+) in the CNS of Irf1−/− mice (Fig. 3b, 3c). Transfer of CD4+ T cells from wildtype or Irf1−/− mice into Rag2−/− mice and induction of EAE in the recipients resulted in increased disease scores in recipients of the Irf1−/− CD4+ T cells (Fig. 3d). Additionally, we crossed IRF1-deficient mice to TCR transgenic 2D2 mice19 specific for MOG35-55 (Irf1−/−2D2). A small
fraction (about 6%) of 2D2 transgenic mice generally develop spontaneous EAE; however, all Irf1−/− 2D2 mice developed spontaneous EAE (Fig. 3e), supporting a direct role for IRF1 in regulation of CD4+ T cell responses in disease.
Proliferation of CD4+ lymphocytes isolated from the spleen and draining lymph nodes of MOG35-55 immunized Irf1−/− mice was strongly enhanced (Fig. 3f). Furthermore, these cells
secreted more IL-17A and IFN-γ following restimulation with MOG35-55 both in the
presence or absence of IL-23 (Fig. 3g, h). Selected expression profiling of CD4+ T cells (Supplementary Table 1) showed that in addition to Il17, Irf1−/− cells also upregulated Rorc,
A
uthor Man
uscr
ipt
A
uthor Man
uscr
ipt
A
uthor Man
uscr
ipt
A
uthor Man
uscr
ipt
Il23r, Csf2, Runx3 and Ifng compared to wildtype controls when cells were restimulated in the presence of IL-23 (Supplementary Fig. 1d).
Batf−/− mice are resistant to EAE 20 and Batf−/− T cells failed to develop a TH17 gene
signature due to the requirement of BATF as a pioneering factor (Supplementary Fig. 1d). Irf1−/− CD4+ T cells primed in vitro in TH17 conditions produced increased levels of IL-17A
(Supplementary Fig. 1e, f). Taken together, our results show that IRF1 deficiency promotes generation of Th17 cells in vivo and impairs resolution of autoimmunity in EAE.
IRF1 and BATF control generation of IL-10+ Tr1 cells in vivo
To determine whether IRF1 deficiency can affect IL-10 in lymphocytes during autoimmune inflammation, we induced EAE in wildtype and Irf1−/− mice and isolated CD4+ T cells from the draining lymph nodes and the CNS at the beginning of the resolution of clinical disease (day 19). We found decreased amounts of Il10 mRNA in both the CNS and the draining lymph nodes of Irf1−/− animals (Fig. 4a).
We immunized wildtype mice with MOG35-55, and analyzed CD4+ T cells reactivated in
vitro in the presence of the MOG35-55 with or without IL-27. IL-27 induced 26 genes
(>2-fold increase) and down-regulated 13 (>2-(>2-fold decrease), when compared to cultures activated without IL-27 (Fig. 4b), consistent with gene expression changes observed in vitro (Supplementary Fig. 1g). We compared the expression pattern of these 39 genes in T cells from immunized wildtype, Irf1−/− and Batf−/− mice re-stimulated in the presence of MOG35-55 and IL-27. Of these, Il21, Il10, Prf1 and Maf were down-regulated in cells from
both knockouts. Furthermore, Irf1 and Batf deficient cells also differed from each other in their transcriptional responses (Fig. 4c).
We tested whether cells from Irf1−/− and Batf−/− mice can generate functional Tr1 cells. CD4+ T cells from immunized wildtype, Irf1−/− and Batf−/− animals were activated in vitro in the presence of IL-27 for three days and transferred into MOG35-55 immunized mice at
the first clinical signs of disease (day 10). Transfer of wildtype Tr1 cells ameliorated disease, while transfer of Tr1-polarized Batf−/− cells was ineffective in suppressing clinical disease, and transfer of IRF1-deficient Tr1 cells exacerbated disease (Fig. 4d). Consistent with these data, repeated administration of anti-CD3 antibody, which induces IL-10 in the mesenteric lymph nodes of wild-type C57/BL6 mice, failed to induce IL-10 in the Irf1−/− or Batf−/− mice (Fig. 4e). Furthermore, splenocytes from these mice failed to produce IL-10 upon restimulation (Fig. 4f). Thus, both IRF1 and BATF control generation of Tr1 cells in vivo. IRF1 and BATF control the Il10 locus
To test whether IRF1 and BATF can interact with the Il10 promoter in CD4+ T cells, we differentiated wildtype naive CD4+ T cells for 72 hours in the presence of IL-27 and performed chromatin immunoprecipitation (ChIP), using antibodies against IRF1 and BATF, followed by qPCR. We used probes spanning previously described conserved non-coding sequences (CNS) and hypersensitivity (HSS) sites within the Il10 locus 21, 22 (Fig. 5a). We detected IRF1 binding to the CNS-9, HSS-0.12 and HSS+2.98 sites (Fig. 5b), with HSS-0.12 containing two putative IRF1 binding sites 23 (designated later as HSS-0.12 site1 and site2). ChIP also revealed two BATF binding sites, at the CNS-9 and HSS+2.98 sites of the Il10
A
uthor Man
uscr
ipt
A
uthor Man
uscr
ipt
A
uthor Man
uscr
ipt
A
uthor Man
uscr
ipt
locus (Fig. 5c). As we observed some overlap between the IRF1 and BATF binding sites within the Il10 locus, we tested the degree of co-occupancy of IRF1 and BATF using a sequential ChIP assay (ReChIP). We found a nearly complete (around 90%) co-occupancy of IRF1 and BATF at the CNS-9 site and a strong co-occupancy (around 60%) at the HSS
+2.98 site (Fig. 5d). To evaluate a regulatory interaction between these two transcription
factors, we performed ChIP for BATF in Irf1−/− and for IRF1 in Batf−/− Tr1 polarized cells. Binding of IRF1 and BATF in the Il10 locus was markedly reduced in Batf−/− and Irf1−/− cells, respectively (Fig. 5e, f).
As BATF and IRF4 exhibit a similar dependency in TH17 cells, we investigated potential
competition for binding between IRF1 and IRF4 24, 25. Tr1 cells differentiated from Irf4−/− cells expressed increased IL-10 (Supplementary Fig. 2a), in contrast to Irf1−/− cells.
Furthermore, overexpression of IRF1 antagonized IRF4-induced expression from an IL-17A reporter and IRF4 antagonized IRF1-induced expression from an IL-10 reporter in 293T cells (Supplementary Fig. 2b–2c and 2d–2e, respectively). We investigated binding of IRF1 to the IRF4 genomic binding sites on TH17 associated (Il17a, Il23r and Rorc) loci, and
found strongly increased IRF1 binding in IRF4-deficient TH17 polarized cells
(Supplementary Fig. 2f).
We analyzed whether IRF1 or BATF deficiency could affect distribution of epigenetic marks within the Il10 locus in Tr1 polarized cells. We performed ChIP-qPCR assay in Tr1-primed cells with antibodies directed against H3K9Ac, H3K4me3 and H3K27me3. We found decreased recruitment of activating marks (H3K9Ac, H3K4me3) in the absence of both IRF1 and BATF, as well as increased repressive marks (H3K27me3) in cells from both knockouts (Fig. 5g). These results point to the role of both transcription factors in the induction of epigenetic changes during Tr1 differentiation, and possibly reveal one of the mechanisms by which IRF1 and BATF factors induce IL-10 following priming with IL-27. Differential effects of IRF1 and BATF on the Il10 promoter
To investigate whether IRF1 and BATF can directly transactivate the Il10 promoter, we used reporter constructs driven by either the proximal Il10 promoter (-1.5 kb) containing the HSS-0.12 site, or by the CNS-9 or HSS+2.98 regions cloned upstream of the Il10 minimal promoter. C-Maf transactivation of the Il10 proximal promoter was used as a control. IRF1 directly transactivated the Il10 proximal promoter, while coexpression of IRF1 and c-Maf had an additive effect (Fig. 6a). Furthermore, IRF1 strongly transactivated expression regulated by the CNS-9 and HSS+2.98 regions of Il10, while BATF had no effect in transactivation of these constructs (Fig. 6b).
Overexpression of c-Maf in TH0 cells induces IL-10 expression even without IL-27. We
hypothesized that, in physiological conditions, this effect might depend on IRF1. We overexpressed c-Maf in wildtype and Irf1−/− CD4+ T cells; c-Maf was unable to fully induce IL-10 in Irf1−/− cells (Fig. 6c), indicating that c-Maf might not be able to bind to and/or transactivate the Il10 locus in the absence of IRF1. Although BATF is required for c-Maf expression 26, overexpression of c-Maf failed to rescue the phenotype of Batf−/− cells polarized in Tr1 conditions. (Fig. 6d).
A
uthor Man
uscr
ipt
A
uthor Man
uscr
ipt
A
uthor Man
uscr
ipt
A
uthor Man
uscr
ipt
We then directly analyzed whether binding of c-Maf to the Il10 locus is altered in Irf1−/− cells. We performed ChIP with differentiated wildtype or Irf1−/− Tr1-polarized cells and looked at known Maf binding sites within the Il10 locus (MARE-1--4). We found that c-Maf binding was significantly reduced in Irf1−/− cells (Fig. 6e).
In parallel, we analyzed whether BATF deficiency affected binding of other transcription factors known to bind to the Il10 locus. As Batf−/− cells do not express c-Maf, we investigated binding of AhR to the XRE1 site. We found that AhR fails to localize to its putative binding site in both Irf1−/− and Batf−/− Tr1 polarized cells (Fig. 6f). Collectively these results indicate that both IRF1 and BATF might induce chromatin changes that allow additional transcription factors to bind to and transactivate the Il10 locus, suggesting a possible pioneer role in Tr1 cells for one or both of these factors.
BATF and IRF1 deficiencies alter the Tr1 chromatin landscape
To assess potential pioneering roles of BATF and IRF1 during Tr1 differentiation, we measured chromatin accessibility using ATAC-seq (Assay for transposase accessible chromatin using sequencing) in Tr1 cells deficient in BATF, IRF1, c-Maf and AhR, and compared each to the TH0 and wildtype Tr1 controls. To capture chromatin landscape
dynamics over the course of T-cell differentiation, we compared an early time point, 24h, which coincides with induction of Il10 mRNA in cells treated with IL-27, and a late time point 72h. We detected ~180,000 accessible regions (peaks) across samples, and the data quality enabled quantitative analysis of peak intensities across sample conditions (Fig. 7a–c, Supplementary Fig. 3a). Time, polarization condition, and BATF deficiency most
dramatically altered the chromatin landscape, with each perturbation leading to upwards of 20,000 altered accessible regions (FDR=10%, log2|fold-change|>1, Supplementary Fig. 3a).
To globally relate chromatin accessibility patterns across samples, we performed principal component analysis (PCA) (Supplementary Fig. 3b). At 24h, all samples displayed relatively similar chromatin landscapes, although small differences were seen between Tr1 and TH0
polarizations for Batf−/−, Irf1−/−, and control cells. At 72h, the TH0- vs. Tr1- dependent
trends dominate; however the Batf−/− chromatin landscape resembles neither Tr1 nor TH0.
At 72h (Fig. 7b), Batf−/− TH0 and Tr1 cells have a distinct chromatin accessibility pattern,
whereas Tr1 cells derived from mice deficient in IRF1, AhR and c-Maf show relatively similar chromatin accessibility patterns. These analyses provide high-level support for BATF as a pioneering factor in Tr1 cells, consistent with its role in TH17 and CD8+ T cells15, 16.
To address a potential pioneering role for IRF1, we performed differential analysis with DESeq2 to quantify the number of transcription factor-dependent accessible peaks per transcription factor in Tr1 conditions (Fig. 7c), subsampling to ensure equal statistical power for each knockout condition. In this controlled analysis, BATF deficiency led to altered accessibility (log2(|fold-change|)>1, FDR = 10%) at over twenty thousand loci (ten thousand increased and ten thousand decreased). IRF1 deficiency resulted in ~100 peaks with
increased accessibility and 1100 peaks with decreased accessibility. In contrast, AhR- and c-Maf-dependent alterations were minor, consistent with the heatmap in which BATF- and IRF1-dependent decreases in accessibility are apparent. Interestingly, each factor appears to affect unique regions. Additionally, BATF-dependent chromatin regions with increased
A
uthor Man
uscr
ipt
A
uthor Man
uscr
ipt
A
uthor Man
uscr
ipt
A
uthor Man
uscr
ipt
accessibility are visible in Batf−/− cells, suggesting that, while much of the Tr1 landscape is being “turned off”, new regions are also being “turned on”.
Although the scale of IRF1- and BATF-dependent changes differs, both transcription factors alter chromatin accessibility, whereas c-Maf and AhR do not. This finding, combined with our data showing that both IRF1 and BATF are necessary for additional Tr1 transcription factors to bind chromatin, further supports a role for IRF1 and BATF as Tr1 pioneering factors. IRF1 is a smaller-scale/focused pioneer factor, while BATF acts globally. BATF and IRF1 uniquely regulate Tr1 transcriptional programs
Although both Irf1−/− and Batf−/− cells fail to express IL-10 when stimulated with IL-27 in vitro, their unique chromatin accessibility patterns suggest the potential for divergent transcriptional programs. We treated wildtype, Irf1−/− and Batf−/− naive CD4+ T cells for 72 hours in Tr1 conditions and measured gene expression by RNA-seq. The Tr1 expression signatures were strikingly different among Batf−/−, Irf1−/−, and control cells (Supplementary Fig. 4a). In agreement with the ATAC-seq analysis, BATF deficiency led to the greatest number of differentially expressed genes (~500 genes, compared to ~110 for Irf1−/−, Supplementary Fig. 4b, 4c). Deficiency of IRF1 and BATF resulted in large differences in transcription factor expression profiles (Fig. 7d), with down-regulation of the majority of transcription factors effected by BATF deficiency. Of these, only a few were also down-regulated in the IRF1-deficient cells and these shared transcription factors are reported to regulate IL-10 (e.g. Hif1a and Prdm1). Although Rorc is down-regulated in both IRF- and BATF-deficient cells, Rora is actually up-regulated in Irf1−/− samples. Consistent with the loss of suppressive function in Irf1−/− and Batf−/− cells differentiated into Tr1 cells, reduced levels of cytokines associated with Tr1 functions, such as Il10, and of Perforin2, were observed under both conditions (Fig. 7e)
We integrated the ATAC-seq and RNA-seq datasets to derive transcriptional regulatory networks for both IRF1- and BATF-deficient Tr1 cells. We integrated our quantitative ATAC-seq and RNA-seq information to find TFs that showed concurrent changes in expression and motif-containing peak accessibility. The relative perturbation strengths of IRF1 vs. BATF deficiencies are reflected in the scale of the resulting transcriptional
regulatory networks. The changes induced by IRF1 deficiency are relatively limited (Fig. 7f, Supplementary Fig. 5). IRF1 putatively represses Klf7, as Klf7 is over-expressed in Irf1−/− cells and an accessible IRF1 motif is found cis to the Klf7 locus. The KLF7 motif, in turn, is enriched cis to genes with increased expression under IRF1-deficient conditions, such as Id3 (Fig. 7g). STAT1 is also IRF1-dependent with an accessible IRF1 motif in cis, but STAT1 is a part of the Tr1 network that “turns off” in Irf1−/− cells (Ccl4, Il13ra1, Ccl3, Il10, Zbp1) (Fig. 7g). IRF1 might also directly regulate expression of a number of genes, such as Il10, Ccr5, and Prf1 (Fig. 7g).
The BATF Tr1 network is more complex, involving sixteen transcription factors (Fig. 7h,i). Explanations for the part of the Tr1 BATF network that is “turned on” can only be explained indirectly, by several transcription factors regulated downstream of BATF. The part of the Tr1 network that is “turned off” is explained not only by potentially direct BATF targets but also likely also involves secondary regulatory interactions, mediated by c-Maf, HIF1A,
A
uthor Man
uscr
ipt
A
uthor Man
uscr
ipt
A
uthor Man
uscr
ipt
A
uthor Man
uscr
ipt
FOSL2, ETS1, RUNX2, KLF10, RORG, RORA (Supplementary Fig. 6). BATF induces expression of Klf10, Runx2, Prdm1, Hif1a, Fols2 and Ets1, whose expression is reduced in the Batf−/− cells (Fig. 7i). They, in turn, might regulate a number of other cytokines or receptors that we found differentially expressed in the Batf−/− T cells, such as Il10, Prf1, Icos, Il2, Csf2, Cxcr5, and Il1rn. The “off” network is connected to the “on” network by RUNX2 and KLF10, which putatively repress the “on” transcription factors Eomes, Csr2, Sp6, and several members of the NF-κB family. The Batf−/− Tr1 transcriptional regulatory model suggests a dramatically altered transcriptional state for BATF-deficient Tr1 cells, mediated by several layers of altered transcriptional regulatory interactions.
DISCUSSION
Although IL-10 producing Foxp3− Tr1 cells are critical for regulation of autoimmunity, Tr1 lineage defining factors or the pioneering factors that set up the genomic landscape for Tr1 differentiation were undefined. The greatest extent of transcriptome remodeling occurs during early phases of T cell activation, before lineage defining transcription factors are induced. To identify pioneering factors for Tr1 differentiation, we analyzed an early time point following IL-27 priming, to uncover the transcription factors that potentially establish a “Tr1 epigenetic landscape”. IRF1 and BATF were strongly induced at 2 hrs following TCR activation and priming with IL-27. Both factors were indispensable for induction of Tr1 cells in vitro as well as for generation of Tr1 cells and protection from autoimmune disease in vivo.
During activation with IL-27, Tr1 cells activate both STAT-1 and STAT-3 to induce IL-10 production and develop a Tr1 transcriptional program. Previous studies have suggested that IL-27-induced STAT1 and STAT3 make distinct contributions to the transcriptional output. While STAT3 deficiency is associated with loss of the overall cytokine response, the major function of STAT1 is to provide specificity27. We found that IRF1 is expressed downstream of STAT1, while BATF expression is STAT3-dependent, which might account for some of the transcriptional differences observed between STAT1 and STAT3 deficiency.
Cooperative binding between BATF and IRF4 alters initial chromatin accessibility and thus pioneer access of transcription factors that specify the TH17 developmental program15. AP-1
and IRF complexes also cooperatively promote transcription of the Il10 gene in TH17
cells28. IRF1 and BATF binding sites co-localized at two locations in the IL-10 promoter, and cooperative binding between them in Tr1 cells was supported by our findings that IRF1 and BATF occupancy in the Il10 locus was markedly reduced in BATF- and IRF1-deficient cells, respectively.
Our results indicate that whereas BATF is required for the differentiation of both TH17 and
Tr1 cells, IRF4 and IRF1 are differentially required for the differentiation of these T cell subsets and therefore provide specificity in the regulation of the genomic landscape for TH17 vs. Tr1 differentiation. Preferential binding of IRF1 to shared ISRE-sites would limit
accessibility of IRF4 and inhibit TH17 differentiation, whereas loss of IRF1 would inhibit
Tr1 differentiation and promote unopposed binding of IRF4 and subsequent TH17
differentiation, in agreement with our data. These opposing effects of IRF1 on Tr1 and TH17
A
uthor Man
uscr
ipt
A
uthor Man
uscr
ipt
A
uthor Man
uscr
ipt
A
uthor Man
uscr
ipt
cell differentiation suggest that IRF1 might regulate balance between the two cell subsets and act as a molecular switch between the regulatory Tr1 cells and the pathogenic TH17
cells. Consequently, both an increase in TH17 cell differentiation and a decrease in Tr1
generation could contribute to the increased susceptibility to EAE in Irf1−/− mice.
Our data suggested that IRF1 and BATF must play a critical role in preparing the chromatin landscape for their binding and may serve as pioneer factors for the Tr1 lineage. Indeed our chromatin accessibility patterns data suggest that BATF and IRF1 prepare chromatin as crucial “early” mediators of IL-27-driven Tr1-specific transcription. Although smaller in scale than BATF deficiency, IRF1 deficiency altered a unique set of accessible regions and both TFs increased chromatin accessibility and facilitated binding of other transcription factors to the chromatin. Therefore, we propose that IRF1 is a “small-scale” pioneer factor affecting some chromatin regions that are indispensable for Tr1 differentiation. In contrast, BATF, which serves as a pioneer factor for a number of other cell types 15, 16, affected the chromatin landscape in undifferentiated TH0 cells and had global effects on Tr1
differentiation. This suggests a general role for BATF as a pioneering factor for T helper cell differentiation. Integration of RNA-seq and ATAC-seq indicates that the BATF-dependent network consists of several layers of transcriptional interactions and that loss of BATF completely alters the IL-27-induced transcriptional state. Importantly, BATF appears to regulate Il10 induction indirectly. The IRF1-dependent network is smaller, yet, IRF1 can regulate Tr1 differentiation both directly (through direct interaction of IRF1 with Il10, Prf1) and indirectly (through Stat1 and Klf7).
Our studies have uncovered the critical role of two TFs, IRF1 and BATF, in preparing the chromatin landscape for induction of the Tr1 gene network in response to IL-27 signaling, where BATF acts as a pioneer factor and prepares the genomic landscape for the binding of additional transcription factors that define the Tr1 lineage. IRF1 specifically transactivates Il10 gene expression and a smaller cluster of genes that characterize the Tr1 lineage, while restraining TH17 differentiation. Together these data define BATF and IRF1 as drivers of the
earliest steps in the induction of the Tr1 lineage.
MATERIALS AND METHODS
Animals
C57BL/6 (B6), B6.129S2-Irf1tm1Mak/J, B6.129S2-Batftm1.1mm/J and B6.SJL-PtprcaPepcb/ BoyJ (CD45.1) were purchased from the Jackson Laboratories. B6.129S6-Rag2tm1Fwa N12, 129S6/SvEv-Stat1tm1Rds and 129S6/SvEvTac controls were purchased from Taconic. Animals were maintained in a conventional, pathogen-free facility at the Harvard Institutes of Medicine (Boston, MA) and all experiments were carried out in accordance with guidelines prescribed by the Institutional Animal Care and Use Committee (IACUC) at Harvard Medical School.
A
uthor Man
uscr
ipt
A
uthor Man
uscr
ipt
A
uthor Man
uscr
ipt
A
uthor Man
uscr
ipt
In vitro T cell isolation and differentiation
CD4+ T cells from splenocytes and lymph nodes were isolated using CD4 microbeads (Miltenyi). Cells were further stained with antibodies against CD4, CD62L and CD44 and CD4+CD62hiCD44lo naive cells were sorted by BD FacsAria (BD Biosciences).
Sorted cells were cultured in DMEM supplemented with 10% (vol/vol) FCS, 50 mM mercaptoethanol, 1 mM sodium pyruvate, nonessential amino acids, L-glutamine, and 100 U/ml penicillin and 100 g/ml streptomycin. For in vitro Tr1 differentiation, naive
CD4+CD62LhiCD44lo cells were sorted by flow cytometry and stimulated with plate bound anti-CD3 (145-2C11, 2 μg/ml) and anti-CD28 (PV-1, 2 μg/ml) in the presence of 25 ng/ml IL-27 (Ebioscience). IL-10 expression was assessed by flow cytometry 3 days later. For TH17 differentiation, naive cells were stimulated in the presence of 20ng/ml rmIL-1β
(Miltenyi Biotec), 25ng/ml rmIL-6 (Miltenyi Biotec) and rmIL-23 (R&D Biosystems). For Treg differentiation, naive cells were stimulated in the presence of 2.5ng/ml rhTGF-β1 (R&D
Biosystems).
Flow cytometry staining and acquisition
Antibodies for flow cytometry were purchased from BioLegend and used as recommended by the manufacturer. For intracellular cytokine staining (ICS), cells were restimulated with PMA (Sigma, 50 ng/mL) and ionomycin (1 μg/ml, Sigma) and monensin (Golgistop; 1 μg/ml, BD Biosciences) for 4 hr. Following staining of surface markers, cells were fixed and permeabilized according to the manufacturer’s instructions (BD biosciences). Cells were then analyzed on LSRII (BD Biosciences).
Measurement of cytokines
Secreted cytokines were measured after 72 hours of culture with ELISA. Quantitative RT-PCR
RNA was extracted using RNAeasy microkit (Qiagen, USA), cDNA was prepared using iScript cDNA synthesis kit following the manufacturer’s instructions (Bio-Rad, USA) and used as template for real-time PCR run on the ViiA 7 Real-Time PCR System (Applied Biosystems). Expression was normalized to Gapdh. The following primers-probes mixtures were purchased from Applied Biosystems: Il10 (Mm01288386_m1), Irf1
(Mm01288580_m1), Batf (Mm00479410_m1), Il21 (Mm00517640_m1), Maf (Mm02581355_s1), AhR (Mm00478937_m1), Gapdh (Mm99999915_g1). Chromatin immunoprecipitation (ChIP) and sequential ChIP (Re-ChIP)
Cells were polarized in Tr1 conditions for 3 days, fixed with 1% formaldehyde for 10 mins and quenched with 0.125M glycine. Chromatin fraction preparation and chromatin IP was performed using SimpleChIP Enzymatic Chromatin IP (Cell Signaling Technology) according to the manufacturer’s instructions. The following antibodies were used: anti-IRF1 (Santa Cruz sc-640X), anti-BATF (Cell Signaling 8638S), anti-c-Maf (Santa Cruz sc-7866), anti-AhR (Enzo Life Sciences BML-SA210-0025), anti-trimethyl-Histone H3 (Lys4) (Millipore 07-473), anti-trimethyl-Histone H3 (Lys27) (Millipore 07-449), anti-Histone H3
A
uthor Man
uscr
ipt
A
uthor Man
uscr
ipt
A
uthor Man
uscr
ipt
A
uthor Man
uscr
ipt
(acetyl K9 (Abcam ab4441). For Re-ChIP, chromatin fraction was prepared as described above, and the chromatin IP was prepared using Re-ChIP-IT kit (Active Motif) according to manufacturer’s instructions. ChIP and Re-ChIP quantitative PCR (qPCR) was run on Viia7 Real-Time PCR System (Applied Biosystems) and relative expression was calculated using Ct values of the samples and inputs. Primers spanning Il17a and IL23r sites were described before29. The following primer pairs were used for the rest of the targets:
CNS-20B fw: 5′-TTGGTATTCAGGGTGCTGTTC-3′, CNS-20B rv: 5′ -GTCCCTGAGGTGGAGGATAATA-3′, CNS-9 fw: 5′-TTACAGAATGGCACTTCCAGAG-3′, CNS-9 rv: 5′- CGATGTATTAGTTCCGGTGTGT-3′, HSS-0.860 fw: 5′- ACCCAAACTGAGGTAGTAGGA-3′, HSS-0.860 rv: 5′- AGCTGTTGAAGGATGGAGATG-3′, HSS-0.610 fw: 5′- CCAAGGCTGGGACATTGTAA-3′, HSS-0.610 rv: 5′- CCAGCATGAGAAGTTAGGAGAAG-3′, HSS-2.0 fw: 5′- TCCTGAAACCCAGCTCAAATC-3′, HSS-2.0 rv: 5′- CAAGTAAGGACCATGCAGAGAG-3′, HSS-0.12 fw: 5′- TGAGTGCTAAGGTGACTTCC-3′, HSS-0.12 rv: 5′- CGCACTCCCAGGTCATAAT-3′, HSS+0.92 fw: 5′- GTTGACACAGGTGCTCTTGA-3′, HSS+0.92 rv: 5′- CCTCTTGGGATCCAGTTGTTT-3′, HSS+1.65 fw: 5′- CCTTAGAGCCACCCAACAAATA-3′, HSS+1.65 rv: 5′- CAGAGACAGATGAGCAAGAGAC-3′, HSS+2.98 fw: 5′- GCGTCTCTGGCAGTTTCTAA-3′, HSS+2.98 rv: 5′- TCACTCTCCTCAACACCTAGT-3′, HSS+6.45 fw: 5′- ACACACACACACACACACA-3′, HSS+6.45 rv: 5′- CACTTCCTTCCGATGGTTACTT-3′ MARE-1 fw: GGAGAAAGTGAAAGGGATGGAG MARE-1 rv: GGAATGGAATTGACTCAAGAACTG MARE-2 fw: ACCCTCTACATGGGTCTACTT MARE-2 rv: CAAGCAACTACTTGTCCTCCT MARE-3 fw: AACTGAGTGCTAAGGTGACTTC MARE-3 rv: TGGGCTATTCCAGAACATATTAGG MARE-4 fw: TGCACTACCAAAGCCACAA
A
uthor Man
uscr
ipt
A
uthor Man
uscr
ipt
A
uthor Man
uscr
ipt
A
uthor Man
uscr
ipt
MARE-4 rv: GATCCTCATGCCAGTCAGTAAG XRE-1 fw: CAGGTTGAGTGGAGGAAACAA XRE-1 rv: CCCTCATCTGTGGATTCCATTC Rorc1 fw: GCACAATGAGGGAACAGTAAGA Rorc1 rv: CAGGAACTGGAGCCAATCAA Rorc2 fw: TCACTCCTGCATCTTTCTCTTT Rorc2 rv: TGCGATGGAACAGATTGAAGA Luciferase assays
104 HEK293T cells were transfected with IL-10 firefly luciferase reporter constructs, renilla luciferase reporter and plasmids expressing IRF1, BATF, W11R30 or c-Maf using Fugene. Cells were analyzed 48h later with the dual luciferase assay kit (New England Biolabs). Fragments containing the proximal Il10 promoter (−1.5 kb including the HSS-0.12 site), and the CNS-9 or HSS+2.98 regions upstream of the Il10 minimal promoter were described before 9, 31 and were cloned into pGL4.10 Luciferase reporter plasmid (Promega).
Retroviral infection
Naive CD4+CD62LhiCD44low T cells were transduced with IRF1, BATF of
c-Maf-expressing retroviruses as described previously9 after activation with plate-bound anti-CD3 and anti-CD28 antibodies.
EAE induction, recall response and Tr1 transfer
For the induction of EAE, wildtype and Irf1−/− mice were immunized with 100μg of MOG35-55 peptide (MEVGWYRSPFSRVVHLYRNGK) and 500μg of M. tuberculosis
extract H37 Ra (Difco) emulsified in complete Freund’s adjuvant (CFA). Mice were further injected intraperitoneally (i.p.) with 200ng pertussis toxin on days 0 and 2. Disease was scored daily on a scale of 0–5. For assessment of recall responses, mice were injected with 100μg MOG emulfisied in CFA. Spleens and lymph nodes were collected ten days later, and re-stimulated in vitro in the presence of MOG35-55 (20μg/ml) and IL-23 or IL-27. Responses
were assessed by flow cytometry, cytokine measurement and nanostring on CD4+ sorted cells. For Tr1 transfer, wildtype, Irf1−/− and Batf−/− naive CD4+ T cells were polarized for three days in Tr1 conditions and 3x10⁶ cells were transferred into wildtype mice immunized with MOG35-55 10 days after disease induction.
Isolation of cells from the CNS
Wildtype, Irf1−/− and Batf−/− mice were sacrificed at indicated time points and perfused with PBS. Brains and spinal cords were cut into small pieces and digested with Collagenase D (2.5 mg/ml; Roche) and Deoxyribonuclease I (1 mg/ml; Sigma-Aldrich) at 37°C for 20 minutes. Mononuclear cells were isolated over a 37%/70% Percoll gradient (GE Healthcare) and used for cytokine analysis with flow cytometry, or further sorted for CD45hiCD3+CD4+ cells and used for qPCR.
A
uthor Man
uscr
ipt
A
uthor Man
uscr
ipt
A
uthor Man
uscr
ipt
A
uthor Man
uscr
ipt
NanoString gene expression analysis
Sorted CD4+ T cells were lysed using RLT buffer (Qiagen) and hybridized with a custom made CodeSet according to the manufacturer’s instructions. Barcodes were counted (1,150 field of view sample) on an nCounter Digital Analyzer following manufacturer’s protocol (NanoString Technologies Inc.). Data were analyzed using nSolver Analysis Software.
In vivo treatment with anti-CD3
Wildtype, Irf1−/− or Batf−/− mice were treated with 20μg of antibody targeted against CD3 (clone 2C11) or an isotype control administered i.p. every 3 days for a total of 3 times. Mice were sacrificed 4 hours after the last treatment. Il10 expression in the mesentheric lymph nodes was analyzed by intracellular staining.
Statistical analysis
Statistical analysis was performed using Prism software (Graph Pad software, La Jolla, CA, USA). Linear regression with a 95% confidence interval, and unpaired, two-tailed Student’s t-test were used for comparison of two groups. P values<0.05 were considered significant. (P < 0.05 = *; P < 0.01 = **; P < 0.001 = ***, P <0.0001 = ****).
ATAC-seq
Samples were prepared as described previously32. Paired-end 50bp sequences were generated from samples on an Illumina HiSeq2500. Sequences were mapped to the murine genome (mm9) with bowtie233 (2.2.3), filtered based on mapping score (MAPQ >= 30, Samtools (0.1.19)), and duplicates removed (Picard). We then identify peak-centered, accessible regions across all samples. For each sample individually, we ran Peakdeck34 (parameters –bin 75, -STEP 25, -back 10000, -npBack100000) and filtered peaks with a Praw<1E-4. We then limited accessible sequence to the region surrounding peak maxima,
using a custom script to find peak maxima and Bedtools35 (2.17.0) slop function to extend sequence by +/−25bp of the maxima. These peak-centric accessible regions were merged to generate a single reference peak annotation file, and reads per reference peak were counted with HTSeq-count36. This pipeline resulted in ~15 million reads per sample, ~30% of which mapped to the 180,478 identified peaks. We used DESeq237 to normalize and identify differentially accessible peaks across conditions. Downstream analysis and data visualization were performed in MATLAB R2014B.
RNA-seq
Samples were prepared as described previously38 and sequenced on Illumina Hi-Seq 2500. Sequences were mapped to the murine genome (mm10) with STAR39. DESeq2 was used to normalize and identify differentially expressed transcripts across conditions. Downstream analysis and data visualization were performed in MATLAB R2014B.
Transcriptional regulatory networks
To define the Tr1 Batf KO and Irf1 KO networks, we leveraged the quantitative nature of the ATAC-seq and RNA-seq datasets. Peaks were associated with putative transcription-factor (TF) binding events and target genes using a compendium of human and mouse TF motifs
A
uthor Man
uscr
ipt
A
uthor Man
uscr
ipt
A
uthor Man
uscr
ipt
A
uthor Man
uscr
ipt
downloaded from the ENCODE motif collection40 (http://compbio.mit.edu/encode-motifs) and the CisBP motif collection41 (http://cisbp.ccbr.utoronto.ca). Mouse motifs were also downloaded from the CisBP collection. We scanned peaks for individual motif occurrences with FIMO42 (parameters --thresh .00001, --max-stored-scores 500000, and a first-order background model). In addition to leveraging motifs of human TF orthologs, we increased the mouse TF coverage of our motif database by additionally considering TF family subclasses43. We took advantage of similarities among TF subfamily sequence preferences to detect potential binding events of poorly characterized TF subfamily members. Putative binding events were associated with a target gene, if the peak fell within +/−10kb of gene body. We used the KO RNA-seq datasets and defined potentially direct BATF or IRF1 regulatory interactions if (1) genes were differentially expressed (FDR=10% and had log2|
fold-change| >1) and (2) the TF’s motif occurred cis to the gene. To extend the networks, we defined sets of differentially expressed genes and tested (hypergeometric distribution, Praw<1E-3) whether differentially expressed TFs had motifs enriched cis to a given set of
genes, a procedure similar to Blatti et al44. In addition, we tested for enrichment limited to cis peaks having relevant patterns. For example, to define the BATF-dependent Tr1 network (e.g., the part of the network that turns “off”), we focused on the set of genes with decreased BATF-dependent expression, and searched for enrichment of TFs with decreased expression whose motif was either enriched cis when considering (1) all peaks or (2) only peaks that were decreased in accessibility (i.e., suggesting a concurrent decrease in binding event). For each KO Tr1 network, we looked for TF motif enrichment cis to genes increased (decreased) in expression and focusing on all peaks as well as those increased (decreased) in
accessibility (suggesting activating interactions), and, to recover both activating and inhibitory interactions, we looked for enrichment cis to all differentially expressed genes. We used correlation between TF and target gene expression to infer interaction sign.
Networks were visualized using a newly designed interactive interface45, based on iPython46 and packages: igraph47, numpy and scipy48. The networks can be downloaded as tab-delimited text files, visualized in iPython notebooks and launched as binders from https:// github.com/simonsfoundation/Tr1_batfKO.
Data availability
The data that support the findings of this study are available from the corresponding author upon request.
Supplementary Material
Refer to Web version on PubMed Central for supplementary material.
Acknowledgments
We thank Deneen Kozoriz (Evergrande Center) for cell sorting; Francisco Quintana (Harvard Medical School) for providing AhR mutant mice; the NYUMC genomics core (Adriana Heguy and Paul Zappile) for help with sequencing; Genome Technology Center (GTC) (at the Laura and Isaac Perlmutter Cancer Center supported by the Cancer Center Support Grant P30CA016087) for help with sequencing. We are most thankful to Mary Collins for advice and editing of the manuscript.
Funding:
A
uthor Man
uscr
ipt
A
uthor Man
uscr
ipt
A
uthor Man
uscr
ipt
A
uthor Man
uscr
ipt
NIH R01 NS 030843 to VKK NIH R01 NS 045937 to VKK NIH P01 AI073748 to VKK NIH P01 NS076410 to VKK NIH P01 AI039671 to VKK NIH 5P01 AI056299-10 to VKK
National Multiple Sclerosis Society Postdoctoral fellowship to KK Marie Curie IOF Postdoctoral fellowship to KK
NIH P01NS076410 to DL and MP NIH 5T32AI100853 to MP
NIH 1R01-DK103358-01 to ERM, RB, DL NIH 1R01-GM112192-01 to RB
NSF IOS-1126971 to RB
DBT-Welcome Trust intermediate fellowship (IA/I/12/1/500524) to AA Klarman Cell Observatory at the Broad Institute - AR
HHMI - AR
Koch Institute Support (core) Grant P30-CA14051 from the National Cancer Institute to AR
References
1. Roncarolo MG, et al. Interleukin-10-secreting type 1 regulatory T cells in rodents and humans. Immunol Rev. 2006; 212:28–50. [PubMed: 16903904]
2. Pot C, Apetoh L, Kuchroo VK. Type 1 regulatory T cells (Tr1) in autoimmunity. Seminars in immunology. 2011; 23:202–208. [PubMed: 21840222]
3. Astier AL, Meiffren G, Freeman S, Hafler DA. Alterations in CD46-mediated Tr1 regulatory T cells in patients with multiple sclerosis. J Clin Invest. 2006; 116:3252–3257. [PubMed: 17099776] 4. Barrat FJ, et al. In vitro generation of interleukin 10-producing regulatory CD4(+) T cells is induced
by immunosuppressive drugs and inhibited by T helper type 1 (Th1)- and Th2-inducing cytokines. J Exp Med. 2002; 195:603–616. [PubMed: 11877483]
5. Awasthi A, et al. A dominant function for interleukin 27 in generating interleukin 10-producing anti-inflammatory T cells. Nature immunology. 2007; 8:1380–1389. [PubMed: 17994022]
6. Fitzgerald DC, et al. Suppressive effect of IL-27 on encephalitogenic Th17 cells and the effector phase of experimental autoimmune encephalomyelitis. Journal of immunology. 2007; 179:3268– 3275.
7. Wang H, et al. IL-27 induces the differentiation of Tr1-like cells from human naive CD4+ T cells via the phosphorylation of STAT1 and STAT3. Immunology letters. 2011; 136:21–28. [PubMed: 21115047]
8. Batten M, et al. Interleukin 27 limits autoimmune encephalomyelitis by suppressing the
development of interleukin 17-producing T cells. Nature immunology. 2006; 7:929–936. [PubMed: 16906167]
9. Apetoh L, et al. The aryl hydrocarbon receptor interacts with c-Maf to promote the differentiation of type 1 regulatory T cells induced by IL-27. Nature immunology. 2010; 11:854–861. [PubMed: 20676095]
A
uthor Man
uscr
ipt
A
uthor Man
uscr
ipt
A
uthor Man
uscr
ipt
A
uthor Man
uscr
ipt
10. Pot C, et al. Cutting edge: IL-27 induces the transcription factor c-Maf, cytokine IL-21, and the costimulatory receptor ICOS that coordinately act together to promote differentiation of IL-10-producing Tr1 cells. Journal of immunology. 2009; 183:797–801.
11. Iwasaki Y, et al. Egr-2 transcription factor is required for Blimp-1-mediated IL-10 production in IL-27-stimulated CD4+ T cells. European journal of immunology. 43:1063–1073.
12. Chang JT, Wherry EJ, Goldrath AW. Molecular regulation of effector and memory T cell differentiation. Nature immunology. 2014; 15:1104–1115. [PubMed: 25396352]
13. Josefowicz SZ. Regulators of chromatin state and transcription in CD4 T-cell polarization. Immunology. 2013; 139:299–308. [PubMed: 23590627]
14. Tripathi SK, Lahesmaa R. Transcriptional and epigenetic regulation of T-helper lineage specification. Immunological reviews. 2014; 261:62–83. [PubMed: 25123277]
15. Ciofani M, et al. A validated regulatory network for Th17 cell specification. Cell. 2012; 151:289– 303. [PubMed: 23021777]
16. Kurachi M, et al. The transcription factor BATF operates as an essential differentiation checkpoint in early effector CD8+ T cells. Nature immunology. 2014; 15:373–383. [PubMed: 24584090] 17. Owaki T, et al. A role for IL-27 in early regulation of Th1 differentiation. Journal of immunology.
2005; 175:2191–2200.
18. Pot C, Apetoh L, Awasthi A, Kuchroo VK. Induction of regulatory Tr1 cells and inhibition of T(H)17 cells by IL-27. Seminars in immunology. 2011; 23:438–445. [PubMed: 21893418] 19. Bettelli E, et al. Myelin oligodendrocyte glycoprotein-specific T cell receptor transgenic mice
develop spontaneous autoimmune optic neuritis. The Journal of experimental medicine. 2003; 197:1073–1081. [PubMed: 12732654]
20. Schraml BU, et al. The AP-1 transcription factor Batf controls T(H)17 differentiation. Nature. 2009; 460:405–409. [PubMed: 19578362]
21. Im SH, Hueber A, Monticelli S, Kang KH, Rao A. Chromatin-level regulation of the IL10 gene in T cells. J Biol Chem. 2004; 279:46818–46825. [PubMed: 15319439]
22. Jones EA, Flavell RA. Distal enhancer elements transcribe intergenic RNA in the IL-10 family gene cluster. J Immunol. 2005; 175:7437–7446. [PubMed: 16301651]
23. Mosser DM, Zhang X. Interleukin-10: new perspectives on an old cytokine. Immunological reviews. 2008; 226:205–218. [PubMed: 19161426]
24. Sjostrand M, et al. Expression of the immune regulator tripartite-motif 21 is controlled by IFN regulatory factors. Journal of immunology. 2013; 191:3753–3763.
25. Yoshida K, et al. Active repression of IFN regulatory factor-1-mediated transactivation by IFN regulatory factor-4. Int Immunol. 2005; 17:1463–1471. [PubMed: 16172134]
26. Ise W, et al. The transcription factor BATF controls the global regulators of class-switch recombination in both B cells and T cells. Nature immunology. 2011; 12:536–543. [PubMed: 21572431]
27. Hirahara K, et al. Asymmetric Action of STAT Transcription Factors Drives Transcriptional Outputs and Cytokine Specificity. Immunity. 2015; 42:877–889. [PubMed: 25992861]
28. Li P, et al. BATF-JUN is critical for IRF4-mediated transcription in T cells. Nature. 2012; 490:543– 546. [PubMed: 22992523]
29. Glasmacher E, et al. A genomic regulatory element that directs assembly and function of immune-specific AP-1-IRF complexes. Science. 2012; 338:975–980. [PubMed: 22983707]
30. Eason DD, Shepherd AT, Blanck G. Interferon regulatory factor 1 tryptophan 11 to arginine point mutation abolishes DNA binding. Biochim Biophys Acta. 1999; 1446:140–144. [PubMed: 10395927]
31. Lee CG, et al. A distal cis-regulatory element, CNS-9, controls NFAT1 and IRF4-mediated IL-10 gene activation in T helper cells. Mol Immunol. 2009; 46:613–621. [PubMed: 18962896] 32. Buenrostro JD, Giresi PG, Zaba LC, Chang HY, Greenleaf WJ. Transposition of native chromatin
for fast and sensitive epigenomic profiling of open chromatin, DNA-binding proteins and nucleosome position. Nat Methods. 2013; 10:1213–1218. [PubMed: 24097267]
33. Langmead B, Salzberg SL. Fast gapped-read alignment with Bowtie 2. Nat Methods. 2012; 9:357– 359. [PubMed: 22388286]
A
uthor Man
uscr
ipt
A
uthor Man
uscr
ipt
A
uthor Man
uscr
ipt
A
uthor Man
uscr
ipt
34. McCarthy MT, O’Callaghan CA. PeaKDEck: a kernel density estimator-based peak calling program for DNaseI-seq data. Bioinformatics. 2014; 30:1302–1304. [PubMed: 24407222] 35. Quinlan AR, Hall IM. BEDTools: a flexible suite of utilities for comparing genomic features.
Bioinformatics. 2010; 26:841–842. [PubMed: 20110278]
36. Anders S, Pyl PT, Huber W. HTSeq--a Python framework to work with high-throughput sequencing data. Bioinformatics. 2015; 31:166–169. [PubMed: 25260700]
37. Love MI, Huber W, Anders S. Moderated estimation of fold change and dispersion for RNA-seq data with DESeq2. Genome Biol. 2014; 15:550. [PubMed: 25516281]
38. Shishkin AA, et al. Simultaneous generation of many RNA-seq libraries in a single reaction. Nat Methods. 2015; 12:323–325. [PubMed: 25730492]
39. Dobin A, et al. STAR: ultrafast universal RNA-seq aligner. Bioinformatics. 2013; 29:15–21. [PubMed: 23104886]
40. Kheradpour P, Kellis M. Systematic discovery and characterization of regulatory motifs in ENCODE TF binding experiments. Nucleic Acids Res. 2014; 42:2976–2987. [PubMed: 24335146]
41. Weirauch MT, et al. Determination and inference of eukaryotic transcription factor sequence specificity. Cell. 2014; 158:1431–1443. [PubMed: 25215497]
42. Grant CE, Bailey TL, Noble WS. FIMO: scanning for occurrences of a given motif. Bioinformatics. 2011; 27:1017–1018. [PubMed: 21330290]
43. Wingender E, Schoeps T, Donitz J. TFClass: an expandable hierarchical classification of human transcription factors. Nucleic Acids Res. 2013; 41:D165–170. [PubMed: 23180794]
44. Blatti C, Kazemian M, Wolfe S, Brodsky M, Sinha S. Integrating motif, DNA accessibility and gene expression data to build regulatory maps in an organism. Nucleic Acids Res. 2015; 43:3998– 4012. [PubMed: 25791631]
45. Watters AM, ER, Martins de Castro D, Pokrovskii M, Bonneau R. A fast-adapting, scriptable framework for gene regulatory network visualization. Submitted.
46. Pérez FG, BE. IPython: A System for Interactive Scientific Computing. Computing in Science & Engineering. Jun 18.2007 9:21–29.
47. Csardi GN, Tamas. The igraph software package for complex network research. InterJournal, Complex Systems. 2006:1–9.
48. Oliphant TE. Python for scientific computing. Computing in Science & Engineering. 2007; 9:10– 20.
A
uthor Man
uscr
ipt
A
uthor Man
uscr
ipt
A
uthor Man
uscr
ipt
A
uthor Man
uscr
ipt
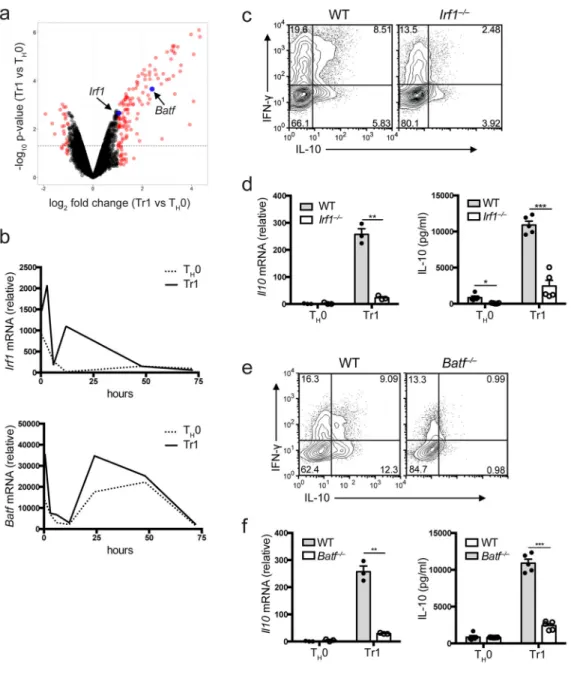
Figure 1. IRF1 and BATF are required for Tr1 differentiation in vitro
Naïve CD4+ T cells isolated from wildtype mice were primed with IL-27 in the presence of anti-CD3 and anti-CD28 antibodies (a) Volcano plot analysis for samples collected at 2 hours post cell stimulation. Depicted is time point of log2 fold-change (x-axis) versus -log10
p-value (y-axis, representing the probability that the gene is differentially expressed). Black dotted line marks p-value 0.05 and red dots marks fold change higher or lower than two. Irf1 and Batf marked in blue. (b) Irf1 and Batf mRNA expression measured by qPCR over 72 hours following cell stimulation. Analysis of Tr1 differentiation in Irf1−/− cells 72 hours after cell priming with IL-27 measured by (c) flow cytometry (d) qPCR (left, n=3 samples) and ELISA (right, n=5 samples). Analysis of Tr1 differentiation in Batf−/− cells 72 hours after cell priming with IL-27 measured by (e) flow cytometry (f) qPCR (left, n=3 samples) and ELISA (right, n=5 samples). Dots represent biological replicates. Data are representative
A
uthor Man
uscr
ipt
A
uthor Man
uscr
ipt
A
uthor Man
uscr
ipt
A
uthor Man
uscr
ipt
of three independent experiments (b), representative of four independent experiments (c, e), or are pooled from three independent experiments (d, f). *P < 0.001, **P < 0.0001 (unpaired t-test, error bars represent mean ±s.e.m.).
A
uthor Man
uscr
ipt
A
uthor Man
uscr
ipt
A
uthor Man
uscr
ipt
A
uthor Man
uscr
ipt
Figure 2. The effects of IRF1 and BATF deficiency on Tr1 function
(a) Irf1 mRNA expression in Stat1−/− (left) and Stat3−/− (right) cells primed in the presence of IL-27. (b) Batf mRNA expression in Stat1−/− (left) and Stat3−/− (right) cells primed in the presence of IL-27. (c) Effects of IRF1 and BATF retroviral overexpression on Il10, Il21, Maf and AhR expression in cells treated in TH0 or Tr1 conditions; mRNA levels were quantified using qPCR. Data are pooled from 3 independent experiments (a (Stat1−/−), b, c; n=3
samples, dots represent biological replicates) or representative of 4 independent experiments (a (Stat3−/−); n=3 samples, dots represent technical replicates). NS, not significant (P >
0.05); *P < 0.05, **P < 0.01, ***P < 0.001 and ****P < 0.0001 (unpaired t-test, error bars represent mean ±s.e.m.).
A
uthor Man
uscr
ipt
A
uthor Man
uscr
ipt
A
uthor Man
uscr
ipt
A
uthor Man
uscr
ipt
Figure 3. IRF1 affects induction and resolution of autoimmune disease
(a) EAE scores in WT and Irf1−/− mice were immunized with MOG35-55, n=24 mice (WT)
or n=27 mice (Irf1−/−) (left); linear regression curve including the 95% confidence band of the regression line (middle); maximum scores (right). (b) Cytokine expression in CD4+ T cells isolated from the CNS of WT and Irf1−/− mice at the peak of disease. (c) Frequency of IL-17A+ and IFN-γ+ cells within the CD4+ T cells isolated from the CNS (n=5 mice). (d)
EAE course in Rag2−/− mice with 2D2 or Irf1−/−2D2 CD4+ T cells transferred, followed by
MOG35-55 immunization; n=8 mice/group. (e) Spontaneous EAE scores in 2D2 (n=5 mice)
and Irf1−/− 2D2 mice (n=7 mice). (f) Spleens and lymph nodes from WT and Irf1−/−
immunized mice were cultured with different concentration of MOG35-55. 3H thymidine was
added to assess cell proliferation; n=5 samples. (g) Cytokine expression in CD4+ T cells isolated from WT and Irf1−/− mice immunized with MOG35-55 and cultured with
A
uthor Man
uscr
ipt
A
uthor Man
uscr
ipt
A
uthor Man
uscr
ipt
A
uthor Man
uscr
ipt
MOG35-55±IL23. (h) Quantification of (g); n=5 mice. Data are pooled from four
independent experiments (a), representative of two independent experiments (b, f, g), or pooled from two independent experiments (c, d, h). Dots represent individual mice. *P < 0.05, **P < 0.01, ***P < 0.001 and ****P < 0.0001. Data represent mean ±s.e.m (linear regression (a (EAE plot), d; unpaired t-test (a (max score), c, f, h).
A
uthor Man
uscr
ipt
A
uthor Man
uscr
ipt
A
uthor Man
uscr
ipt
A
uthor Man
uscr
ipt
Figure 4. IRF1 and BATF control generation of IL-10+ Tr1 cells in vivo
(a) Il10 expression in CD4+ T cells isolated from the CNS and dLNs (draining lymph nodes)
of WT and Irf1−/− mice immunized with MOG35-55. Floating bars indicate min to max with
a line at mean. (b) Gene expression fold change between CD4+ T cells isolated from wildtype mice immunized with MOG35-55 and re-stimulated in the presence of MOG35-55 ±
IL-27. Genes with at least 2-fold change (MOG+IL-27/MOG) are shown. (c) Differential gene expression in WT, Irf1−/− and Batf−/− CD4+ T cells isolated from mice immunized with MOG35-55 and restimulated with MOG35-55 and IL-27. Gene-set created in (b) was used to
generate the heatmap. (d) Tr1-polarized CD4+ T cells isolated from WT, Irf1−/− or Batf−/− mice were transferred into WT mice 10 days after EAE induction; n=7 mice (No Tr1, Batf
−/−), n=8 (Irf1−/−), n=10 (WT Tr1). (e) IL-10 expression in mesenteric lymph nodes (MLN)
from WT, Irf1−/− and Batf−/− mice injected with anti-CD3 antibody or an isotype control
A
uthor Man
uscr
ipt
A
uthor Man
uscr
ipt
A
uthor Man
uscr
ipt
A
uthor Man
uscr
ipt
(IC). (f) Splenocytes from mice in (e) were cultured for 72 hours, ELISA was used to measure IL-10 in the cultures. Dots represent individual mice. Data are pooled from three independent experiments (a), pooled from two independent experiments (b, c, d),
representative of two independent experiments with n=3–4 mice pooled/group per
experiment (e) or representative of two independent experiments (f). *P < 0.05, **P < 0.01 and ***P < 0.0001. Data represent mean ±s.e.m (unpaired t-test (a, f); linear regression analysis (d)).
A
uthor Man
uscr
ipt
A
uthor Man
uscr
ipt
A
uthor Man
uscr
ipt
A
uthor Man
uscr
ipt
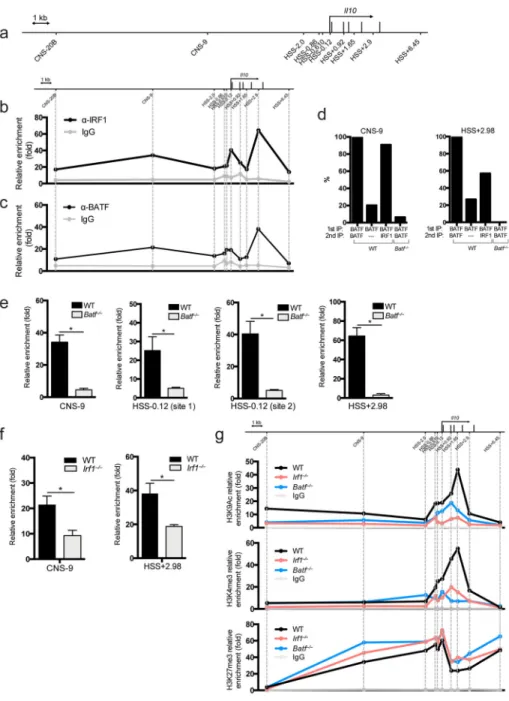
Figure 5. IRF1 and BATF bind to the Il10 locus
(a) Schematic drawing of the Il10 locus; known CNS and HSS sites are marked. ChIP analysis of (b) IRF1 (n=2 samples) and (c) BATF (n=3 samples) interactions within the Il10 promoter in WT Tr1 cells polarized for 72 hrs. (d) Sequential ChIP analysis of BATF and IRF1 interactions in the CNS-9 and HSS+2.98 regions of the Il10 promoter in WT and Batf
−/− cells differentiated in the presence of IL-27. (e) ChIP analysis of IRF1 binding in the
CNS-9, HSS-0.12, HSS+2.98 sites of the Il10 promoter in WT and Batf−/− cells differentiated in Tr1 conditions; n=2 samples. (f) ChIP analysis of BATF binding in the CNS-9, and HSS+2.98 sites of the Il10 promoter in WT and Irf1−/− cells differentiated in Tr1 conditions; n=3 samples. (g) ChIP analysis of epigenetic marks recruitment to the Il10 promoter in WT, Irf1−/− and Batf−/− cells differentiated in Tr1 conditions. Data are
A
uthor Man
uscr
ipt
A
uthor Man
uscr
ipt
A
uthor Man
uscr
ipt
A
uthor Man
uscr
ipt
representative of three independent experiments with similar results (b, c, e, f) or two independent experiments (d, g). *P < 0.05 (unpaired t-test, error bars represent mean ±s.e.m.).
A
uthor Man
uscr
ipt
A
uthor Man
uscr
ipt
A
uthor Man
uscr
ipt
A
uthor Man
uscr
ipt
Figure 6. IRF1 and BATF control the Il10 locus
Luciferase activity in 293T cells transfected with different IL-10 luciferase reporters in the presence of constructs encoding IRF1, IRF1 DNA-binding mutant W11R, c-Maf and BATF. RLU (Relative Light Units) are shown. (a) Proximal promoter indicates the proximal 1.5 kb region of the promoter. (b) CNS-9 and HSS+2.98 reporters contain the Il10 promoter fragments cloned upstream of the Il10 minimal promoter. (c) Il10 expression (mRNA) in WT and Irf1−/− CD4+ T cells retrovirally transduced with c-Maf and cultured in TH0 or Tr1
conditions (d) Il10 expression (mRNA) in WT and Batf−/− CD4+ T cells retrovirally transduced with c-Maf and cultured in TH0 or Tr1 conditions (e) ChIP analysis of c-Maf
interactions with c-Maf-binding sites (MARE-1--4) in the Il10 promoter in WT and Irf1−/− Tr1 polarized cells. (f) ChIP analysis of AhR interactions with AhR-binding site XRE-1 in the Il10 promoter in WT, Irf1−/− and Batf−/− Tr1 polarized cells. Data are representative of three independent experiments (a, b; n=3 samples), representative of two independent experiments (c, d; n=3 samples) or pooled from two independent experiments (e, f). Dots
A
uthor Man
uscr
ipt
A
uthor Man
uscr
ipt
A
uthor Man
uscr
ipt
A
uthor Man
uscr
ipt
represent technical replicates (a, b, c, d) or biological replicates (e, f). NS, not significant (P > 0.05); *P < 0.05, **P < 0.01, ***P < 0.001 and ****P < 0.0001.
A
uthor Man
uscr
ipt
A
uthor Man
uscr
ipt
A
uthor Man
uscr
ipt
A
uthor Man
uscr
ipt
Fig 7. BATF- and IRF1-deficiences uniquely contribute to Tr1 chromatin and transcriptional landscapes
(a) Heatmap of normalized ATAC-seq peak intensities (log2-fold-changes relative to the
mean for each peak). Limited to (6017) peaks that are condition-dependent with log2|FC|>3
and FDR=1% for at least one pairwise comparison of interest. (b) PCA of the 72h conditions, using all ATAC-seq peaks in the dataset (180,478 DESeq2-normalized peak intensities). (c) Number of differentially accessible peaks detected using DESeq2, comparing Tr1 KO (knockouts) to control cells at 72h, log2|FC|>1 and FDR=10%
(Subsampled, each comparison had n=2 (KO), n=6 (control)). Estimates of log2
-fold-changes in gene expression from RNA-seq data, comparing either Batf−/− or Irf1−/− and
A
uthor Man
uscr
ipt
A
uthor Man
uscr
ipt
A
uthor Man
uscr
ipt
A
uthor Man
uscr
ipt
control Tr1 cells (log2|FC|>1, FDR=10%) for DNA-binding proteins (d) and cytokines and
cytokine receptors (e). RNA-seq and ATAC-seq datasets were integrated to generate putative transcriptional regulatory networks for Irf1−/− (f–g) and Batf−/− (h–i) Tr1 cells. Nodes represent differentially expressed transcription factors and target genes, colored according to relative gene expression (log2(KO/Control)) at 72h; red and blue indicate high and low
relative expression, respectively. Edges are drawn between TFs and putative gene targets if that differentially expressed TF’s motif was enriched in ATAC-seq peaks cis to genes that were increased or decreased in response to KO (Praw<10−3, hypergeometric CDF). Edge
colors (blue - inhibitory, red - activating) are based on correlation between TF and putative target gene expression. “ON” indicates genes de-repressed in the knockout cells, while “OFF” indicates genes repressed in the knockout cells.


![[PDF] Formation avancé sue les fonctions dans le langage MATLAB | Cours informatique](data:image/gif;base64,R0lGODlhAQABAIAAAP///wAAACH5BAEAAAAALAAAAAABAAEAAAICRAEAOw==)