aMarc Kieke and Frank Feyerabend: These authors contributed equally to this study.
*Corresponding author: Dr. Frank Feyerabend, Helmholtz-Zentrum Geesthacht, Institute of Materials Science, Division Metallic Biomaterials, Department for Material Design and Characterization, Max-Planck-Str. 1, 21502 Geesthacht, Germany,
Phone: +49 (0)4152 871259, Fax: +49 (0)4152 872595, E-mail: [email protected].
http://orcid.org/0000-0001-9532-0207
Marc Kieke and Peter Behrens: Institute for Inorganic Chemistry, Leibniz University of Hannover, Callinstr. 9, 30167 Hannover, Germany
Jacques Lemaitre: École Polytechnique Fédèrale de Lausanne, EPFL STI-DO, MXD 337 (Bâtiment MXD), Station 12, CH-1015 Lausanne, Switzerland
Regine Willumeit-Römer: Helmholtz-Zentrum Geesthacht, Institute of Materials Science, Division Metallic Biomaterials, Max-Planck-Str. 1, 21502 Geesthacht, Germany
Letter
Marc Kieke
a, Frank Feyerabend
a,*, Jacques Lemaitre, Peter Behrens and Regine Willumeit-Römer
Degradation rates and products of pure magnesium
exposed to different aqueous media under
physiological conditions
DOI 10.1515/bnm-2015-0020
Received November 24, 2015; accepted April 1, 2016; previously published online April 29, 2016
Abstract: As magnesium and many of its alloys are a
prom-ising class of degradable implant materials, a thorough understanding of their degradation under physiological conditions is a key challenge in the field of biomaterial sci-ence. In order to increase the predictive power of in vitro studies, it is necessary to imitate the in vivo conditions, track the decomposition process and identify the products that form during the degradation pathway. In this in vitro study, slices of pure magnesium were exposed to Hank’s Balanced Salt Solution (HBSS), Dulbecco’s Modified Eagle Medium (DMEM) and simulated body fluid (SBF), respec-tively, under cell culture conditions, which included CO2 gassing. The series were repeated with supplements of fetal bovine serum (FBS), added to the respective media. Degradation rates, osmolality and pH were found to vary with the choice of medium and supplementation with proteins. In order to identify the crystalline degrada-tion products, the crusts formed on the specimens were investigated via X-ray diffraction (XRD) measurements. As
expected, brucite, Mg(OH)2, was found among the degra-dation products; interestingly, nesquehonite, Mg(HCO3) (OH)·2H2O, was found to be the dominant degradation product in this study. The experimental data are well in accordance with solubility calculations.
Keywords: brucite; Dulbecco’s Modified Eagle Medium;
Hank’s Balanced Salt Solution; nesquehonite; pure mag-nesium; simulated body fluid.
Introduction
Magnesium and its alloys have gained increasing interest in the field of temporary implant materials [1]. Biodegrad-able cardiovascular magnesium stents were successfully tested for clinical applications [2, 3]. Due to its mechanical properties, which are similar to those of bone, magnesium is also of high interest for orthopedic research [4]. Also, metallic magnesium and its degradation product magne-sium hydroxide show osteoconductive properties [5, 6].
As magnesium is highly susceptible to degradation in aqueous environments, efforts have been made both to decelerate as well as to exploit this process. For the application as a part of large, load-bearing prosthesis, an uncontrolled, i.e. too rapid, degradation is obviously a major disadvantage. On the other hand, the osteocon-ductive properties mentioned can support the incorpora-tion of an implant made of or coated with magnesium or magnesium compounds [7, 8]. Thus, the degradation of metallic magnesium is an obstacle as well as an oppor-tunity in the field of degradable biomaterials. A thorough understanding of the kinetics and mechanisms of this process is therefore crucial in order to better evaluate the degradation behavior and in this way increase the predic-tive power of in vitro studies, the results of which have so far often differed considerably from those of in vivo studies [4, 9]. In vitro degradation setups provide many opportunities to follow the course of decomposition online, such as pH and conductivity monitoring [10, 11],
but the identity of the degradation products formed from magnesium and the supplements of the media cannot be derived from these parameters alone. Electron-dispersive X-ray spectroscopy (EDS) analysis can be performed discontinuously on the degradation products to gain information on their composition, but without provid-ing speciation between different products with the same elemental formula. Moreover, most instruments only give semi-quantitative data, because they are not calibrated to the respective elements. X-ray diffraction (XRD) measure-ments provide more detailed information at least about the crystalline degradation products.
Magnesium hydroxide is the dominant crystalline degradation product of magnesium and its alloys upon exposure to aqueous media, as has been shown before by various studies [12]. As the solubility of the hardly soluble Mg(OH)2 can be increased, for example, by the presence of chloride ions [13, 14] and by buffering of pH, magne-sium hydroxide is not the only product which can be expected. Alternative products such as phosphates and carbonates, respectively, were found in various studies. In an in vivo approach, a magnesium containing calcium phosphate (MgxCay(PO4)z) was found after the degradation on the surface of a Mg-Mn-Zn alloy [7], while the degra-dation of a magnesium rare-earth alloy led to the in vitro formation of complex products with the general formula (Mg,Ca)x(PO4)y(CO3)z(OH)I [15]. The formation of magne-sium carbonates (MgCO3) was reported by various authors, when pure magnesium was exposed to different aqueous media [16, 17]. However, many studies did not distinguish between different modifications of the carbonates and phosphates, respectively.
With regard to the issues mentioned, it is of central interest to estimate the degradation rates and products of magnesium exposed to aqueous media under con-ditions similar and relevant to in vivo concon-ditions. For this purpose, we have studied the degradation of pure magnesium under cell culture conditions in cell-free media. As the respective media Hank’s Buffered Salt Solution (HBSS), simulated body fluid (SBF) and Dul-becco’s Modified Eagle Medium (DMEM) were applied. The cell culture conditions included a CO2 (5%) and O2 (21%) gassing, as well as a temperature of 37 °C and 95% relative humidity over the entire experiment. In an additional set of experiments, fetal bovine serum was added to all the above-mentioned media to include the influence of bioorganic components. Degradation rates were determined by measuring the weight loss of the samples. In order to identify the degradation products, the specimens were investigated by scanning electron microscopy (SEM) and XRD. The latter is suitable for the
identification of crystalline phases that may have formed and have been deposited during the degradation process either directly or by follow-up reactions.
Materials and methods
Magnesium casting
A magnesium ingot (purity 99.95 wt.%) was prepared by perma-nent mold casting. The material was molten under a protective atmosphere (Ar+2% SF6) at a temperature of 750 °C. The melt was
stirred for 30 min with 200 rpm prior to casting the material into pre-heated molds (550 °C) made out of mild steel. To assure cleanliness of the cast ingots, a filter (Foseco SIVEX FC, Foseco GmbH, Borken, Germany) was used. Cylindrical specimens with a diameter of 10 mm and a height of 1.5 mm were cut from the cast blocks via electrical discharge machining. Apart from sterilization the samples were used without further treatment.
Degradation media
Three different media were used for the degradation tests: (I) HBSS without Ca2+ and Mg2+ ions (Life Technologies, Darmstadt, Germany)
as a low-buffered solution; (II) DMEM Glutamax-I (Life Technologies, Darmstadt, Germany) as a more complex, highly buffered solution, and (III) SBF (SBF-JL2, according to [18]). For the preparation of the SBF two solutions were prepared. All chemicals were obtained from Merck (Darmstadt, Germany). (I) Solution A: 6.129 g NaCl, 5.89 g NaHCO3 and 0.498 g Na2HPO4·2H2O were dissolved in 1 L of
double-distiled water. After dissolution, 0.934 mL of 1 M HCl was added. (II) Solution B: 6.129 g NaCl and 0.54 g CaCl2 were dissolved in 1 L
double-distiled water and 0.934 mL of 1 M HCl was added. Both solutions were kept separately in the fridge and mixed (1:1) directly before the experiment. The pH value of the resulting solution was 7.4. A com-parison of the compositions is given in Table 1. In a second set of experiments, 10% or 20% FBS (FBS, PAA Laboratories, Linz, Austria) were added to these media.
Determination of degradation rate, pH and osmolality
The degradation rate was determined by weight loss. Each sample was weighed (Scaltec SBA52, Scaltec Instruments GmbH, Göttingen, Germany) and sterilized (20 min in ultrasonic bath with 70% ethanol) prior to the immersion (n = 6 per solution). After 3 days of incubation under cell culture conditions the samples were taken from the differ-ent media and dried at 37 °C under vacuum overnight. Degradation residues from the samples were removed by immersion in chro-mic acid (180 g/L in distiled water, VWR International, Darmstadt, Germany). The immersion was carried out two times for 10 min, with the samples being turned over in between. Afterwards the samples were rinsed in distiled water and 100% ethanol. After drying, the weight of the samples was measured again and the degradation rate (DR) was calculated according to equation 1 [19].
4
8.76 10 DR= A t ρ⋅ ⋅∆W
⋅ ⋅ (1)
where A is the surface area in cm2, t is the time in hours, ρ is the
density of pure Mg (1.74 g/cm3) and ΔW is the observed mass loss in g.
After the immersion of the specimens the different media were removed from the wells and used for analysis of the pH value and osmolality. Solutions without samples were incubated in parallel as controls. The pH value was measured by a standard laboratory pH meter (Sentron SI600, Sentron Europe BV, Roden, The Netherlands) with an ISFET electrode. The osmolality of the supernatants was analyzed by a cryoscopic osmometer (Osmomat Auto, Gonotec GmbH, Berlin, Germany). Fifty microliters of the supernatant were used for the measurement. The device is a freezing point osmometer which determines the osmolality by measuring the freezing point. This decreases by 1.86 °C when 1 mole of a nonionic solute is added to 1 kg of solvent [20].
Identification of degradation products
Immersion procedure: Pure magnesium samples were sonificated for 20 min in dry isopropanol, dried and gamma-sterilized at the in core irradiation (ICI) facility of the Geesthacht Neutron Facility with a total dosage of 29 kGy. All specimens were immersed under sterile conditions in 1 mL (solid/liquid ratio of 0.2 g/mL) of the respective media in agarose-coated 12-well plates (Greiner Bio-One, Frickenhausen, Germany). Then the samples were incubated under cell culture conditions (37 °C, 5% CO2, 21% O2 and 95% relative
humid-ity) in an incubator (Heraeus BBD 6620, Fisher Scientific, Schwerte, Germany). The immersion time was 1, 2, 3, 4 and 7 days, respectively. Neither a pH adjustment nor a liquid stream was applied. After the immersion all samples were rinsed with deionized water for 1 min, dried under vacuum and stored at room temperature. Immersion experiments were performed in duplicate.
Characterization: The samples were visualized using a scanning electron microscope (SEM; Auriga, Zeiss, Oberkochen, Germany) to visualize the degradation layers. Images were taken at an acceler-ating voltage of 20 keV with the secondary electron detector (SE2). In order to identify the crystalline products formed and deposited, XRD measurements were performed on a Stoe Theta/Theta diffrac-tometer (Stoe, Darmstadt, Germany) in reflection mode using Cu Kα radiation (λ = 1.54060 Å). The 2Θ range was scanned applying a step size of 0.01° (3.0 s per step). The diffractometer was oper-ated at 40 kV and 30 mA. No further sample preparations were made for the XRD measurements. All samples were placed flatly in a sample holder and adjusted to the X-ray beam.
Thermodynamical solubility calculations: Additionally to the for-mation of brucite and magnesite in HBSS some other degradation products can form. Besides Mg2+ and carbonates, SBF and cell culture
media may contain various ions, including Na+, K+, Ca2+, Cl–,
phos-phate and sulfate ions. In standard incubation conditions [tempera-ture T = 37 °C, partial CO2 pressure p(CO2) = 5.0%, pH close to 7.5], the
dominating carbonate and phosphate soluble species are HCO3– and
HPO42–, respectively. In SBF and culture media containing Ca2+ and
phosphate ions, the following precipitation reactions should also be considered:
1. Precipitation of magnesium phosphate (Mg3(PO4)2·8H2O,
bobierrite):
2 2
4 2 3 4 2 2
3Mg aq 2HPO aq 8H O+( )+ −( )+ →Mg PO 8H O(s) 2H a( ) · + +( q) (2) 2. Precipitation of calcium hydroxide (Ca(OH)2, portlandite):
2
2
Ca aq 2OH aq Ca(O+( )+ −( )→ H)(s) (3) 3. Precipitation of calcium carbonate (CaCO3, calcite):
2
3 3
(aq) (aq)
Ca+ +HCO− →CaCO (s) H (aq)+ + (4)
Table 1: Compositions of the used corrosion media.
Ingredient
mg/L HBSSmM mg/L DMEMmM mg/L SBFmM
Amino acids 1852 10.29
Vitamins 31.6 0.15
Inorganic salts
Calcium chloride (CaCl2·2H2O) 264 1.80 270 1.84
Ferric nitrate (Fe(NO3)3·9H2O) 0.1 0.000248
Hydrochloric acid (HCl) 934 0.934
Magnesium sulfate (MgSO4·7H2O) 200 0.813
Potassium chloride (KCl) 400 5.37 400 5.37
Potassium phosphate monobasic (KH2PO4) 60 0.44
Sodium bicarbonate (NaHCO3) 350 4.17 3700 44.04 2945 35.06
Sodium chloride (NaCl) 8000 136.98 6400 109.51 6129 104.88
Sodium phosphate monobasic (NaH2PO4·2H2O) 141 0.9
Sodium phosphate dibasic (Na2HPO4) anhydrous 48 0.34 249 1.75 Other components
d-Glucose (dextrose) 1000 5.56 4500 25.00
Phenol red 15 0.0399
4. Precipitation of calcium phosphate (Ca5OH(PO4)3,
hydroxyapatite):
2 2
4 2 5 4 3
5Ca+(aq)+3HPO −(aq)+H O Ca OH(PO )→ (s)+4H a+( ).q (5) Some other reactions taking place in aqueous solutions deserve to be mentioned.
Dissociation of water (pK° (37 °C) = 13.61):
2
H O(l) H aq OH→ +( )+ −(aq) (6) Dissociation of hydrogen carbonate ions (pK° (37 °C) = 10.24):
3 2 3
(aq) ( ) (
HCO− →CO a− q H aq+ + ) (7) Dissociation of hydrogen phosphate ions (pK° (37 °C) = 12.32):
2 3 4 4
HPO −(aq)→PO −(aq)+H+(aq) (8) Table 2 presents the equilibrium dissolution constants at 37 °C for the precipitates considered in the present study (pK = –log10K). Tables 1 and 3 summarizes the compositions and main physico-chemical
Table 2: Dissolution constants of selected precipitates.
Precipitate Dissolution reaction pK (37 °C) Brucite Mg(OH)2→Mg2++2OH– 11.25
Magnesite MgCO3→Mg2++CO32– 5.51
Nesquehonite Mg(HCO3)OH·2H2O→Mg2++CO32–+3H2O 4.49
Bobierrite Mg3(PO4)2·8H2O→3Mg2++2PO43–+8H2O 27.62
Portlandite Ca(OH)2→Ca2++2OH– 5.38
Calcite CaCO3→Ca2++CO32– 8.44
Hydroxyapatite Ca5(PO4)3(OH)→5Ca2++3PO43–+OH– 58.77
Table 3: Physico-chemical characteristics of incubating solutions.
Component HBSS SBF DMEM Initial S°(X) pH 6.69 7.61 7.70 Brucite –5.00 –4.41 –1.38 Nesquehonite –7.00 –6.11 –1.57 Calcite –5.05 0.47 0.55 Hydroxyapatite –4.40 1.29 1.21 Bobierrite –5.81 –5.27 –0.02 Saturated in brucite S°(X) pH 8.63 8.64 8.64 Nesquehonite 0.50 0.50 0.50 Calcite –3.47 1.17 1.16 Hydroxyapatite –4.25 0.99 0.92 Bobierrite 1.27 1.38 1.29 Saturated in nesquehonite S°(X) pH 8.28 8.31 8.31 Brucite –0.34 –0.34 –0.34 Calcite –3.64 1.01 1.01 Hydroxyapatite –4.07 1.18 1.11 Bobierrite 1.11 1.21 1.13
DMEM also contains 2.5×10⁻⁴ mM Fe(NO
3), not considered in the
thermodynamic calculations.
parameters of the incubating solutions considered in the present study. The saturation index S°(X) is given by:
( ) ( ) logK( )X
S X° = ΠX (9)
where Π(X) is the ionic product of the ions released upon dissolution of precipitate X, and K(X) the equilibrium constant of the dissolution reaction; for instance, in the case of brucite:
2 2
2 2 Sat Sat
(Mg )(OH )
(Brucite) log ; K(Brucite) (Mg ) (OH )
K(Brucite) .
S° = + − = + − (10)
A positive S°(X) means that the solution is supersaturated in X, so that the precipitation of X is thermodynamically possible. How-ever, the actual formation of a precipitate X depends on the kinetics of nucleation and growth of X crystals: if the kinetic process is inhib-ited for some reason (e.g. large free energy of nucleation), the solu-tion can remain in a metastable state without precipitate formasolu-tion.
Statistics
Data are displayed as mean±standard deviation (SD). Statistical anal-ysis was performed by using the SigmaStat Software (Systat GmbH, Erkrath, Germany; version 11.0). Comparison of degradation rates was analyzed by applying the one-way analysis of variance (ANOVA) with Holm-Sidak post-hoc test. The significance level was p < 0.05.
Editing of figures
All figures were finished with PowerPoint (Microsoft Office 2007 and 2010). Raw figure material was created and edited, respectively, using: SigmaPlot (Version 11, Systat Software Inc.) for Figures 5 and 6; Origin (OriginLab) for Figures 7–9; PowerPoint (Microsoft Office 2007 and 2010) for Figure 10.
Results
Morphological analysis
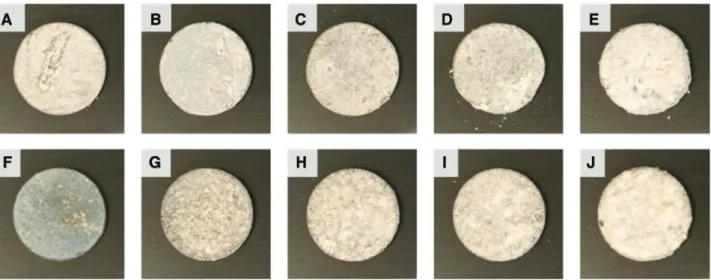
All samples showed obvious signs of degradation on the surface. Exemplary photographs of samples are given in Figures 1–3. Figure 1 shows the surfaces of samples immersed in HBSS medium and in HBSS supplemented with 10% FBS, Figure 2 shows corresponding photographs for samples from DMEM and the corresponding 10% FBS-supplemented medium, and Figure 3 for the samples from SBF-based media. In general, the amount of white crust and flakes fallen off from the samples, respectively, increased with immersion time; however, the exact time points of the chipping off were not determined. According to the appearances, degradation occurred fastest in HBSS.
Figure 1: Photographs of the samples immersed in (A–E) HBSS and (F–J) HBSS +10% FBS for 1, 2, 3, 4 and 7 days, respectively, from left to right.
Figure 2: Photographs of the samples immersed in (A–E) DMEM and (F–J) DMEM +10% FBS for 1, 2, 3, 4 and 7 days, respectively, from left to right.
When FBS was supplemented to HBSS and DMEM, deg-radation seemed to be reduced. In contrast, degdeg-radation did apparently not decrease when FBS was supplemented to SBF.
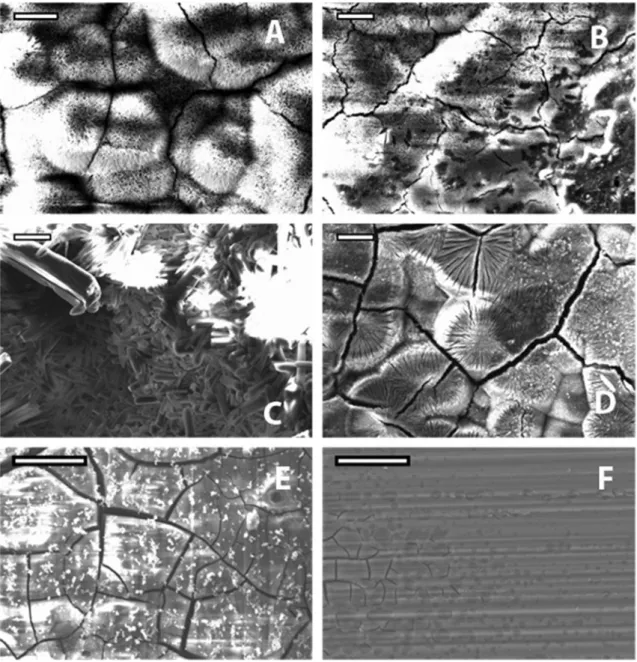
In general, according to the SEM images, two types of crystals with different morphologies predominate within the layer of degradation products (Figure 4). Firstly, intergrown needles, and secondly, crystals with a flake-like shape. However, SEM images from samples which were immersed in different media showed differences between the surface morphologies. Samples immersed in HBSS exhibited mostly flake-like crystals, whereas on
DMEM-immersed samples mainly interconnected needles were visible. In all cases, the appearance of the degrada-tion layer changed with the addidegrada-tion of proteins.
Degradation rate, pH and osmolality
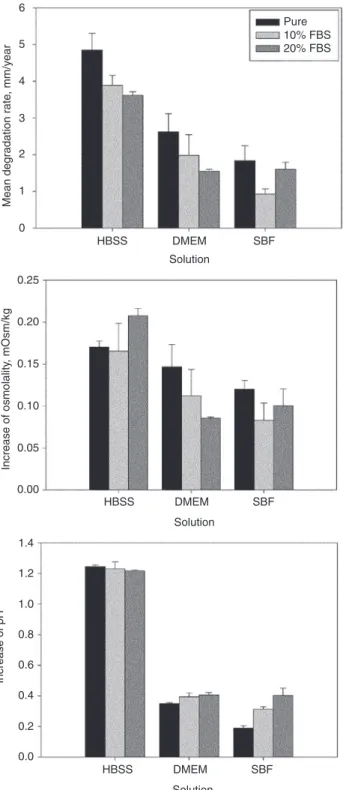
The degradation rate was highest in HBSS and lowest in SBF. According to the statistical analysis, the HBSS treatment led to significantly higher degradation rates (compared to all other treatments, Figure 5). The actual degradation rates are compared in Figure 6, Top. Using
Figure 4: SEM images of samples immersed for 72 h in the respective media.
Left column: without FBS supplementation; right column: with FBS supplementation. HBSS (A+B); DMEM (C+D); SBF (E+F). Scale bars repre-sent 25 μm.
HBSS HBSS 10 HBSS 20 DMEM DMEM 10 DMEM 20 SBF SBF 10 SBF 20 HBSS
HBSS 10HBSS 20DMEMDMEM 10DMEM 20
SBFSBF 10
SBF 20 Figure 5: Multiple comparison graph of significant differences between the degradation rates in the different solutions (ANOVA, p < 0.05).
Numbers behind the media designations (HBSS, DMEM, SBF) repre-sent the amount of added FBS (10% or 20%, respectively).
6 Pure 10% FBS 20% FBS 5 4 3
Mean degradation rate
, mm/y ear 2 1 0 HBSS DMEM SBF Solution 0.25 0.20 0.15 0.10 Increase of osmolality , mOsm/kg 0.05 0.00 1.4 1.2 1.0 0.8 Increase of pH 0.6 0.4 0.2 0.0 HBSS DMEM SBF Solution HBSS DMEM SBF Solution
Figure 6: Mean degradation rate, increase of osmolality and increase of pH in the different media after immersion of magnesium discs for 72 h.
HBSS the addition of proteins exhibited a significant decrease of the degradation rate due to the addition of proteins. This effect was weaker for DMEM, where only the addition of 20% FBS led to a significant decrease. Presum-ably, due to the low amount of samples, other differences between the degradation rates in DMEM and SBF were not statistically significant. The addition of proteins generally resulted in a decrease of the degradation rate, except for SBF, where the higher amount of protein increased the degradation rate again. The measurement of osmolality reproduces this behavior in the case of DMEM and SBF, but shows a different trend for HBSS (Figure 6 middle). The increase in pH (Figure 6 bottom) appears to show a loose correlation to the degradation rate, when the pH increases as well as the degradation rates in HBSS-based media are both higher. DMEM- and SBF-based media have a higher buffering capacity than HBSS, correspondingly a weaker pH increase is observed; degradation rates are generally smaller as those in HBSS-based media, as well.
Phase identification via XRD
X-ray diffraction (XRD) investigations allow the qualita-tive identification (speciation) of different crystalline deg-radation products. Beforehand, it has to be pointed out that a quantitative evaluation of the species by XRD is not the aim in the present study. Even if this is in principle possible using elaborated standardization and calibration experiments, it does not make sense regarding the way
the samples were produced. Crumbles of different sizes fell off from most samples at undetermined time points. Possible texture effects, which are likely to occur with surface-crystallized or deposited material, would further complicate a quantitative evaluation. Also, reflections
that can be qualitatively assigned to brucite (Mg(OH)2) or to the substrate magnesium could in some cases hardly be distinguished from background noise.
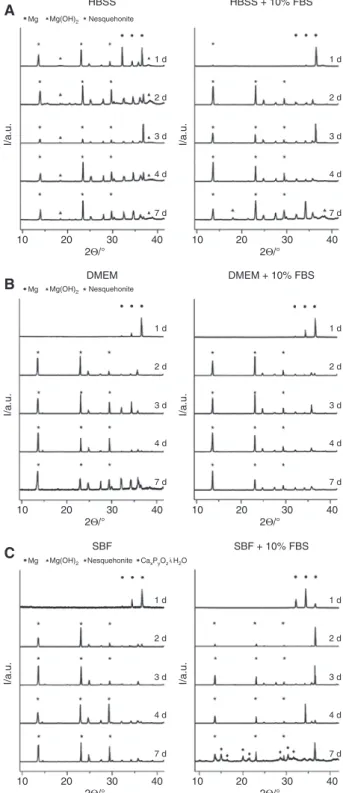
Exemplary XRD patterns of samples immersed in HBSS or in HBSS supplemented with 10% FBS are shown in Figure 7A; Figure 7B and C show diffractograms for samples immersed in corresponding DMEM- and SBF-based media, respectively.
Reflections associated with metallic magnesium (2Θ = 32.2°, 34.4° and 36.6°) were present in all diffracto-grams, allowing the conclusion that the penetration depth of the X-ray beam was sufficient to examine the crusts in their entire thickness. However, the relative intensities were remarkably low in the DMEM series. For clarity, in the figures the reflections ascribed to magnesium are marked only in the patterns obtained from samples with an immersion time of 1 day. Reflections ascribed to degra-dation products are marked, if appropriate, in all respec-tive patterns. Brucite, Mg(OH)2, a degradation product observed in many degradation processes of magnesium and magnesium alloys, was in our study only found as one of the products on samples from HBSS-based media (corresponding reflections at 2Θ = 18.5° and 38.0°). Nesquehonite, a magnesium hydroxycarbonate hydroxide hydrate of formula Mg(HCO3)(OH)·2H2O (with character-istic reflections at 2Θ = 13.6°, 23.0°, 29.5° and 34.2°), was the dominant degradation product in our study. It was observed in all diffractograms from samples from HBSS-based media, and in all diffractograms of specimens that had been exposed to SBF- and DMEM-based media for longer than 1 day. Calcium phosphates were found on a sample immersed in SBF supplemented with 10% FBS for 7 days (Figure 7C). The reflections can be assigned to Ca2P4O12·4H2O and Ca2P2O7·2H2O. However, some reflec-tions, e.g. at 2Θ = 10.2° and 11.6°, remained unassigned.
Discussion
Influence of the medium and proteins
on the degradation rates and osmolality
HBSS has been evaluated to be the simplest medium, followed by SBF, while DMEM also includes organic sub-stances [17]. Degradation rates decreased in the order of HBSS – DMEM – SBF. As proteins are known to retard mag-nesium degradation under certain conditions [16], a reduc-tion of the decomposireduc-tion rate was expected for DMEM. The expectation was confirmed for samples immersed in HBSS and DMEM, but not for samples immersed in SBF.
10
1 d
Mg Mg(OH)2 Nesquehonite
Mg Mg(OH)2 Nesquehonite
Mg Mg(OH)2 Nesquehonite CaxPyOz·i H2O
2 d 3 d 4 d 7 d 1 d 2 d 3 d 4 d 7 d 1 d 2 d 3 d 4 d 7 d 1 d 2 d 3 d 4 d 7 d 1 d 2 d 3 d 4 d 7 d 1 d 2 d 3 d 4 d 7 d I/a.u. HBSS HBSS + 10% FBS DMEM DMEM + 10% FBS SBF SBF + 10% FBS I/a.u. I/a.u. I/a.u. I/a.u. I/a.u. 20 A B C 30 40 2Θ/° 10 20 2Θ/°30 40 10 20 30 40 2Θ/° 10 20 2Θ/°30 40 10 20 30 40 2Θ/° 10 20 2Θ/°30 40
Figure 7: XRD patterns obtained from samples immersed without proteins (left) and with proteins (right) in the respective solutions. From top to bottom: 1, 2, 3, 4 and 7 days of immersion. Reflection positions for Mg are indicated in the top patterns, those for Mg(OH)2 and nesquehonite in each pattern (if they are present).
As stated above, osmolality examinations reproduced this behavior for DMEM and SBF, but not for HBSS. Presuma-bly due to the high degradation rates in HBSS, which were
the highest in this study, and due to the high salt content of the solutions, a simple correlation could not be found.
Degradation products
Two magnesium compounds were found to be the domi-nant degradation products in this study: Mg(OH)2 and nesquehonite (Mg(HCO3)(OH)·2H2O). The latter was found on samples from all media, while Mg(OH)2 was found exclusively for specimens which had been exposed to HBSS. Measurements revealed the highest pH when HBSS was used as the medium, hence, the presence of Mg(OH)2 in the crusts is plausible. Unfortunately, as described above, the XRD investigations in this study were not suited to be used for quantification. The detection of nesquehonite is in line with the observation of needle-like crystals in SEM images, as this is a typical morphology for this magnesium compound.
In various previous studies, Mg(OH)2 has been described as the only crystalline degradation product. However, these studies did not include CO2 gassing as part of their setup [12]. Therefore, we ascribe the forma-tion of nesquehonite to the introducforma-tion of CO2 in our experiments, as carbon dioxide will serve as an additional source of hydrogen carbonate and carbonate ions. In this context, it is of interest that the formation of magnesium carbonates is of relevance for CO2 storage using mineral carbonation [21]. The family of magnesium carbonates consists of a variety of compounds, and in other studies with slightly changed parameters in the immersion experiment setups, other members of this family might be formed. Nesquehonite, can be directly synthesized by the addition of a NaCO3 solution to a MgCl2 solution at room temperature [22]. At slightly elevated temperatures, the NaCO3-MgCl2 system leads to the formation of hydro-magnesite (Mg5(CO3)4(OH)2·4H2O) [23]. Furthermore, the transformation of nesquehonite to hydromagnesite was reported in the context of dypingite (Mg5(CO3)4(OH)2·5H2O) [24, 25], which was also found as a byproduct in the syn-thesis of magnesite (MgCO3) [26]. Hydromagnesite and magnesite, respectively, were occasionally found to be associated with dolomite (South Australia) [27]. It should be noted that some formulae only differ in one equivalent of crystal water, a difference that in some cases semi-quantitative methods are probably not able to detect reli-ably, and the formulae of dypingite and giorgiosite are the same (Mg5(CO3)4(OH)2·5H2O).
The formation of calcium phosphates on samples from the SBF immersion can be traced back to the composition of this medium, which corresponds to a
supersaturated calcium phosphate system. Reflections of crystalline magnesium phosphates were not detected in this study. However, by the characterization methods applied, it cannot be excluded that certain amounts of Ca2+ were replaced with Mg2+. The formation of the calcium
phosphates could also be responsible for the small deg-radation rate of Mg in SBF, as calcium phosphates are a well-known means to stabilize magnesium against too fast degradation [28].
Probability of degradation products
determined by thermodynamical solubility
calculations
HBSS
This solution (HBSS), besides NaCl, also contains KCl, NaHCO3, KH2PO4 and Na2HPO4: the latter two components are included as pH buffering additives. The presence of phosphate ions makes possible the precipitation of bobierrite. During the increase in Mg concentration result-ing from the corrosion process, the pH increases from 6.69 up to 8.63, where the solution is saturated in brucite; at this point, the solution is supersaturated in nesque-honite (S°(MC-n) = 0.50) and in bobierrite (S°(TMPO) = 1.27) (Figure 8). At saturation in nesquehonite, a lower pH of 8.28 is reached, the solution being then undersaturated in brucite (S°(MH) = –0.34), but still supersaturated in bobier-rite (S°(TMPO) = 1.11) (Figure 9). Although magnesite is less soluble than nesquehonite (Table 2), it is not observed experimentally. This suggests that, in the present reaction conditions, the nucleation and growth of nesquehonite is favored over that of magnesite. Likewise, the absence of experimentally observed bobierrite suggests that its spon-taneous nucleation is inhibited in the present experimen-tal conditions.
SBF
The solution, besides NaCl, also contains CaCl2, NaHCO3 and Na2HPO4; pH buffering is obtained by the presence of carbonates under p(CO2) = 5%. The simultaneous presence of Ca2+ and HPO
42– in the solution makes possible the
pre-cipitation of calcite, hydroxyapatite and bobierrite, which show positive initial values of S°(X) (Table 3). However, long lasting experience has shown that SBF solutions are metastable and can be kept for several weeks without any noticeable precipitation, probably due to the absence of spontaneous nucleation in the bulk of the solution.
Only artificial nucleation, for instance in the presence of “bioactive” surfaces can trigger the formation of calcite or hydroxyapatite [18]. The absence of bobierrite found in the present study also suggests that the nucleation of
this precipitate is inhibited just like that of hydroxyapa-tite. During the increase in Mg concentration resulting from the corrosion process, the pH increases from 7.61 up to 8.64, where the solution is saturated in brucite; at
1.5
No precipitation
Evolution upon magnesium dissolution
No precipitation
Evolution upon magnesium dissolution
No precipitation
Evolution upon magnesium dissolution
HBSS: T=37.0 [°C]: p(CO2)=0.05 [atm]
MH MC(n) TMPO pH
SBF-FF01: T=37.0 [°C]: p(CO2)=0.05 [atm]
MH MC(n) TMPO HA CC(c) pH
DMEM: T=37.0 [°C]: p(CO2)=0.05 [atm]
MH MC(n) TMPO HA CC(c) pH 8.7 8.6 8.5 8.4 8.3 8.2 8.1 8 7.9 7.8 7.7 0 0.1 0.2 0.3 0.4 {Mg} [M] HBSS SBF DMEM 0.5 0.6 8.7 8.6 8.5 8.4 8.3 8.2 8.1 8 7.9 7.8 7.7 0 0.1 0.2 0.3 0.4 {Mg} [M] 0.5 0.6 8 8.7 8.8 8.6 8.5 8.4 8.3 8.2 8.1 8 0 7.9 7.8 0.1 0.2 0.3 0.4 {Mg} [M] 0.5 0.6 1.3 1.0 0.8 0.5 0.3 S °( X ) S °( X ) S °( X ) pH pH pH 0.0 –0.3 –0.5 –0.8 –1.0 1.5 1.3 1.0 0.8 0.5 0.3 0.0 –0.3 –0.5 –0.8 –1.0 1.5 1.3 1.0 0.8 0.5 0.3 0.0 –0.3 –0.5 –0.8 –1.0
Figure 8: Calculation of the saturation index of various compounds without assuming precipitation.
Evolution vs. dissolved Mg of pH and of the standard supersaturations S°(X) of selected precipitates: MH = brucite-Mg(OH)2;
MC(n) = nesque-honite-MgCO3·3H2O; TMPO = bobierrite-Mg3(PO4)2·8H2O; HA = hydroxylapatite-Ca5OH(PO4)3 CC(c) = calcite-CaCO3. Increase in Mg concentration
up to brucite saturation.
1.5
precipitation of nesquehonite
Evolution after saturation vs. brucite
precipitation of nesquehonite
Evolution after saturation vs. brucite
HBSS: T=37.0 [°C]: p(CO2)=0.05 [atm]
MH MC(n) TMPO pH
SBF-FF01: T=37.0 [°C]: p(CO2)=0.05 [atm]
MH MC(n) TMPO HA CC(c) pH
precipitation of nesquehonite
Evolution after saturation vs. brucite
DMEM: T=37.0 [°C]: p(CO2)=0.05 [atm]
MH MC(n) TMPO HA CC(c) pH 8.7 8.65 8.6 8.55 8.5 8.45 8.4 8.35 8.3 8.2 8.25 8.7 8.65 8.6 8.55 8.5 8.45 8.4 8.35 8.3 8.2 8.25 8.7 8.65 8.6 8.55 8.5 8.45 8.4 8.35 8.3 8.2 8.25 0 0.1 0.2 0.3 0.4 {Mg} [M] HBSS 0.5 0.6 0 0.1 0.2 0.3 0.4 {Mg} [M] SBF 0.5 0.6 0 0.1 0.2 0.3 0.4 {Mg} [M] DMEM 0.5 0.6 8 1.3 1.1 0.9 0.7 0.5 S °( X ) S °( X ) pH pH S°(X ) pH 0.3 0.1 –0.1 –0.3 –0.5 1.5 1.3 1.1 0.9 0.7 0.5 0.3 0.1 –0.1 –0.3 –0.5 1.5 1.3 1.1 0.9 0.7 0.5 0.3 0.1 –0.1 –0.3 –0.5
Figure 9: Calculation of the saturation index of various compounds related to nesquehonite precipitation.
Evolution vs. dissolved Mg of pH and of the standard supersaturations S°(X) of selected precipitates: MH = brucite-Mg(OH)2;
MC(n) = nesque-honite-MgCO3·3H2O; TMPO = bobierrite-Mg3(PO4)2·8H2O; HA = hydroxylapatite-Ca5OH(PO4)3 CC(c) = calcite-CaCO3. Decrease in Mg concentration from brucite saturated solutions down to nesquehonite equilibrium.
this point, the solution is supersaturated in nesquehonite (S°(MC-n) = 0.50), in calcite (S°(CC) = 1.17), in hydroxyapa-tite (S°(HA) = 0.99) and in bobierrite (S°(TMPO) = 1.38) (Figure 8). At saturation in nesquehonite, a lower pH of 8.31 is reached, the solution being then undersaturated in brucite (S°(MH) = –0.34), but still supersaturated in calcite (S°(CC) = 1.01), hydroxyapatite (S°(HA) = 1.18) and bobierrite (S°(TMPO) = 1.21) (Figure 9). Also in this case the formation of nesquehonite seems to be favored over magnesite. The observation, that calcium phosphates were only observed after 7 days’ immersion and in presence of 10% FBS shows that the presence of proteins may be one of the important factors under these experimental conditions.
DMEM
Medium has an inorganic composition close to that of SBF (Table 1) but also contains many organics (e.g. glucose, amino-acids). The present thermodynamic calculations only simulate the behavior of DMEM solutions free of any organic additives. As for SBF the precipitation of calcite, hydroxyapatite and bobierrite is thermodynamically possible, since they show positive initial values of S°(X) (Table 3). As for SBF solutions, DMEM media seem to be metastable and can be stored for several weeks without any noticeable precipitation. During the increase in Mg concentration resulting from the corrosion process, the pH increases from 7.70 up to 8.64, where the solution is saturated in brucite; at this point, the solution is super-saturated in nesquehonite (S°(MC-n) = 0.50), in calcite (S°(CC) = 1.16), hydroxyapatite (S°(HA) = 0.92) and bobier-rite (S°(TMPO) = 1.29) (Figure 8). At saturation in nesque-honite, a lower pH of 8.31 is reached, the solution being then undersaturated in brucite (S°(MH) = –0.34), but still supersaturated in calcite (S°(CC) = 1.01), hydroxyapatite (S°(HA) = 1.11) and bobierrite (S°(TMPO) = 1.13) (Figure 9).
Again, the absence of any noticeable precipitate besides nesquehonite and brucite suggests that magnesite, bobier-rite, calcite and hydroxyapatite cannot nucleate in DMEM, in the experimental conditions of the present study.
Degradation mechanisms
A possible reaction scheme for the in vitro degradation of magnesium in different media, which is in line with earlier findings [29], is shown in Figure 10. It contains the often observed formation of magnesium hydroxide, but also takes into account the increased solubility of Mg(OH)2 in the presence of chlorides [4]. When additional hydroxycarbonate or carbonate ions are present, as in our case due to the CO2 gassing, magnesium hydroxyl carbon-ate (hydrcarbon-ates) can be formed. It is noteworthy that we find Mg(OH)2 only in the case of degradation in HBSS which has the lowest salt carbonate concentration of the tested media. Possibly, in DMEM and SBF with higher carbonate concentrations, formed Mg(OH)2 is transformed (either directly or via dissolution in the presence of Cl–) to
mag-nesium carbonate species. When the degradation solu-tion contains high amounts of phosphate, as SBF, calcium phosphates may be formed which in turn may decelerate the degradation reaction. Also the presence of proteins, in our investigation modeled by the addition of FBS, will affect the degradation pathways. In addition to surface effects like the adsorption of proteins on magnesium or on degradation layers, proteins could also act directly, as some proteins are known to bind CO2 [30].
Conclusion
This study has shown that the conditions under which the degradation of pure magnesium is investigated strongly
influence the degradation rate and the degradation prod-ucts. We have chosen conditions which are close to cell-culture studies, including CO2 gassing and, in part of the experiments, addition of a widely used serum-supple-ment containing proteins. Degradation occurred fastest in HBSS, while the supplement with proteins led to a decrease of degradation in case of HBSS and DMEM, but not in case of SBF. As expected, brucite Mg(OH)2 could be found as one of the degradation products when HBSS was used. More surprisingly, nesquehonite (Mg(HCO3)(OH)·2H2O), was found to be the dominant, crystalline degradation product, formed within short terms in all media. Since it is likely that the additional carbonate source CO2 promoted the formation of this magnesium hydrogen carbonate, we propose that CO2 pressure ought to be taken into account in further in vitro studies. Also, the CO2 pressure of the intended in vivo environment should be considered.
Author’s statement
Conflict of interest: Authors state no conflict of interest. Materials and methods
Informed consent: Informed consent has been obtained
from all individuals included in this study.
Ethical approval: The research related to human use has
been complied with all the relevant national regulations, institutional policies and in accordance the tenets of the Hel-sinki Declaration, and has been approved by the authors’ institutional review board or equivalent committee.
References
1. Witte F. The history of biodegradable magnesium implants: a review. Acta Biomater. 2010;6:1680–92.
2. Erne P, Schier M, Resink TJ. The road to bioabsorbable stents: reaching clinical reality? Cardiovasc Intervent Radiol. 2006;29:11–6.
3. Waksman R, Erbel R, Di Mario C, Bartunek J, de Bruyne B, Eberli FR, et al. Early- and long-term intravascular ultrasound and angiographic findings after bioabsorbable magnesium stent implantation in human coronary arteries. J Am Coll Cardiol Intv. 2009;2:312–20.
4. Witte F, Hort N, Vogt C, Cohen S, Willumeit R, Kainer KU, et al. Degradable biomaterials based on magnesium corrosion. Curr Opin Solid State Mater Sci. 2008;12:63–72.
5. Witte F, Kaese V, Haferkamp H, Switzer E, Meyer-Lindenberg A, Wirth CJ, et al. In vivo corrosion of four magnesium
alloys and the associated bone response. Biomaterials. 2005;26:3557–63.
6. Janning C, Willbold E, Vogt C, Nellesen J, Meyer-Lindenberg A, Windhagen H, et al. Magnesium hydroxide temporarily enhancing osteoblast activity and decreasing the osteoclast number in peri-implant bone remodelling. Acta Biomater. 2010;6:1861–8.
7. Xu L, Yu G, Zhang E, Pan F, Yang K. In vivo corrosion behavior of Mg-Mn-Zn alloy for bone implant application. J Biomed Mater Res. A 2007;83:703–11.
8. Burmester A, Luthringer B, Willumeit R, Feyerabend F. Comparison of the reaction of bone-derived cells to enhanced MgCl2-salt concentrations. Biomatter. 2014;4:e967616. 9. Mueller W-D, Lucia Nascimento M, Lorenzo de Mele MF. Critical
discussion of the results from different corrosion studies of Mg and Mg alloys for biomaterial applications. Acta Biomater. 2010;6:1749–55.
10. Feyerabend F, Drücker H, Laipple D, Vogt C, Stekker M, Hort N, et al. Ion release from magnesium materials in physiological solutions under different oxygen tensions. J Mater Sci Mater Med. 2012;23:9–24.
11. Yang L, Hort N, Willumeit R, Feyerabend F. Effects of corrosion environment and proteins on magnesium corrosion. Corros Eng Sci Techn. 2012;47:335–9.
12. Waizy H, Weizbauer A, Modrejewski C, Witte F, Windhagen H, Lucas A, et al. In vitro corrosion of ZEK100 plates in Hank’s Balanced Salt Solution. Biomed Eng. Online 2012;11:12. 13. Fournier V, Marcus P, Olefjord I. Oxidation of magnesium. Surf
Interface Anal. 2002;34:494–7.
14. Wang Y, Wei M, Gao J, Hu J, Zhang Y. Corrosion process of pure magnesium in simulated body fluid. Mater Lett. 2008;62:2181–4. 15. Rettig R, Virtanen S. Composition of corrosion layers on a
magnesium rare-earth alloy in simulated body fluids. J Biomed Mater Res A. 2009;88A:359–69.
16. Yamamoto A, Hiromoto S. Effect of inorganic salts, amino acids and proteins on the degradation of pure magnesium in vitro. Mater Sci Eng. 2009;29:1559–68.
17. Tie D, Feyerabend F, Hort N, Willumeit R, Hoeche D. XPS studies of magnesium surfaces after exposure to Dulbecco’s modified eagle medium, Hank’s buffered salt solution, and simulated body fluid. Adv Eng Mater. 2010;12:B699–704.
18. Bohner M, Lemaitre J. Can bioactivity be tested in vitro with SBF solution? Biomaterials 2009;30:2175–9.
19. ASTM. G31 – 72(2004) Standard Practice for Laboratory Immersion Corrosion Testing of Metals. West Conshohocken, PA: ASTM International, 2004:8.
20. Abele JE. The physical background to freezing point osmometry and its medical-biological applications. Am J Med Electron. 1963;2:32–41.
21. Prigiobbe V, Mazzotti M. Precipitation of Mg-carbonates at elevated temperature and partial pressure of CO2. Chem Eng J. 2013;223:755–63.
22. Kloprogge JT, Martens WN, Nothdurft L, Duong LV, Webb GE. Low temperature synthesis and characterization of nesquehonite. J Mater Sci Lett. 2003;22:825–9.
23. Cheng W, Li Z. Controlled supersaturation precipitation of hydro-magnesite for the MgCl2-Na2CO3 system at elevated tempera-tures: chemical modeling and experiment. Ind Eng Chem Res. 2010;49:1964–74.
24. Davies PJ, Bubela B. The transformation of nesquehonite into hydromagnesite. Chem Geol. 1973;12:289–300.
25. Canterford JH, Tsambourakis G, Lambert B. Some observations on the properties of dypingite, Mg5(CO3)4(OH)2.5H2O, and related minerals. Mineral Mag. 1984;48:437–42.
26. dos Anjos AP, Sifeddine A, Sanders CJ, Patchineelam SR. Synthesis of magnesite at low temperature. Carbonate Evap. 2011;26:213–5.
27. Warren JK. Sedimentology and mineralogy of dolomitic Coorong lakes, South Australia. J Sediment Res. 1990; 60:843–58.
28. Shadanbaz S, Dias GJ. Calcium phosphate coatings on magnesium alloys for biomedical applications: a review. Acta Biomater. 2012;8:20–30.
29. Willumeit R, Fischer J, Feyerabend F, Hort N, Bismayer U, Heidrich S, et al. Chemical surface alteration of biodegradable magnesium exposed to corrosion media. Acta Biomater. 2011;7:2704–15. 30. Cundari TR, Wilson AK, Drummond ML, Gonzalez HE,
Jorgensen KR, Payne S, et al. CO2-Formatics: how do proteins bind carbon dioxide? J Chem Inf Model. 2009;49:2111–5.