HAL Id: halshs-01134483
https://halshs.archives-ouvertes.fr/halshs-01134483
Preprint submitted on 23 Mar 2015
HAL is a multi-disciplinary open access
archive for the deposit and dissemination of sci-entific research documents, whether they are pub-lished or not. The documents may come from teaching and research institutions in France or abroad, or from public or private research centers.
L’archive ouverte pluridisciplinaire HAL, est destinée au dépôt et à la diffusion de documents scientifiques de niveau recherche, publiés ou non, émanant des établissements d’enseignement et de recherche français ou étrangers, des laboratoires publics ou privés.
SWB as a Measure of Individual Well-Being
Andrew E. Clark
To cite this version:
WORKING PAPER N° 2015 – 11
SWB as a Measure of Individual Well-Being
Andrew E. CLARK
JEL Codes: D60, I31
Keywords: Subjective well-being, Life satisfaction, Affect, Eudaimonia, Predicting behaviour, Measurement
P
ARIS-
JOURDANS
CIENCESE
CONOMIQUES48, BD JOURDAN – E.N.S. – 75014 PARIS TÉL. : 33(0) 1 43 13 63 00 – FAX : 33 (0) 1 43 13 63 10
www.pse.ens.fr
CENTRE NATIONAL DE LA RECHERCHE SCIENTIFIQUE – ECOLE DES HAUTES ETUDES EN SCIENCES SOCIALES
SWB as a Measure of Individual Well-Being
Andrew E. Clark1 (Paris School of Economics - CNRS)
Chapter 16 of the Oxford Handbook of Well-Being and Public Policy
March 2015
Second Revised Version
Abstract
There is much discussion about using subjective well-being measures as inputs into a social welfare function, which will tell us how well societies are doing. But we have (many) more than one measure of subjective well-being. I here consider examples of the three of the main types (life satisfaction, affect, and eudaimonia) in three European surveys. These are quite strongly correlated with each other, and are correlated with explanatory variables in pretty much the same manner. I provide an overview of a recent literature which has compared how well different subjective well-being measures predict future behaviour, and address the issue of the temporality of well-being measures, and whether they should be analysed ordinally or cardinally.
Keywords: Subjective well-being, Life satisfaction, Affect, Eudaimonia, Predicting behaviour,
Measurement.
JEL Codes: D60, I31.
1 PSE, 48 Boulevard Jourdan, 75014 Paris, France; [email protected]. I am grateful to David Bayliss, Bob
Cummins, Ed Diener, Dick Easterlin, Justina Fischer, Carol Graham, Ori Heffetz, John Helliwell, Arie Kapteyn, Bert Van Landeghem, Richard Layard, Ewen McKinnon, Andrew Oswald, Tess Peasgood, Bernard van Praag and Alois Stutzer for help and advice. Matt Adler, Angus Deaton, Marc Fleurbaey and Danny Kahneman went well beyond the call of duty with detailed guidance. Thanks to seminar participants at ESRI (Tokyo), the 2012 ISFOL Conference on Recognizing the Multiple Dimensions of Poverty (Rome), and the OECD-NAS workshop (Paris) for thoughtful comments. I am especially grateful to participants at the Handbook Conference in Princeton for hearing me out and making constructive remarks. The Norwegian Social Science Data Services (NSD) is the data archive and distributor of the ESS data. Data from the British Household Panel Survey (BHPS) were supplied by the ESRC Data Archive. Neither the original collectors of the data nor the Archive bear any responsibility for the analysis or interpretations presented here.
1.
Introduction
The increase in interest in measures of subjective well-being over recent years in the social sciences has been remarkable. This interest has addressed a variety of different questions.
Perhaps most self-evidently, these measures have been used to describe who is doing well in their life (both at the individual level and, by a process of aggregation, at the city, region or country level as well). They have also been used to explore individual motivations for behaviour, under the working assumption that individuals behave as if they want to maximise their well-being: Why do people do what they do?
Last, they have been used to provide novel information that helps us to understand a number of economic magnitudes and puzzles, such as:
Why aren’t we all self-employed, if self-employment leads to higher levels of well-being than employment? (Blanchflower and Oswald, 1998).
Why do wages differ so much across industries and occupations? (Clark, 2003b, and Pischke, 2010).
How much inequality is acceptable in a society? (Clark and D’Ambrosio, 2015).
What is the right trade-off in the misery index between unemployment and inflation? (Di Tella et al., 2001).
How can we value public goods, such as pollution and aircraft noise? (Luechinger, 2009, and Van Praag and Baarsma, 2005).
All of the above has produced a fascinating and very fast-growing literature across most of the social sciences.
Economists like to maximise things, and talk about maximising utility and maximising social welfare. But this is just shorthand for saying that we want to choose policies that do best by some criterion. I believe that everyone would agree with that statement: otherwise we could be doing better using exactly the same resources (or, equivalently, doing as well using fewer resources).
The broad opposition that is brought out in the current handbook is between a social-welfare function, which depends in some way on the utility functions of the individuals in a society, and multidimensional alternatives.
Measures of subjective well-being can be used to reflect the individual utilities that go into the social-welfare function. These arguably have a number of advantages. For one, we do
not have to try to make up lists of the elements of a good life (how could we ever know if our list is complete: Have we really covered everything?). And if we do make such lists, how do we weight the different elements: How much, for example, is education worth in terms of marital status? Are the weights the same for everyone?2 Asking individuals simple questions about their well-being means that we do not have to face these problems: individuals will by definition include everything they find to be important when making their judgements, and will apply their own personal weights to the different domains of their life.
So it could be thought that we have arrived at a panacea. In this chapter I will indeed consider the first of the two ways of considering how well a society is doing, via the use of a social-welfare function. We are however not yet home and dry. One of the thorny issues that remain is what measure should be used for individual utility (where it is the individual utilities that will determine the criterion we use for policy choice).3 The reappearance of proxy measures of utility has brought with it an embarrassment of riches: there are by now many dozens if not hundreds of potential measures of what makes a good life at the individual level.4
There are broadly-speaking three different types of subjective well-being measure. The first is cognitive/evaluative, and asks the individual to make some statement about overall how well their life as a whole is going. Life satisfaction is one obvious candidate here.
The second are much more along the lines of photographs of how I am feeling right this instant. This is what is called “affect” in the psychology literature, which is sometimes referred to as hedonic or affective well-being. It is not uncommon to see arguments that measure of happiness are more similar to affect measures than to cognitive evaluations.5
2 These questions are not unique to the analysis of well-being of course, but appear in a wide variety of research
domains. An interesting recent contribution is Capelle-Blancard and Petit (2014), who weigh the domains of Corporate Social Responsibility by industry according to the sectoral frequency of news items from the media and NGOs referring to the different domains. An inventive recent contribution (Benjamin et al., 2014) uses a hypothetical-choice approach to evaluate the trade-offs between a very large set of potential well-being measures.
3 This is by no means the only thorny issue. If there is heterogeneity in preferences, then satisfaction
comparisons between individuals will not necessarily reflect their preferences, making satisfaction a poor candidate for the individual “U” scores in the social welfare function. In this light, Decancq et al. (2013) propose the use of equivalent income (see also Decanq et al., 2011). This is defined as “the hypothetical income that, if
combined with the best possible value of all non-income dimensions, would place the individual in a situation that she finds equally good as her initial situation” (p.3). Equivalent incomes respect individual preferences. See
Fleurbaey (chapter A, this Handbook).
4
A frightening variety are on show at http://www.deakin.edu.au/research/acqol/instruments/instrument.php. There is a useful discussion of some of these in Fischer (2009).
5
Although this must depend on how the happiness questions are couched. Being asked whether you are happy with your life is perhaps more evaluative, whereas the experience of happiness yesterday is more of an affective
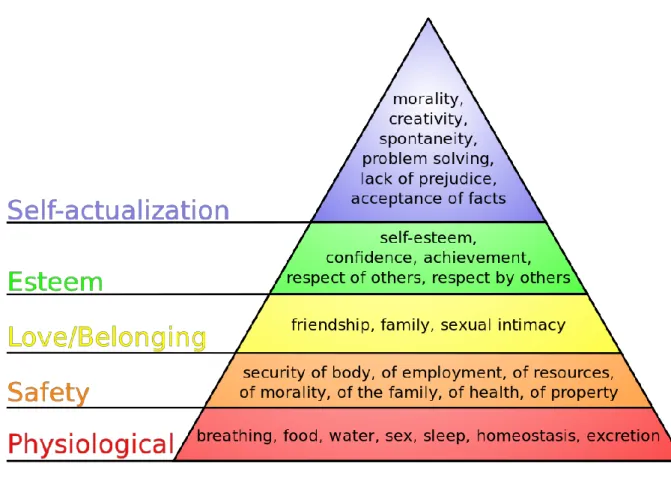
Last, there are non hedonic/life-satisfaction measures, covering meaning, purpose and accomplishment, which are called eudaimonic measures.6 These might be thought of as reflecting Maslow’s hierarchy of needs, as shown in Figure 1 (Maslow, 1943). Here the importance of belonging, self-esteem and self-actualisation is emphasised towards the top of this hierarchy, leading to the development of specific sets of survey questions designed to pick up these eudaimonic domains of individuals’ lives.
Some version of all three of the above question types appear in the four ONS questions; more detailed versions can be found in Wave 3 of the European Social Survey, the ESS (see
http://www.europeansocialsurvey.org/).
We would like to evaluate how well a given society is doing. We do so by measuring the utility of well-being of individuals: the utilities of all the individuals in the society are then inputs into the social-welfare function that tells us how well this society is doing. I here want to add some statistical grist to the mill by asking what we should use to measure individual well-being. The question of whether this should be measured by life satisfaction, net affect, measures of eudaimonia or something else cannot be definitively resolved empirically. There are underlying normative issues as well regarding how we (as a society) should evaluate different situations. These are brought out well in Adler (2013), for example.
This does not however mean that empirical analysis is not worthwhile in this context. I will here try to establish two potentially useful pieces of information. The first is whether, in practice, the different well-being measures are actually sharply different from each other. While we can always imagine situations in which individuals have high levels of life satisfaction or affect, but are deprived in terms of other functionings (see Raibley, 2012, for examples; also Adler, 2013), these may potentially be the infrequent exceptions, rather than the general rule.7 As such, the well-being measures may be quite strongly correlated with each other. If this turns out to be the case, the question of which measure of utility appears in the social welfare function may become less important.8
measure. With respect to the latter, Kapteyn et al. (2013) conclude that happiness yesterday is actually more akin to evaluative measures of well-being.
6 “Eudaimonia refers to the idea of flourishing or developing human potential, as opposed to pleasure, and is
designed to capture elements such as mastery, relations with others, self-acceptance and purpose” (Clark et al.,
2008).
7 Or alternatively some simple questions (such as those on affect perhaps) might be answered using a different
response process to more difficult questions, leading to differences in answers even though both are reflecting the same underlying construct.
8 The implicit assumption here is that if two variables are strongly correlated, then we can to an extent disregard
the difference between them. Angus Deaton notes an obvious counter-example of income and consumption, which are highly correlated, yet the difference between them, savings, is considered as being very important. In
The second piece of information refers to which of the different well-being measures is closest to what really matters to people. It is arguably possible to gauge this by asking people “What matters in your life?”,9
or by inviting them to make hypothetical choices between lives with more positive affect but less meaning, for example. I here take a different tack, and ask which measure of well-being best predicts individual future behaviour and future health. If an individual cares about life satisfaction, but less about eudaimonia, then life satisfaction will better predict their future choices and behaviour than will eudaimonia. For another individual, who cares greatly about eudaimonia, the opposite will hold.
This prediction of future outcomes by current subjective well-being scores produces one useful by-product. One of the central debates in the well-being literature is that on interpersonal comparability (see Fleurbaey and Blanchet, 2013, for example). On a life satisfaction scale of zero to ten (as in the German Socio-Economic Panel, SOEP) I give a reply of seven, while yours is eight. We can only conclude that you are happier than me if we use the response scales in exactly the same way. If we use the scales differently, then we don’t know who is actually doing better. The fact that subjective well-being scores do systematically predict future outcomes shows that they are at least partly interpersonally comparable (although we cannot conclude that they are perfectly so).
The remainder of the chapter is organised as follows. Section 2 will start in a very simple way by considering the correlation between a number of the different proposed measures of subjective well-being. For example: Are individuals who are satisfied with their lives also happy, and do they report higher eudaimonia scores?
Section 3 then considers how the different measures of well-being are correlated with individual characteristics (age, education, sex, employment, income etc.). This is particularly important in the context of public policy. Policy can affect well-being via some of these explanatory variables. And if these variables are similarly correlated with all well-being measures, then our policy choices will be less-dependent on the specific well-being measure retained.
the current context, I am not able to make a statement about the relative importance of the correlated and uncorrelated components of measures of well-being.
9
An intriguing contribution somewhat along these lines is Tafarodi et al. (2006), who ask individuals to list the criteria by which, when they are aged 85, they could determine whether they had lived worthy lives (although the word “worthy” here might be thought to prime respondents). The top four answers were friendships, family, having a positive impact on others, and well-being.
Section 4 is the most “economic”, as it appeals to revealed-preference theory.10
We can infer what matters to individuals by observing their behaviour. Our assumption here is that individuals will act to leave situations with lower levels of well-being in order to go towards situations with higher well-being. As a simple example, individuals quit less satisfying jobs in order to take up positions with higher levels of job satisfaction (Clark, 2001, and Freeman, 1978). 11
The last substantive Section, number 5, turns to a couple of questions that may arise even if we accept that life satisfaction or net affect is a useful candidate to measure the individual levels of “U” in the social welfare function. We first consider the difficult notion of time. What is important for the measurement of well-being: your cognitive evaluation now of your life, or rather the average level of momentary feelings that you enjoyed over each moment of your life? It might be hoped that these two would yield the same answer about how well an individual is doing; however, empirically they may not always match. The well-being that you report now is not the average of the experiences that you have lived through. This raises the rather difficult question of whether a good life is one that was good as you lived it, or rather one that you remember as being good. Second, we ask whether it is reasonable to treat well-being scores, which are ordinal, as if they were cardinal (i.e. linear). In the example we present, this will turn out to make only very little difference.
The analysis presented here only touches on a few of the very many aspects of subjective well-being. Other Handbook chapters that address subjective well-being and its connection to good policy include Dolan and Fujiwara, Graham, Haybron, and Lucas, (chapters B, C, D and E, this Handbook)
2.
Simple correlations between subjective well-being
measures
10 Although Maslow (1943) also refers to the hierarchies as being behind theories of human motivation. 11
It could of course be the case that it is the future outcomes that directly affect current well-being, rather than current well-being predicting future behaviour. Individuals with low income now and higher future income will then be happier than individuals with the same current low income but no expectation of higher future income, even without well-being causing income. Again though, for the first type of individual to report systematically higher well-being scores than the latter, they must be using the scales in something like the same way. Note that this interpretation doesn’t work for job quitting. If you know that you will shortly move to a more attractive job, you would be more satisfied today: the empirical analysis finds rather that low job satisfaction today is correlated with future job quits.
We establish whether two variables move in the same direction by calculating the correlation coefficient between them. In empirical analysis we almost always do this in a regression context, where we see if the dependent variable (say life satisfaction) is correlated with some independent variable (say age or labour-force status). We will here adopt the same strategy, but this time looking at the correlation between series of two subjective well-being measures. The aim is to see whether someone who has high well-being according to one type of measure also has high well-being according to another. We will here present evidence from three European surveys.
Evidence from the ESS
The first dataset we consider is the ESS. This is a multi-country survey which has covered 30 different countries at various points over its first three rounds. Wave 3 of the ESS, collected in 2006/2007, covers 25 different countries and contains a special 50-question module on a variety of different aspects of individual well-being (see Huppert et al., 2009, and Clark and Senik, 2010, for example). We here drop four countries, in which the income variables were not readily usable because they were measured and coded differently, and restrict the sample to those of working age (16-65). This leaves us with an analysis sample of just over 32 000 individuals.
The first two measures that we consider are fairly traditional in surveys asking questions about subjective well-being. The first is a happiness question: respondents are asked “Taking
all things together, how happy would you say you are?”, with answers on a 0 to 10 scale,
where 0 corresponds to “Extremely Unhappy” and 10 to “Extremely Happy”. None of the intermediate responses are labelled. Analogously, life satisfaction is measured via the answer to the question “All things considered, how satisfied are you with your life as a whole
nowadays?”, with answers on a 0 to 10 scale, where 0 means extremely dissatisfied and 10
means extremely satisfied.12 I will refer to questions on happiness, life satisfaction or specific affects as “hedonic/life-satisfaction”.
Where Wave 3 of the ESS is unusual is in its inclusion of a number of well-being questions that do not fall into this “hedonic/life-satisfaction” class. These are grouped together under the label of eudaimonia, referring to the idea of flourishing or developing human potential (see the arguments in Deci and Ryan, 2008, and Diener and Seligman, 2004). In
12 The distribution of these two hedonic variables is very standard (as shown in Table 1 of Clark and Senik,
2011). Both variables are left-skewed. The mean happiness and life satisfaction scores are both 7, and the median scores are 8 and 7 respectively.
practical terms, the eudaimonic well-being to which we refer is measured by survey questions on autonomy, determination, interest and engagement, aspirations and motivation, and a sense of meaning, direction or purpose in life. The argument with which we wish to engage here is that eudaimonia may well be picking up something that is different from standard measures of happiness or life satisfaction.
One difficulty in taking this debate forwards empirically has been identifying datasets that include both hedonic/life-satisfaction and eudaimonic measures of well-being. Wave 3 of the ESS does contain both types of well-being measure, collected from the same individuals. In addition, the survey covers over 20 different countries. This helps to address the worry that what works in one country will not work in another (as the understanding of what is meant by the various questions likely differs across countries).
We will consider a number of different measures of eudaimonic well-being here.13 The first is that of flourishing, as described in Huppert and So (2009). This was originally based on the answers to seven different well-being questions, the first of which was a happiness question. As we here want to rather potentially oppose hedonic/life-satisfaction and eudaimonic measures of well-being, we do not want the same question to appear in both, as this will mechanically lead to correlation. As such, we drop the happiness aspect of flourishing. Our modified version of Huppert and So’s index is defined by the answers to the six different questions below.
Engagement, interest I love learning new things.
Meaning, purpose I generally feel that what I do in my life is valuable and worthwhile.
Self-esteem In general, I feel very positive about myself.
Optimism I’m always optimistic about my future.
Resilience When things go wrong in my life it generally takes me a
long time to get back to normal. (reverse coding) Positive relationships There are people in my life who really care about me.
The first two of these are considered by Huppert and So to be “core features”, in that they are necessary for flourishing. The measure they propose of flourishing is thus agreement
13 This list is of course not definitive. Hone et al. (2014) consider the distribution of and correlation between four
with the first two questions, plus agreement with at least three of the next four questions. According to this definition, fifty six percent of the ESS sample is flourishing.
The second measure we appeal to is that developed by the New Economics Foundation (2008), Appendix 3 of which includes details of the construction of a variety of well-being scores. Amongst these, three are of particular interest in the context of eudaimonic well-being: Vitality; Resilience and Self-Esteem; and Positive Functioning, Supportive Relationships, Trust and Belonging. Each of these three is constructed as the unweighted sum of the answers to a number of z-score transformed questions (such that each of the questions has a mean of zero and a variance of one).
The first index, vitality, comes from the answers to questions on how much of the time during the past week the individual felt tired, felt that everything they did was an effort, could not get going, had restless sleep, had a lot of energy, and felt rested when they woke up in the morning, plus the respondent's general health and whether their life involves a lot of physical activity. All of these are recoded so that higher values reflect greater vitality.
Similarly, the resilience and self-esteem index is given by the sum of the answers to the four following z-score transformed questions: “In general I feel very positive about myself”, “At times I feel as if I am a failure", “I’m always optimistic about my future”, and “When
things go wrong in my life, it generally takes me a long time to get back to normal”. Again, all
of these are recoded so that higher numbers reflect greater resilience.
Last, positive functioning is determined by the answers to the following questions: “In
my daily life I get very little chance to show how capable I am”, “Most days I feel a sense of accomplishment from what I do”, “In my daily life, I seldom have time to do the things I really enjoy”, “I feel I am free to decide how to live my life”, “How much of the time during the past week have you felt bored?”, “How much of the time during the past week have you been absorbed in what you were doing”, “To what extent do you get a chance to learn new things?”,
“To what extent do you feel that you get the recognition you deserve for what you do?”, and “I
generally feel that what I do in my life is valuable and worthwhile”.14
The two hedonic/life-satisfaction measures described above, self-declared Happiness and Life Satisfaction, are both answered in the ESS on 0 to 10 ordinal scales. The flourishing measure from Huppert and So is a binary variable, while the three New Economics Foundation measures are summed z-scores. Even so, we can calculate simple bivariate
14 The Cronbach’s alpha scores for the sets of questions that are used to make up vitality, resilience and positive
functioning are 0.70, 0.61 and 0.65 respectively. Cronbach's alpha is a measure of internal consistency and generally rises as the intercorrelations between the items in a list measuring a latent construct increase.
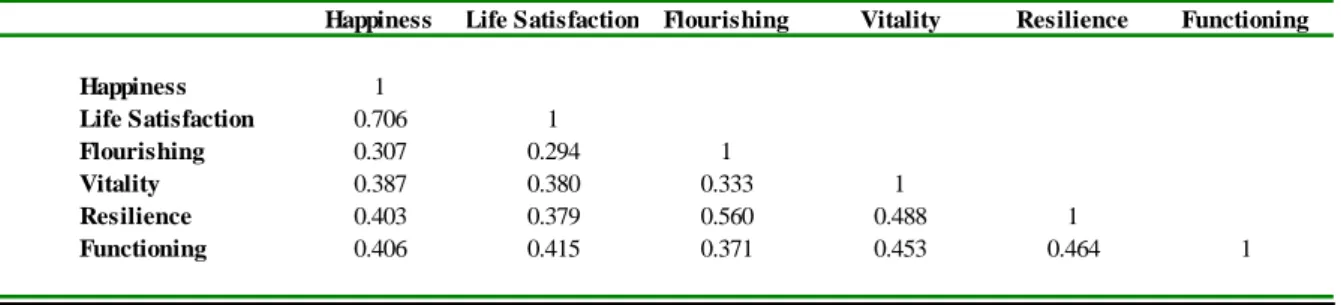
correlation coefficients between these six variables. These are what Table 1 shows. All of the correlation coefficients are significant at better than the 0.01% level. In terms of size, happiness and life satisfaction are correlated at 0.7.15 The correlation coefficients between the hedonic/life-satisfaction and eudaimonic measures (given by the bottom four lines in the first two rows of Table 1) are between 0.3 and 0.4. Last, the correlations between the eudaimonic measures themselves range between 0.33 (flourishing and vitality) and 0.56 (flourishing and resilience).
These subjective well-being measures therefore certainly do co-move, although they are far from being perfectly correlated.
Evidence from the BHPS
We now consider the same type of correlations in one of the best-known and
widely-used panel datasets: the British Household Panel Survey (BHPS:
https://www.iser.essex.ac.uk/bhps/). This is a general panel survey initially covering a random sample of approximately 10 000 individuals in 5 500 British households, with this figure later rising to around 15 000 individuals in 9 000 households. The BHPS includes a wide range of information about individual and household demographics, employment, income and health.
The two main subjective well-being measures in the BHPS are the General Health Questionnaire (GHQ), which appears in all 18 waves of the BHPS (from 1991 to 2008), and overall life satisfaction, which appears in Waves 6-10, and then 12-18. The GHQ-12 (see Goldberg, 1972) reflects overall mental well-being. It is constructed from the responses to twelve questions (administered via a self completion questionnaire) covering feelings of strain, depression, inability to cope, anxiety based insomnia, and lack of confidence, amongst others (see Appendix A). Responses are made on a four-point scale of frequency of a feeling in relation to a person's usual state: “Not at all”, “No more than usual”, “Rather more than
usual”, and “Much more than usual”. The GHQ is widely used in medical, psychological and
sociological research, and is considered to be a robust indicator of the individual’s psychological state. The between-item validity of the GHQ-12 is high in this sample of the BHPS, with a Cronbach’s alpha score of 0.90.
15
The correlation between happiness and life satisfaction in Eurobarometer data from 1975 to 1986 is somewhat lower at 0.56 (Di Tella et al., 2003). This is perhaps due to both life satisfaction and happiness being measured on shorter (but different) scales: 1-4 and 1-3 respectively in this dataset. The same correlation in Wave 3 (1995) of the World Values Survey data is 0.81 (see Inglehart and Klingemann, 2000).
We here use the Caseness GHQ score, which counts the number of questions for which the response is in one of the two “low well-being” categories. This count is then reversed so that higher scores indicate higher levels of well-being, running from 0 (all twelve responses indicating poor psychological health) to 12 (no responses indicating poor psychological health).
The second measure is satisfaction with life, which is similar to that asked in the ESS above. Respondents are asked “How dissatisfied or satisfied are you with your life overall”, with responses measured on a scale of one (not satisfied at all) to seven (completely satisfied). Last, the BHPS has also asked a number of questions that appear more eudaimonic in nature. Waves 11 and 16 of the BHPS (2001 and 2006) include the CASP-19 (Hyde et al., 2003). This is a set of well-being questions originally designed for older adults. In particular, amongst these 19, we find questions regarding energy (I feel full of energy these days), looking forward to each day (verbatim), the measure of control (I can do the things that I want to do), autonomy (I feel that I can please myself what I do), feeling that my life has meaning (verbatim), and doing new things (I choose to do things that I have never done before). In terms of the New Economics Foundation categorisation above, the first of these questions relates to vitality, the second to resilience, and the others to positive functioning.
All of the CASP-19 questions are answered on a four-point scale from 1 to 4, corresponding to “Often”, “Sometimes”, “Not often” and “Never”. So that more positive numbers refer to higher well-being, the six questions above are all reverse-coded. As the eudaimonic questions only appear in BHPS Waves 11 and 16, in the first of which the standard life satisfaction question did not appear, we here retain Wave 16 only for our empirical analysis.
The bivariate correlations between the different well-being measures in this wave of the BHPS appear in Table 2. As in Table 1, all of these correlation coefficients are significant at better than the 0.01% level. Life satisfaction and the Caseness measure of the GHQ are correlated at 0.52, which is still quite a large correlation, although less than the correlation coefficient of 0.7 between life satisfaction and happiness in the ESS data in Table 1. In terms of the relationship between the hedonic/life-satisfaction and eudaimonic measures, GHQ is correlated with the three measures of the latter at about 0.4, while the analogous figures for life satisfaction are slightly higher at about 0.45. The correlations between the eudaimonic measures themselves range between 0.4 and 0.5. At a broad level, the correlations in Table 2
are actually quite similar in nature to those in the ESS data in Table 1.16 The only major difference refers to the correlation between the two hedonic/life-satisfaction measures. Happiness and life satisfaction are correlated at 0.7 in the ESS, whereas life satisfaction and GHQ are correlated at 0.52 in the BHPS. This is perhaps to be expected, given the nature of the GHQ scale, which is more designed to evaluate the level of psychological functioning, as the specific questions in Appendix A suggest.17
Evidence from the ONS
As part of the National Well-Being Programme (see http://www.ons.gov.uk/ons/guide-method/user-guidance/well-being/index.html), the UK Office for National Statistics decided in 2011 to add the following subjective well-being questions to its annual Integrated Household Survey. The four questions are:
Overall, how satisfied are you with your life nowadays?
Overall, how happy did you feel yesterday?
Overall, how anxious did you feel yesterday?
Overall, to what extent do you feel the things you do in your life are worthwhile? In terms of the distinctions that we have made so far, the first life satisfaction is the same as we have already seen in the ESS and the BHPS. The second and third questions are hedonic, picking up positive and negative affect, while the last is eudaimonic.
Table 3 shows the correlations between these four measures (these come directly from Office for National Statistics, 2011). Here the correlation between life satisfaction and positive affect (happiness yesterday) is 0.55, while that with negative affect (anxiety yesterday) is smaller in absolute size at -0.26. With respect to the eudaimonia question (life being worthwhile), the correlation with life satisfaction is high at 0.66, that with positive affect is somewhat lower at 0.51, and that with negative affect is the smallest at -0.22. Again, the correlations between the hedonic/life-satisfaction measures are quite large, as are those
16 We can look at the same correlations for different demographic groups in the ESS and the BHPS. There are no
sharp differences in these correlations by age. However, in both datasets, most measures are more strongly correlated amongst themselves for women than for men. The difference in the correlation coefficients by sex is not huge though, at a maximum of 0.07 in the BHPS and 0.04 in the ESS.
17 I also tried recoding the GHQ as recommended in Goodchild and Duncan-Jones (1985). This increased the
correlation with the life satisfaction score to 0.57. It did not have any systematic effect on the BHPS regression analysis reported in Section 3 below.
between the hedonic/life-satisfaction and eudaimonic measures. The exception here is anxiety yesterday, which exhibits a looser relationship with the other subjective well-being measures.
This simple correlation analysis does not necessarily inform us about the use of subjective well-being for policy purposes. Which variables can policy realistically affect, which might then impact on subjective well-being? And are these impacts similar across the different measures? If they are then any policy that affected life satisfaction will also affect eudaimonia (say), so that in a policy sense it does not matter what measure of well-being we use. This is what we analyse in the next section.
3.
The correlates of subjective well-being
To see whether policy may affect different measures of well-being in the same way, we here turn to multivariate regression analysis, and calculate Pearson correlation coefficients between the vectors of estimated coefficients.18 The broad idea of the comparison of the estimated coefficient on some variable in the statistical analysis of different well-being measures appears in a number of existing contributions.
Kahneman and Deaton (2010) use data on 450 000 Americans in the Gallup-Healthways Well-Being Index. This latter includes measures that describe feelings in one particular day, and an overall evaluation of life. The former refers to the emotions experienced yesterday (including enjoyment, happiness, anger, sadness, stress and worry). The overall evaluative question in the Gallup data comes from Cantril's ladder, where individuals are asked to rate their current life on a ladder scale running from 0, “the worst possible life for you”, to 10, “the
best possible life for you”.
Kahneman and Deaton (2010) show that the variables which are correlated with yesterday’s emotions are not the same as those which are correlated with Cantril’s ladder. They concentrate in particular on the relationship with monthly household income.19 Their
18
This remains a relatively unusual approach in the subjective well-being literature. Clark and Senik (2011) appealed to this method for various well-being scores in the ESS. An earlier contribution is Peasgood (2007), who considers fifteen different subjective well-being measures that appear across waves 9, 11 and 14 of the BHPS. She shows that some variables have a very consistent correlation with all well-being measures (log household income and divorce). However, the correlation of others is far more varied in terms of sign (education and male). She does not calculate the correlations between the whole vectors of estimated coefficients, as we do here. Blanchflower and Oswald (2004) show that the determinants of life satisfaction and happiness are very similar in Eurobarometer data from Great Britain (see their Appendix B). The variables that are correlated with happiness, life satisfaction, self-esteem, mastery and depression are shown to be quite similar in Wave 2 of the Americans’ Changing Lives survey (see Thoits and Hewitt, 2001).
19
It could well be the case that income is itself determined by subjective well-being. An early contribution here is Graham et al. (2004). De Neve and Oswald (2012) use American Add Health data to predict income aged 29
Figure 1 reveals a satiation effect of annual household income with respect to the emotional variables, with income losing its protective role against stress and negative affect, and failing to provide much more positive affect, at an annual level of around 75 000 US dollars (the survey data come from 2008 and 2009); on the contrary, there is little evidence of satiation in the effect of income on the Cantril ladder. In other words, after a certain point higher income leads individuals to rate their life overall as better, although it does not change the levels of daily positive and negative affect they experience.
Stone et al. (2010) also analyse US Gallup data, and compare the age shape of the Cantril ladder and a number of positive and negative affect measures. The ladder and positive affect are found to be U-shaped in age. However, only sadness out of the negative affect measures is found to be correspondingly hump-shaped: both stress and anger fall pretty much continuously from the mid-20s onwards.20
Kapteyn et al. (2013) also compare evaluative and experienced measures of well-being in two waves of the American Life Panel, and show that in general their set of explanatory demographic variables is more strongly correlated with the former than the latter. In particular, all of the evaluative measures exhibit a positive correlation with income, while the three experienced well-being measures do not.
Helliwell and Wang (2012) compare the Cantril ladder, life satisfaction, happiness, and measures of positive and negative affect in the Gallup World Poll. They conclude that life evaluations, which include questions about happiness with life, satisfaction with life, and the Cantril ladder all give structurally identical responses to the same underlying variables. By way of contrast, reports of positive emotions, including happiness yesterday, are much less dependent on life circumstances, and have much less international variation. The same is true for measures of negative affect, only more so.
Knabe et al. (2010) compare affective well-being and life satisfaction between the unemployed and the employed. Net affect (positive minus negative emotions) is calculated using the Day Reconstruction Method (DRM) of Kahneman et al. (2004), while life satisfaction is answered on a 0-10 scale. The DRM slices up one particular day (yesterday, for from adolescent well-being variables (life satisfaction and the positive affect subscale of the CES-D during adolescence). They do not address the question of which of these well-being variables best predicts income (although they are not measured at the same waves, making a direct comparison impossible). The assumption in this literature is that it is current well-being which causes future income, rather than current well-being depending on expected future income.
20 See also Steptoe et al. (2014) for the analysis of the age shape of these different well-being measures across
example) and asks individuals to state what they were doing, with whom, and how they felt during each episode. The intensity of both positive (happy, competent/capable etc.) and negative (angry/hostile, worried/anxious etc.) feelings are reported. The DRM is thought to be superior to asking individuals directly about their feelings over the past month, say, as it avoids any recall bias. The main finding of Knabe et al. (2010) is that the life satisfaction of the employed is far higher than that of the unemployed, yet in terms of net affect the two groups are similar.21
Krueger and Mueller (2012) follow up on this finding, in data from the American Time Use Survey and panel data from the Survey of Unemployed Workers in New Jersey. Information is collected on emotions for three random episodes during the day in both datasets. These emotions are recorded on an intensity scale during the episode from 0 (did not experience at all) to 6 (felt extremely strongly). The feelings happy, sad, and stressed appeared in both datasets, with the ATUS additionally asking the respondents evaluation of the episodes in terms of pain, tiredness, and meaning. Krueger and Mueller confirm that there is no difference in average happiness or stress between the employed and the unemployed, as in Knabe et al. (2010). They do however find that the unemployed experience significantly more sadness and pain (although they are also less tired), and suggest that the conclusion of no difference in affective well-being in Knabe et al. (2010) was because they did not have information on sadness or pain.
Powdthavee and van den Berg (2011) consider the relationship of 15 different health conditions contained in the BHPS to two separate well-being measures: the GHQ and life satisfaction. In regression analysis they find that the rank of health conditions is very similar for GHQ and life satisfaction (with a Spearman rank correlation coefficient for the 15 health conditions of over 0.8).
Schimmack et al. (2008) use information from a small sample of the SOEP who answered both life satisfaction and affective well-being questions. The latter asked about the intensity of five positive and five negative feelings over the past year. Somewhat consistently with Knabe et al. (2010), unemployment is more strongly correlated with life satisfaction than with affective well-being. Schimmack et al. also have Big Five personality information. They find that all five personality traits are correlated with life satisfaction, but affective well-being is only predicted by Neuroticism and Extraversion.
Last, Baumeister et al. (2013) have information from an American online survey that includes a number of questions on both happiness and meaning. They find that income is far more strongly correlated with the former than the latter, while subjective health predicts happiness but not meaning.
What we add to this existing literature is the comparison of not just one estimated coefficient, but rather the whole vector of the estimated coefficients on the explanatory variables over three different datasets. The reason for doing so is to see whether the different available subjective well-being measures are explained broadly in the same way by respondent characteristics.
Evidence from the ESS
We first consider regression results from Wave 3 of the ESS using “standard” socio-demographic variables as controls. These are similar to those that are reported in Clark and Senik (2011), except that here we are going to estimate every equation using linear estimation. The set of right-hand side variables in these regressions is male, age and age-squared, three education dummies, four marital-status dummies, log income, nine labour-force status dummies, and 20 country dummies.22 Taking out the omitted categories in the sets of dummies, each regression has 17 estimated coefficients on socio-demographic variables, and 19 estimated country dummy coefficients.
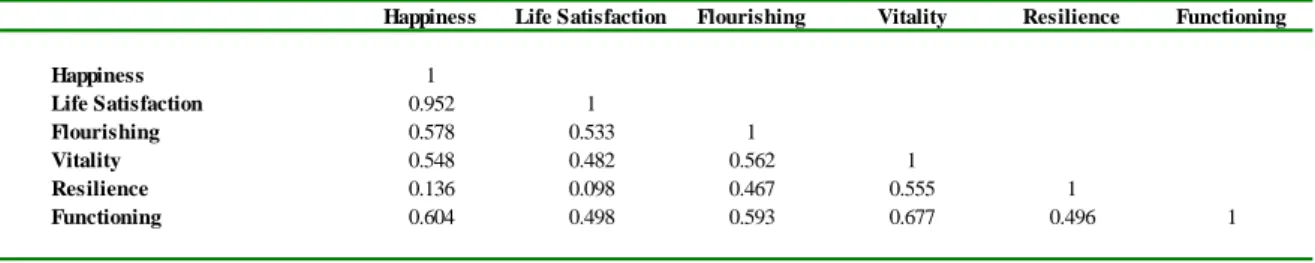
The next step then is to see how similar these estimated coefficients are between the different subjective well-being measures. This is what Table 4 shows. There are two levels at which this comparison can be effected: first, using all 36 of the estimated coefficients, including the 19 estimated country fixed effects; and second only considering the 17 individual-level socio-demographic (age, sex, education etc.) variables. These correspond to the top and bottom panels of Table 4.
The first striking conclusion from the top panel of Table 4 is that the pattern of the determinants of happiness and life satisfaction in the ESS are almost identical: the set of 36 estimated coefficients are correlated at 0.95 between the two measures. That this correlation was lower at 0.7 in the raw data in Table 1 suggests that the differences in the distribution of happiness and life satisfaction are due to variables that are not measured here, or could even simply be due to measurement error. The size of this correlation coefficient suggest that the
22 Education is missing in Cyprus, so there only 20 countries in the regression, as opposed to 21 in the
trade-offs in the life satisfaction and happiness regressions are very similar. For example, the estimated regression coefficients suggest that being unemployed has about the same effect on life satisfaction as about 2.2 log income points; this figure is 1.7 in the happiness equation. Along the same lines, disability is equivalent to a loss of 2.4 log income points in the life satisfaction regression; in the happiness regression this figure is 2.5.
This similarity in the determinants of happiness and life satisfaction does not wholly translate into eudaimonia. Here the correlations with life satisfaction are about 0.5, falling to 0.1 in the case of resilience. The analogous figures for happiness are about 0.6, and 0.14 for the correlation with the determinants of resilience.
Perhaps the most interesting feature of Table 4 is what happens when we look at the correlation only for the estimated coefficients on the individual-level variables (i.e. with the coefficients on the country dummies excluded). The correlation between the determinants of eudaimonia and life satisfaction now jumps up to 0.7 - 0.8, and that with happiness to 0.8 - 0.9. What this means in words is that the low correlations in some cells of the top panel of Table 4 were entirely due to country-level differences in the hedonic/life-satisfaction and eudaimonic measures of well-being. The same is actually true for the correlation between the determinants of the different measures of eudaimonic well-being in the ESS. Say that we came to the conclusion that it would be a good idea to do A, B and C (in terms of affecting some of the explanatory variables above) in order to raise life satisfaction. The similarity in the vector of estimated coefficients implies that this policy would probably also be a good idea in terms of raising the other measures of well-being as well. To this extent, well-being policy may not be overly-dependent on the retained measure of well-being.
This strong conclusion requires moderation. First, policy may not be in terms of all of the explanatory variables, but only one or two (where there may be greater potential differences between well-being measures). In this respect, it is worth noting that there are no sign oppositions across the six ESS well-being measures with respect to the estimated coefficients on education, marital status, income, unemployment or disability. Second, it may not be the overall correlation coefficient that interests us if we care about inequality in subjective well-being, and thus want to concentrate on one specific group of the population. Third, the correlations here are in terms of observables. Any policy that affected education and income (say) might also have an effect on the unobservables, with this effect being different across the well-being measures. Last, although we find a similar pattern of estimated coefficients here, this may not generalise to all well-being measures. As already noted above, Kahneman and Deaton (2010) find different data patterns in the four measures of well-being
that they analysis in Gallup-Healthways Well-Being Index data: the Cantril Ladder and three measures of feelings yesterday. The determinants of these four are not similar to each other, leading the authors to suggest that the measures of affect and life evaluation used in other surveys are likely contaminated by a common factor rendering them much less distinct from each other than the underlying variables that they are supposed to measure. This could easily be the case with the measures of happiness and life satisfaction in the ESS, and potentially also with the comparison of the hedonic/life-satisfaction and eudaimonic measures.
Evidence from the BHPS
We here consider the same five measures of well-being as in Table 2. We will regress these in turn on a standard list of individual-level variables (there is of course no need for country dummies here, as the BHPS is a single-country survey). This is the same list as used above for the ESS. It here comprises 18 variables (as there are ten labour-force status variables in the BHPS, as opposed to nine in the ESS).
In Table 5, the correlation between the estimated coefficients in the GHQ and life-satisfaction equations is 0.81.23 That between the eudaimonic variables, on the one hand, and GHQ or life satisfaction on the other varies between 0.66 and 0.92. Last, the correlation of the determinants of the different eudaimonia variables between themselves ranges between 0.65 and 0.90. These are all fairly high correlation coefficients. It is instructive to compare these to their bivariate counterparts in Table 2. They are all far higher: as was the case in the ESS data, there is far less correlation in the unobservable determinants of subjective well-being than there is in the observable determinants.
Evidence from the ONS
We last consider well-being regressions in the ONS data. These are taken directly from Office of National Statistics (2011), Reference Table 1. In a way these regressions are the polar opposite of those which were run above on ESS and BHPS data. These latter were pretty
23
Along somewhat the same lines, the time profiles of movements in subjective well-being after the onset of a life event (marriage, divorce, widowhood, birth of a child and unemployment) are remarkably similar for GHQ and life satisfaction in BHPS data: see Clark and Georgellis (2013). Von Scheve et al. (2013) note however that the time path of adaptation to unemployment differs according to (single-item) well-being measures in data from the German Socio-Economic Panel (SOEP) for 2007-2012. The effect of unemployment on anxiety and happiness (reported over the last four weeks) lasts only year. There is no impact effect for anger, but this rises with unemployment duration. Last, there is no adaptation in terms of sadness, nor in terms of life satisfaction (as in Clark et al., 2008).
stripped-down, with under 20 right-hand side variables. Those reported in the ONS publication include 106 right-hand side variables.
It is not clear that there is any mechanical relationship between the number of regressors and the way in which their estimated coefficients correlate across different dependent variables. As it turns out, the paucity or plenitude of variables on the right-hand side does not seem to materially affect our qualitative conclusions regarding the size of any correlation. The correlation coefficients reported in Table 6 for the four subjective well-being measures in the ONS data are all around 0.8 in absolute terms or higher.
It is perhaps worthwhile emphasising the figure in the bottom left corner of Table 6, showing that the correlation coefficient between the correlates of life satisfaction and the feeling that the things you do in your life are worthwhile is 0.96. The observables here are correlated in a very similar way with the life satisfaction of Britons and their feeling that their lives are worthwhile.
The correlation that has been uncovered here is in terms of the regression coefficients. This does not mean that the level of the two well-being measures being compared will be the same. Some individuals may have unobserved underlying personality traits which mean that they are always pretty satisfied with their lives, but these same traits do not affect their eudaimonia. In this case, we would have a strong correlation between the regression coefficients, but the levels of the two well-being variables will not necessarily be correlated (although Section 2 suggested that they actually were to a degree). In policy terms, we might well be interested in these traits, if they can potentially be changed.
However, in a sense the analysis carried out in this and the previous Section is of only partial use. Knowing that life satisfaction and some other putative well-being measure are correlated at 0.6, say, is an interesting fact. But we need to understand what this correlation reflects. If individuals have different reporting styles, with these styles being applied across well-being measures, then the latter will mechanically be correlated amongst themselves (this reporting style can be assimilated to innate cheerfulness, or to the individual’s well-being set-point: see Cummins, 1995, on the latter).24 If this reporting style is time-invariant, then panel data might help here. Unfortunately, a lot of data with well-being measures is not panel, and that which is does not always consistently include the same well-being measures at every
24 Individuals who give the same answer to all well-being questions, out of a desire to finish the questionnaire
quickly, will also produce artificial correlation. This is an issue when all well-being measures are on the same scale: it would apply less to the comparison of GHQ and life satisfaction in the BHPS, for example.
wave. Even without any reporting-style effect, knowing that two measures are correlated does not answer the question of which of the two actually matters more for individuals.
Up to now, we have considered subjective well-being measures as being mental-state measures that pick up the utility experienced by individuals. In the next section, we will link these measures to individuals’ future behaviour. It might be argued then that the focus has changed somewhat, and we now use the answers to subjective well-being scores as revealing individual preferences. The argument here is that individuals prefer to have higher levels of well-being if possible (however this well-being is defined), and will potentially act in order to increase it. They will leave low well-being situations to move to those with higher well-being. The well-being measure that then most closely correlates with actual behaviour will be that which best reflects individuals’ preferences.25
As these behavioural beauty contests are within-individual (the same person reports two or more well-being measures, which are used to predict that individual’s future outcomes), any common reporting style will also be controlled for.
4.
Behavioural beauty contests: Which measure predicts
best?
Showing that subjective variables predict future observable outcomes has become something of a cottage industry associated with the interpersonal validation of subjective well-being reports: a useful recent summary is de Neve et al. (2013). After all, if these numbers are just noise, then we can’t expect them to predict individuals’ future behaviour. And even if they are not noise, but we cannot compare my six to your five because we use the scale differently, then we again cannot predict what I will do in the future relative to what you will do, as we do not know whether I was happier or less happy than you to start with. This is known as the problem of the interpersonal comparability of well-being scores (see Dolan and Fujiwara, chapter B, this Handbook). Finding that people who say that they are less happy now are more likely to undertake some action in the future (typically associated with leaving that unhappy state) has produced some convincing evidence that there is information in what people say. This is perhaps rather a weak null hypothesis, although it is not uncommon to see cross-section well-being distributions dismissed for exactly this reason. The beauty contests
25 The discussion here is couched in terms of current well-being predicting future behaviour. As discussed in
note 11, future outcomes could rather directly affect current well-being. In this case, the empirical test here will show which current well-being measure is most affected by these future outcomes.
described below will seek to establish which of a number of well-being measures is the most strongly correlated with future outcomes.
Some of the earlier contributions in this area used panel data (with repeated observations on the same individual over time) to show that individuals who said that they were less satisfied with their jobs when interviewed were more likely to have quit that job when re-interviewed in the future. Again, were we simply not able to compare my six to your five then we could not have predicted this behaviour. Perhaps the first contribution here is Freeman (1978), who uses panel data from three surveys (NLS Older Men; the Michigan PSID; and NLS Younger Men) to show that current job satisfaction scores are typically at least as strong a predictor of future quits as are current wages (see also Akerlof et al., 1988, for further evidence data from the NLS Older Men survey, and Clark et al., 1998, for results from the first ten years of the SOEP). All of these papers analyse job quitting in a multivariate regression framework, which means in words that we are asking whether subjective evaluations add information over and above the typical objective characteristics of the worker and her job (age, sex, education, industry, occupation, wages, hours of work, and so on).
Research in this respect on the labour market has not only been restricted to seeing how long employees stay in their jobs. Analogously, Georgellis et al. (2007) use the self-reported job satisfaction scores of the self-employed in Waves 1 to 8 (1991–1998) of the BHPS to predict how much longer they will remain in self-employment: the least satisfied are the fastest to leave. Clark (2003a) also uses BHPS data to show that the size of the drop in GHQ upon entering unemployment predicts how much the individual searches for a new job, and how fast they leave unemployment: those who suffered the largest well-being drop search more and leave the fastest. This result has been updated by Mavridis (2015), and replicated using data on life satisfaction in SOEP data by Clark et al. (2010).
There has also been work on predicting future marital separation using current reported subjective well-being scores. Here there are two people involved in a couple, so that we have two well-being scores. Guven et al. (2012) appeal to long-run panel data from three separate countries (BHPS, SOEP and Australian HILDA data) to show that happier marriages (measured by the average life satisfaction score of the husband and wife) will last longer in the future.26
26 Guven et al. (2012) also show that it is not only average life satisfaction that matters, but also its distribution.
In particular, for a given total sum of husband’s and wife’s life satisfaction, couples where the husband is more satisfied than the wife are more likely to split up than couples where the wife is more satisfied than the husband.
Most of this validation work has only used one single well-being measure to predict future behaviour. It is fairly rare to compare the predictive power of different measures in order to establish which one performs the best, and therefore which is arguably more closely correlated with individual preferences.
One example of such a well-being beauty contest is Clark (2001), where different measures of satisfaction with job domains are used to predict future quits in the first seven waves of BHPS data: that which predicts the best (which turns out here to be satisfaction with job security) is argued to be the most important aspect of the job for the individual.27 Another is Green (2010), who uses multiple well-being measures to predict future behaviour. The context is again the labour market, with panel data from the UK Skills Survey being used to predict future quitting from the job. The well-being measures in the dataset include an overall measure of job satisfaction, and multiple-item Warr scales reflecting job-related well-being along the Depression–Enthusiasm and the Anxiety–Comfort axes. It is first shown (in his Table 2) that both depression-enthusiasm and anxiety-comfort independently predict future quitting. However, when we add job satisfaction to the model, it attracts a strongly negative estimated coefficient (individuals who report higher job satisfaction scores are less likely to quit in the future), while both depression-enthusiasm and anxiety-comfort play no further role in predicting future quits.
Turning away from the labour market to health, well-being measures can be used to predict longevity. A well-known piece of work by Danner et al. (2001) analysed the short life sketches written by 180 nuns in Milwaukee when they joined the order in the 1930s, at around age 22. These sketches were scored for emotional content and related to survival during ages 75 to 95. The results show a strong link between positive emotion in early life and longevity six decades later.
This kind of analysis can be put on a more formal footing, with in addition a comparison of different well-being measures, using data from the English Longitudinal Study of Aging (ELSA: http://www.ifs.org.uk/ELSA), which covers individuals aged 50 or over. The first wave of ELSA took place in 2002/03, and individuals are re-interviewed every two years. Each wave of ELSA data included a number of well-being measures. In Steptoe et al. (2012) these are related first to illness and then to mortality, both measured in March 2012. In particular, two subjective well-being measures are compared: affective well-being, as given
27 The greatest predictive power is revealed by comparing a statistical measure of the fit of the different models.
When using a probit or a hazard model to predict future quits, the best fit corresponds to the least negative log-likelihood (this is the regression with the greatest explanatory power).
by answers to a question about enjoyment of life (this question is part of the CASP-19); and life satisfaction. The former was asked in the first wave of ELSA, but the second did not appear until the second 2004/05 wave.
The analysis of mortality relates enjoyment in 2002/03 to mortality in March 2012; this covers 9025 individuals, of whom 1785 died. Enjoyment with life in 2002/03 is split into tertiles. Controlling only for age and sex, hazard-rate analysis (where the hazard here is dying) shows that those in the highest enjoyment tertile in the first wave had a 57% lower probability of dying by March 2012 than those in the lowest tertile. Including successive blocks of covariates reduces this differential. But even the full model, which conditions on depression, health, negative affect, smoking and drinking, amongst other variables, only drives this figure down to 30%.
The parallel analysis using life satisfaction as the explanatory variable (which does not appear until Wave 2 of ELSA, making for a shorter analysis period) reveals similar findings. However, the effect size is much smaller. Controlling for only age and sex, those in the highest satisfaction tertile in the second wave had a 31% lower probability of dying by March 2012 than those in the lowest tertile. Including successive blocks of covariates reduces this differential, and in the full model (as for enjoyment above) the differential is only 9% and, more to the point, insignificant.
It would be of great interest to carry out this kind of analysis systematically for all of the well-being variables available in earlier waves of ELSA. As it stands, the results in Steptoe et
al. (2012) do seem to suggest that (one aspect of) positive affect is far more salient in
predicting mortality outcomes than is a general evaluative measure of life satisfaction. Of course, mortality is a somewhat different variable than divorce or job quitting, as it is less of a choice. It may be thought in particular unsurprising that emotions play a large role here.
It is also possible to carry out these kinds of beauty contests among subjective well-being measures using the BHPS. Here we can carry out a simple test, seeing which of life satisfaction or GHQ measured at year t is best able to predict some future observable event. Here I will concentrate on future marital break-up, and consider the possibility that those who were married at year t were separated or divorced when they were re-interviewed one year later (at year t+1).28 Both of these well-being variables do indeed predict future marital break-up: individuals decide to leave situations that are associated with lower well-being. However,
28 Marital break-up does of course involve two people. Some individuals will have low well-being at time t
because they know their partner is about to leave (and will have done so at t+1). The comparison here shows which current measure is most affected by this knowledge.
when we introduce both well-being measures together, it turns out that life satisfaction is a stronger predictor of break-up than is the GHQ (the coefficient on z-score transformed GHQ is less than a third of the size of that on life satisfaction). If we therefore had to choose between life satisfaction and GHQ in terms of what best predicts individual behaviour and thus best reflects preferences, this result suggests that we should choose the former.
We can also look at Waves 11 and 16 of the BHPS, which included the nineteen questions making up the CASP-19 (see Appendix B). These can be introduced sequentially to see which predicts the most strongly divorce or separation by Wave 12 or 17. The sample here is smaller, as it consists of only individuals who were married in Wave 11 or 16 of the BHPS (and who provided CASP-19 information at Wave 11 and 16, and who were re-interviewed in Wave 12 or 17). Even so, some potentially useful information results from this exercise. These regressions control for labour-force status, sex, education, number of children, age and age-squared, the log of household income, self-assessed health, and region and wave dummies. They are estimated on the sample of individuals aged between 16 and 60.
Ten out of the 19 questions are found to individually significantly predict future marital break-up in this smaller sample. The two strongest correlations are with the questions on satisfaction with the way life has turned out, and looking back on life with happiness. The next two are feeling left out of things, and looking forward to each day. The other six questions with significant coefficients attract far smaller estimates.29
Finally, some recent work has used hypothetical and actual choices to evaluate whether individuals make decisions based only on happiness or rather on happiness and something else as well.
Benjamin et al. (2012) consider a sequence of hypothetical pairwise-choice scenarios. In the example they highlight (page 2087), individuals are asked to decide between two new jobs. The jobs are identical except with respect to work hours and pay, as follows.
Option 1: A job paying $80,000 per year. The hours for this job are reasonable, and you would be able to get about 7.5 hours of sleep on the average work night.
29
These are shortage of money stops me from doing the things I want to do, family responsibilities are inhibiting, enjoying the activities that the respondent participates in, not being in control of life, life has meaning, and the future looks good. The coefficients on all of these six are about one-third the size of the largest estimated coefficient (that on being satisfied with way life has turned out).