Deconstructing Complex Diseases: Identification of New
Phenotypical Sub-clusters of Type 2 Diabetes Using
Machine Learning
by
Priyasha Mehta
B.E. Computer Engineering (2004)
Institute of Engineering and Technology, DAVV, Indore, India
Submitted to the System Design and Management Program
in Partial Fulfillment of the Requirements for the Degree of
Master of Science in Engineering and Management
at the
Massachusetts Institute of Technology
June 2019
2019 Priyasha Mehta. All rights reserved
The author hereby grants to MIT permission to reproduce and to distribute publicly paper and electronic
copies of this thesis document in whole or in part in any medium now known or hereafter created.
Signature redacted
Signature of Author
System Design and Management Program
May 20, 2019
Signature redacted
Certified by
Steven . S ear, DBA MS MS
- Thesis Supervisor
Senior Lecturer, MIT Sloa School of Management
Signature redacted
Accepted by
Joan Rubin
MASSACHUSETTS INSTITUTE Executive Director, System Design & Management Program
OF TECHNOLOGY
Deconstructing Complex Diseases: Identification of New Phenotypical
Sub-clusters of Type 2 Diabetes Using Machine Learning
by
Priyasha Mehta
Submitted to the System Design and Management Program on May 20, 2019 in Partial Fulfillment of the Requirements for the Degree of Master of Science in Engineering and Management
Abstract
Advances in data science and technology promise to help clinicians diagnose and treat certain conditions. But there are other complex and poorly characterized illnesses for which the drivers and dependent variables are not understood well enough to take full advantage of the copious patient data that may exist. For these diseases new techniques need to be explored to gain better understanding of the nature of the disease, its subtypes, cause, consequence, and presentation. Modern genetics have shown that these diseases often have multiple subtypes, as well as multiple phenotypes as indicated by the new laboratory data. Examples of such diseases include
common and important illness such as Type 2 diabetes (T2D) - affecting approximately 30
million Americans, Crohn's Disease - 1 million USA suffers, epilepsy - 3.4 million
Americans, and migraines - another 3.2 million in the United States. Our research explores
how machine learning (ML) can be applied to these less well understood complex diseases to improve clinical translation and management.
This thesis will discuss how unsupervised machine learning techniques can be used for complex phenotype clustering to identify sub-types of T2D for better clinical management and treatment. T2D is a complex heterogenous disease affecting the world's population at rapidly increasing rates. While clinicians now better understand the heterogeneity of the disease, T2D treatment strategies still remain largely based on populations rather than on a specific patient's subtype. This thesis explores the concept of using data analytics and ML to identify sub-types of T2D as the first step in moving towards precision medicine & treatments.
This thesis includes (a) characterization of T2D as a heterogenous disease, (b) existing research attempts to dissect the disease into sub-types based on phenotypes and gene expressions, and their limitations, (c) phenotype clustering analysis on T2D patients using unsupervised machine learning techniques and MIMIC III database, and (d) analysis of the clusters/sub-groups in different ways to understand their clinical significance. With multiple iterations of the clustering experiment, this thesis, (a) provides a good test of concept for sub-classification of T2D patients using unsupervised machine learning techniques such as, clustering and dimension reduction, (b) establishes a data pipeline and clustering model framework to be applied to richer datasets, (c) suggests various experiment design options for further analysis, and (d) establishes a direction for future work including advanced modelling techniques and predictive analytics for complex diseases.
Thesis Supervisor: Dr. Steven J. Spear
Acknowledgements
I still remember the day I got the acceptance letter from MIT, I would not believe my eyes and
went on reading it again and again. It was a dream come true! While getting into this
prestigious institute was tough, sailing through it was tougher. MIT not only pushed me beyond
my perceived limits (in every sense of the word), but also taught me how to be resilient when
facing seemingly unsurmountable challenges. At the end, I can only say
-
'Every bit ofthe MIT
experience was worth it!' This thesis is a culmination of my enriching journey at MIT and I
would like to express my deep gratitude to many individuals who made it possible.
First, I want to express my sincere thanks to Professor Steven J. Spear, my thesis advisor, for
introducing me to this interesting research area and for believing in me. For the last one year,
he has guided, mentored and supported me immensely. I greatly benefited from his keen
scientific insight, and his ability to put complex ideas into simple terms. Thank you, Professor
Spear for giving me this opportunity!
My sincere gratitude to Dr. Steven Levisohn (specialist in internal medicine & complex
patients at MGH) and Dr. Miriam Udler (specialist in endocrinology at MGH and Broad
Institute), for their time, input, guidance, feedback and counsel. While I have always been
intrigued by healthcare and medical science, I was a complete novice to this domain when we
started this research. You pointed me to the right resources and methods. I have learnt a lot in
this journey and it would not have been possible without your unparalleled expertise and
invaluable insights!
I am also grateful to Mr. Vikram Kirloskar, an MIT alumnus for funding this research. Thank
you, for believing in us and supporting us. Additionally, I would like to thank my research
colleague and friend, Hua Xu for all his suggestions and contributions.
My heartfelt thanks to Joan S. Rubin, Executive Director, SDM. She created an opportunity
that will mark me for the rest of my life. In addition, I would like to thank all the SDM staff
who helped me along the way.
Sincere appreciation goes to my family for their love and support. To my mother, Anju Mehta,
for her unconditional love, devotion, dedication and countless sacrifices. You taught me the
value of education and shaped me into who I am today. To my father, Vinod Mehta, for
teaching me the importance of discipline and perseverance. To my brother, Harsh, for his
unwavering support. He would never let me go down and believed in me more than I myself
did. I love you all!
Last but certainly not the least, I would like to thank my closest friend, Nishchal, who has
always been there, supporting and hearing me out, helping me sail through the tough times,
and making this journey possible. You sacrificed a lot, and your love, support and prayers kept
me going. I owe this to you for that!
Table of Contents
A BSTRA C T ... 3 A C K N O W LED G EM EN TS... 5 TA BLE O F C O N TEN TS... 7 LIST O F FIG UR ES ... 9 LIST O F TA BLES ... 10 LIST O F A BBR EV IA TIO NS... 11 I IN TR O DU CTIO N ... 13 1.1 BACKGROUND ... 13 1.2 RESEARCH OBJECTIVE ... 161.3 M ATERIALS AND M ETHODS ... 17
1.4 THESIS OUTLINE ... 18
2 O V ER V IEW O F TYPE 2 D IA BETES... 20
2.1 DIABETES CLASSIFICATION AND T2D HETEROGENEITY ... 20
2.2 RECENT STUDIES TO DISSECT HETEROGENEITY OF T2D ... 21
2.3 RESEARCH APPROACH IN CONTEXT ... 25
3 EX PER IM EN TATIO N ... 26
3.1 M IM IC III DATABASE... 26
3.2 DATA ANALYTICS AND M ACHINE LEARNING TECHNIQUES... 28
3.3 CLUSTERING: DATA ANALYSIS AND EXPLORATION ... 30
3.4 CLUSTERING: DATA PREPARATION AND AGGREGATION... 32
3.5 FEATURE EXTRACTION -LAB M EASUREMENT CATEGORIES ... 35
3.6 EXPERIMENT 1: K-MEANS CLUSTERING ... 36
3.7 EXPERIMENT 2: K-M EANS CLUSTERING WITH PCA ... 41
3.8 FRAMEW ORK FOR CLUSTERING EXPERIMENT ... 55
4 D ISCU SSIO N & C O N C LUSIO N ... 56
4.2 LiMITATIONS ... 58
4.3 NEXTSTEPS ... 58
5 FUTU R E R ESEAR C H ... 60
6 R EFER ENC ES... 62
A PPEND IX A : C LIN ICA L D A TA BA SES... 65
APPEND IX B: ICD-9 CO D ES FO R T2D ... 67
List of Figures
Figure 1: Type of diabetes (Udler, Miriam S.) [28]... 21
F igure 2: T2D C lusters Li et al. [29]... 22
Figure 3: T2D Clustering by A hlqvist et al... 23
Figure 4: Genetically defined T2D Clusters by Udler et al. [30]... 24
Figure 5: MIMIC Tables relationship mapping... 31
Figure 6: Data Preparation andAggregation Process ... 32
Figure 7: Summary of lab-events for all T2D patients ... 33
Figure 8: Summary of outpatient lab-events for T2D patients... 33
Figure 9: Experiment ] -Overview of K-means clustering ... 37
Figure 10: K-means: Optimal Number of Clusters ... 37
Figure 11: Experim ent ] -Cluster plot... 38
Figure 12: Experiment 2 -Overview of K-means Clustering using PCA ... 41
Figure 13: Proportion of variance explained by each PC... 42
Figure 14: Cumulative variance proportion explained by PCs ... 43
Figure 15: Proportion of original variables in each PC ... 44
Figure 16: PC] mainly composed of Platelet Count ... 45
Figure 17: PC2 mainly composed ofASTandALT ... 45
Figure 18: PC3 mainly composed of Glucose... 46
Figure 19: Experiment 2: Optimal number of clusters... 47
Figure 20: Experim ent 2 -Cluster Plot ... 47
Figure 21: Experiment 2 -Ethnicity Distribution forfour clusters... 49
Figure 22: Experiment 2 -Gender Distribution for four clusters ... 50
Figure 23: Clustering Analysis Framework... 55
Figure 24: An overview of MIMIC III Database [10]... 65
Figure 25: History of Partners Bio-Bank [1]]... 66
Figure 26: ICD -9 Codes for T2D ... 67
List of Tables
Table 1: Associations of cluster genetic risk scores & clinical outcomes
from
GWAS [30].. 25Table 2: Tables in M IM IC III Database ... 27
Table 3: Experiment D esign Selection... 30
Table 4: Number of distinct patients for each lab measurement for T2D ... 34
Table 5: Sample entries for the filtered data-frame before data aggregation... 35
Table 6: Final matrix for clustering - Sample data ... 35
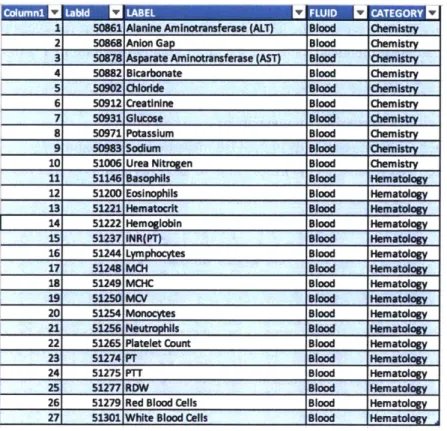
Table 7: Final Lab Measurements for clustering ... 36
Table 8: Experiment ] -Patient Distribution among the clusters... 38
Table 9: Experiment 1 -Cluster mean comparison... 39
Table 10: Experiment ] -Demographics Comparison ... 40
Table 11: Experiment 2 -Patient Distribution among Clusters... 48
Table 12: Experiment 2 -Demographics Comparison... 48
Table 13: Experiment 2 -Cluster mean comparison... 51
Table 14: Experiment 2 -Cluster comparison for variables represented by PCs... 51
Table 15: Experiment 2 -Top 25 disease diagnoses for cluster 1... 52
List of Abbreviations
Al Artificial Intelligence
ALT Alanine Aminotransferase
ANOVA Analysis of Variance
AST Aspartate Aminotransferase
BMI Body Mass Index
bNMF Bayesian Nonnegative Matrix Factorization
CITI Collaborative Institutional Training Initiative
DNA Deoxyribonucleic Acid
EHR Electronic Health Record
GADA Glutamic Acid Decarboxylase Antibodies
GWAS Genome-Wide Association Studies
GRS Genetic Risk Score
HbAle Hemoglobin A Ic
HOMA2-B Homeostasis Model Assessment -
p-cell
functionHOMA2-IR Homeostasis Model Assessment - Insulin Resistance
ICD International Classification of Diseases
ICU Intensive Care Unit
IDE Integrated Development Environment
ISB Institutional Review Board
LDA MGH MIMIC III ML PCA SNP SVD t-SNE TID T2D
Linear Discriminant Analysis Massachusetts General Hospital
Medical Information Mart for Intensive Care III Machine Learning
Principal Component Analysis
Single-Nucleotide Polymorphisms
Singular-value Decomposition
t-Distributed Stochastic Neighbor Embedding Type 1 Diabetes
1
Introduction
Advances in data science and technology promise benefits in helping clinicians diagnose and treat certain conditions. But there are other conditions for which the science of the diseases is not understood well enough to take full advantage of data science's possibilities. Our research explores how machine learning can be applied to these less well characterized diseases to improve clinical translation and management.
1.1 Background
Modern medicine has advanced remarkably in its ability to measure, characterize, define, and treat multiple diseases. There is a lot of excitement about the possibility for precision or personalized medicine [1] [2] given the capabilities of computers to gather, store, and process extraordinary amounts of information about individuals and the populations they are part of. Despite those promises, there are problems that have to be rectified by the data science community before that potential can be realized. Some of those problems have been discussed below. However, even if those problems were all resolved, there are still some important illnesses for which too little is known about the disease to have precision and personalized
medicine. Our research explores that domain by using machine learning (ML) to better
understand these diseases as a precursor for the precision or personalized medicine.
According to National Research Council, 'Precision Medicine' refers to the tailoring of medical treatment to the individual characteristics of each patient which can include genotypes, phenotypes, patient history, environmental conditions, and the like [2] [3]. In other words, if we collect sufficient data (enough both in terms of observations/patients and also in terms of fields/data types per observation), then we can fit curves describing the relationships among these individual characteristics (driver variables) and dependent variables (tailored treatments
for individuals).
From a data science perspective, there are another of assumptions that need to be true for such a thing to happen.
- At the population level, there is the assumption that comprehensive, consistent data has
been collected across a sufficient number of patents and fields to fit curves. However, medical data typically wasn't collected for later mining, learning, deep learning, etc. It was
collected for record keeping-to track for billing, reimbursement, reminders, etc. The data science community will have to consider how to 'repair' historical data so it's more useful and will have to prescribe how to collect data going forward.
- At the individual level, there are two assumptions. First, the data about individual patients
has been collected completely and cleanly so where they fit in the larger population can be determined. That assumption for individuals fails for the same reasons as for populations. Second, the various specialists and sub specialists who treat individuals share a common view of their patients. However, medical records have typically not been gathered in such a coherent integrated way. Rather, the records one specialist might have are not linked to those of others.
Even if all that were corrected for, there is still another medical science problem. There are some diseases for which too little is known about the relationships among driver and dependent variables to have 'precision medicine' even if the data records were complete and pristine. Type 2 diabetes (T2D) is one example of the many of these.
Therefore, the focus of this research is a precursor to precision medicine. We ask, given the data available to us, can we come to a better understanding of diseases so there's better chance at recognizing cause and consequence.
1.1.1 Initial Research Question
The promises of modern data science & machine learning along with the challenges of data
structure and data mining in the clinical setting led us to our initial research question - 'How
much of a clinician's decision making can be augmented or replaced using machine learning (ML) techniques?'. As a first attempt to answer this question, we collaborated with clinicians
at the Massachusetts General Hospital (MGH) to explore the dilemmas they face, their requirements, and the databases that can be used with automated techniques. As the next step, Hua Xu [4] provided a systematic analysis on application of machine learning in healthcare system, current ML capabilities and how they can be used to augment clinical decision making. In his thesis, he proposed following four major research areas where ML can be used to
augment clinical decision making - Data Visualization, Crowd Sourcing, Complex Disease
This thesis extends Xu's work and will focus on one of the above research areas of Complex
Disease Clustering (as a precursor to precision medicine) with a deeper look at Type 2 Diabetes
(T2D) sub-classification.
1.1.2 Complex Disease Clustering
Machine learning can be broadly classified into two categories, (a) supervised learning and (b) unsupervised learning. Supervised learning means to predict a known output of target, using a training set that includes already classified (labeled) [5][6] data to draw inference or classify prospective, testing data. In unsupervised learning, there is no output to predict, so analyzers try to find naturally occurring patterns or grouping within unlabeled data [7][8].
Supervised machine learning includes in part, classification techniques, in which machines sift through detailed data, for example, finding cancerous cells in sample images with greater acuity than the human eye. Machines can also store and recall more details about more cases than can people, and they can fit curves across more driver and dependent variables than humanly possible. The promise of personalized and precision medicine emerges from these technical capabilities.
That said, there are situations which don't lend themselves to either of these approaches. Among these are diseases for which symptoms are already detectible, so classification technologies are not substantial value adders. For other diseases, there may be different phenotype expressions and genetic associations, but understanding cause and consequence may not be advanced enough to sort among driver and dependent variables. So, regression analysis-as a means of developing surveillance tools and treatment protocols-is not yet all that helpful either.
For these poorly characterized ailments, copious patient data may exist, but it needs to be explored to gain better understanding among cause, consequence, and presentation. Diseases that fit within this group include Type 2 diabetes (T2D), Crohn's Disease, epilepsy, and migraines. This is where unsupervised machine learning models (for e.g. clustering analysis, deep learning, etc.) are useful in finding hidden patterns in the available data (phenotypes, gene expressions, etc.), helping to dissect the heterogeneity of these complex diseases [7].
1.2 Research Objective
This research has several objectives both for data scientists trying to understand how their expertise can advance the practice of medicine and for clinicians trying to improve understanding of disease and translation of that understanding into practice.
As stated in section 1.1, this thesis explores and evaluates the area of 'Complex Disease Clustering' as one of the ways to augment clinical decision making. We start with an existing problem of T2D disease sub-type classification and aim to provide a working model for complex disease clustering using unsupervised machine learning techniques, as discussed in subsequent chapters.
Below is a brief overview of the problem and the implications of this research. Disease
Type 2 Diabetes is a common illness, for which considerable data has been gathered, but for which there is still an inadequate understanding among genotype causes, phenotype expression, responses to treatments, and so forth. In comparison, Type 1 Diabetes is understood as an autoimmune problem affecting pancreatic function, but that only accounts for some 10% of diabetics. Another 5-10% have versions with well understood causes and consequences. This leaves some 85% of patients with T2D disease, making it a highly heterogenous complex disease for which causal understanding still needs to be developed. For example, a common perception is that excess eating leads to excess weight leads to diabetes. However, while a logical inference, that is unproven causality. It well could be that both the excess weight and the diabetes (and even the eating) are consequences of some other common cause yet to be discovered.
Therefore, a refined sub-type classification of T2D could provide a powerful tool in understanding the complex diseases and providing tailored treatment regimens to T2D patients eventually helping them and clinicians to better manage the disease.
Implications for data scientists:
We start by establishing how data is currently available for Type 2 diabetes and how it can be used to assist in diagnosis, treatment planning, and follow up.
Based on limitations imposed by current data content and structure, we'll suggest approaches so data collected in the future will have more value for clinical management of individuals and populations.
By addressing a particular disease in the first round of study, we aim to establish a model for
assessing the data content and structure and recommended data uses for other diseases with similar degrees of understanding (of the basic science) and data usability, such as Crohn's and
epilepsy.
Implications for disease specialists:
Much understanding about Type 2 Diabetes, which we are using for our first efforts, is of associations among factors, not cause and effect. In turn, advancing the understanding of cause and effect (or at least, detail on associative relationships) should have positive effect on the ability to prevent and treat.
The same symptom-elevated blood sugar-describes an enormous population, obscuring the possibility that similar presentations are masking distinct causes which merit distinct treatments. By creating better detail about what sub-populations might exist within the overall population, as a step towards finding causality, we expect to use data and data visualization to help clinicians and patients. Ideally, diabetes wouldn't be largely a symptomatic condition (elevated blood sugar levels). Rather, patients could be monitored/surveilled within their cluster, so as leading indicators start to drift, an alert can be sounded to clinicians that the situation needs closer monitoring and precautionary investigation/ intervention.
Furthermore, other diseases likely have similar hidden links among driver and dependent variables that would lend themselves to a similar approach leading to the shift of treatment
from reactive to predictive.
1.3 Materials and Methods
Data Base
The MIT owned MIMIC III (Medical Information Mart for Intensive Care) [9][10] database was chosen as an easy to access starting point for testing different algorithms for clustering and disease classification. What was concluded from this study can be subsequently tested and replicated against richer medical data banks such as Partners Biobank database [11][12] and
UK Biobank [13][14]. This will be discussed in chapter 5. For detailed description of Mimic III and Biobanks, refer to Appendix A.
Data Processing
Because driver and dependent variables are not well classified, 'cluster analysis' was chosen as the machine learning strategy. The intent in using this approach is finding distinctive sub populations of patients whose clinical attributes associate with each other (but are distinct from the patterns of associated measurements in other clusters). Identifying distinct clusters creates the possibility of exploring each as a potentially distinct disease (albeit with common expression as elevated blood sugar levels) as a precursor for then trying to determine statically, empirically, or theoretically relationships between cause and effect.
Clustering
Specifically, unsupervised machine learning clustering technique known as 'K-means clustering' [15] [16] was used for analysis. Clustering was performed on mean values of
phenotype (laboratory) measurements for T2D patients in MIMIC III database.
Experimentation was done with different variations of cluster analysis - with & with-out
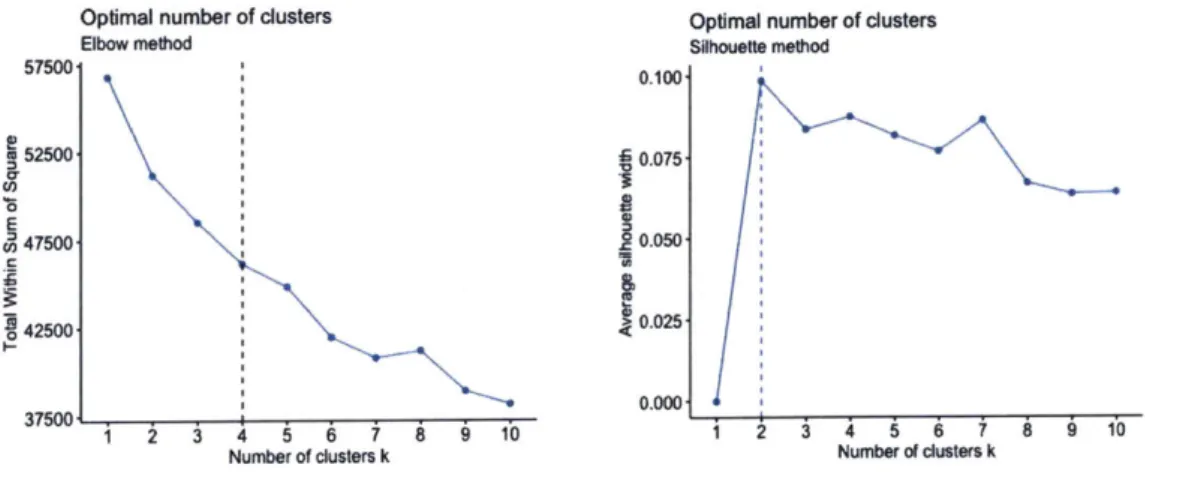
dimension reduction. Principal Component Analysis (PCA) [17] [18] was used for dimension reduction. Silhouette width and elbow methods [19] were used to determine the optimal number of clusters for each run of the experiment. Finally, ANOVA (Analysis of Variance) test [20] [21] was used to compare the results for subjects (patients) across different clusters.
All computations were done using R version 3.4.2. Chapter 3 discusses the data preparation,
data aggregation and clustering experiment in detail.
1.4 Thesis Outline
This thesis consists of five chapters, including background introduction, overview of T2D, clustering experiment, conclusions drawn from experiment, limitations, and recommendations for future work.
Chapter 1: Outlines research background, objectives, materials & methods, and the thesis structure.
Chapter 2: Provides an overview of Type 2 diabetes, previous research for its sub-type classification, their limitations and our research as a differentiating factor.
Chapter 3: Contains detailed experiment for T2D clustering using phenotypes including, data preparation, experiment design, clustering analysis and results.
Chapter 4: Includes summary and discussion of the research findings, insights, limitations and next steps.
2 Overview of Type 2 Diabetes
Diabetes is a disease affecting approximately 30 million (9.4%) people [22] in United States and more than 400 million people worldwide [23] with a rising trend in numbers in the coming decades. Diabetes and its complications now rank among the leading causes of death in the United States [24]. The total direct and indirect medical cost attributable to diabetes in the
United States in 2012 was $245 billion [22].
While a lot of data has been gathered around this disease, existing treatment strategies have been unable to stop the progressive course of the disease and prevent development of chronic complications due to diabetes. One explanation for these shortcomings is that diagnosis of diabetes is based on measurement of only one metabolite, glucose, but the disease is heterogeneous with regard to clinical presentation and progression.
2.1 Diabetes Classification and T2D Heterogeneity
With such high and increasing prevalence of diabetes, any clinician's main goal is to be able to provide right treatment to the right patient. One of the first steps in effectively managing
diabetes patients is understanding - 'What type of diabetes does the patient have?'.
Current clinical classification primarily classify diabetes into two subtypes: type 1 diabetes (TID) and type 2 diabetes [25]. This classification relies primarily on the presence (type 1
diabetes) or absence (type 2 diabetes) of autoantibodies against pancreatic islet
P-cell
antigensand age at diagnosis (younger for type Idiabetes). A third subgroup, latent autoimmune diabetes in adults (LADA; affecting <10% of people with diabetes), defined by the presence of glutamic acid decarboxylase antibodies (GADA), is phenotypically indistinguishable from T2D [26]. Some other subtypes include ketosis-prone and monogenic forms of diabetes such as maturity onset diabetes of the young and neonatal diabetes which have well understood causes and diagnosis methods [27].
N
Type 2
m
Ketosis-Prone
SLADA
Type 1
m
Monogenic
mOther
Figure 1: Type of diabetes (Udler, Miriam S.) 1281
In current clinical practice, the diagnostic process of determining the diabetes "type" typically involves initially assessing for causes other than T2D. For example, detection of auto-antibodies may point to T ID or LADA. If a specific cause for hyperglycemia is not identified, a patient will generally then be considered to have T2D. Indeed, in practice, T2D is a diagnosis of exclusion, accounting for 80-85% of all cases of diabetes [25] as shown in Figure 1 [28]. The current categories indicate that the traditional definition of type 2 diabetes might comprise additional subtypes with distinct clinical characteristics. Clinicians have understood that patients who carry the T2D diagnosis have a variety of phenotypes and susceptibilities to diabetes-related complications. However, despite recognized heterogeneity in patient phenotypes and responses to treatment, T2D management strategies remain largely impersonalized. Therefore, a more precise characterization of T2D patient populations can improve patient management and enhance understanding of T2D [29].
2.2 Recent Studies to Dissect Heterogeneity of T2D
In an attempt to deconstruct the heterogeneity of T2D, recent studies have used machine learning techniques to perform cluster analysis of individuals using serum biomarkers and clinical data to identify T2D subgroups [26], [29]. As discussed in section 1.1.2 above, due to lack of labeled data, conventional supervised machine learning algorithms are not fit for sub-classification of complex diseases. Hence, possible solutions have been explored by the researchers in recent years, using unsupervised ML models on electronic health record (EHR) data, phenotype causes and genotype expressions for clustering and correlation analysis in order to dissect the heterogeneity of T2D. Some of these are discussed below.
A
2.2.1 Identification of type 2 diabetes subgroups through topological analysis of patient similarity - Li et aL
One of the first attempts at using large-scale data driven approach for T2D sub-group
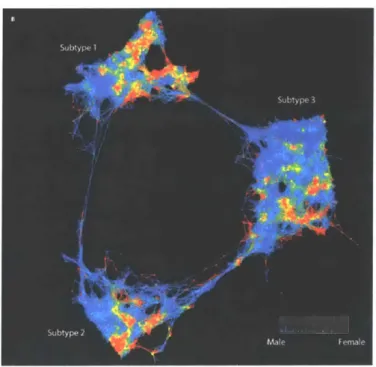
identification was made by Li and colleagues [29]. They used topology-based patient-patient network analysis and identified three sub-groups of T2D as shown in Figure 2. The study data consisted of 2551 T2D patients from Mount Sinai BioMe Biobank and used 73 clinical features including phenotype measurements, medication orders and demographic details. They also performed a genetic association analysis of the emergent T2D subtypes to identify subtype-specific genetic markers and identified 1279, 1227, and 1338 single-nucleotide polymorphisms (SNPs) that mapped to 425, 322, and 437 unique genes specific to subtypes 1, 2, and 3, respectively.
Limitations:
Limiting the translatability of the findings, however, the study did not include replication of these subgroups in another dataset, and classification of a non-study patient into one of these three groups would not be straight-forward. Also, it was argued that the genetic variants used in the analysis were all related to ancestry and hence, the clusters largely represented ethical groups.
2.2.2 Novel subgroups of adult-onset diabetes and their association with outcomes: a
data-driven cluster analysis of six variables - Ahlqvist et al.
Most recently, Ahlqvist and colleagues [26] developed a new state-of-the-art framework for characterizing adult onset diabetes based on six clinical metrics measured in Scandinavian individuals at the time of diabetes diagnosis: glutamic acid decarboxylase (GAD) antibody, age at diagnosis, body mass index (BMI), hemoglobin Al c, homeostatic model assessments of beta cell function [HOMA2-B] and insulin resistance [HOMA2-IR]. They applied K-means
and hierarchical clustering algorithms and successfully identified five reproducible subgroups of patients representing different sub-types of T2D as shown in Figure 3.
5 large Scandinavian cohorts
Discovery N=8,980
4 cohorts for replication
A 1.2% s. 234% * Typel1ditete W LADA M ype2dWmetes
Traits measured
at diabetes diagnosis
1. GAD Ab
2.
Age
3.
BMI
K-means
4. HbAlc
5.
HOMA-B
6.
HOMA-IR
Reproducible clusters
--
.
Figure 3: T2D Clustering by Ahlqvist et al.
Limitations:
One of the limitations of this study was that the six variables chosen for clustering change with disease progression and treatment, and thus application of this clustering approach to clinical practice is of uncertain utility when patients are evaluated at a different time in the disease course or after treatment has been initiated. Additionally, it is not clear whether clinical biomarkers used in cluster analyses to date are causal, consequential, or coincidental in the disease process.
Also, the classification was derived primarily with patients from northern Europe, with limited non-Scandinavian representation, and hence, the applicability of this technique to patients of other ethnicities needs to be assessed.
A general limitation of the above two researches was that it was difficult to translate an
incoming patient into a subcategory in practice.
2.2.3 Type 2 diabetes genetic loci informed by multi-trait associations point to disease
mechanisms and subtypes - Udler et al.
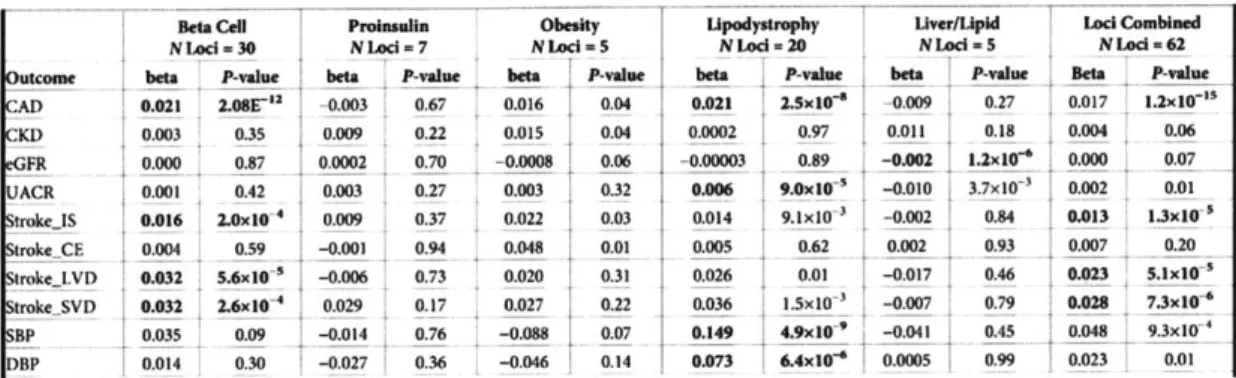
Emerging efforts have also been made in using genetics for disease subtype classification, however genetics have smaller effect size in T2D data. One example is where Udler and colleagues [30] pooled together genetic factors acting on a shared pathways to identify five different clusters. In contrast to other serum biomarkers, germline genetic variants associated with T2D are more likely to point to T2D causal mechanisms and remain constant regardless of developmental stage, disease state, or treatment.
By applying Bayesian nonnegative matrix factorization (bNMF) to cluster variant-trait
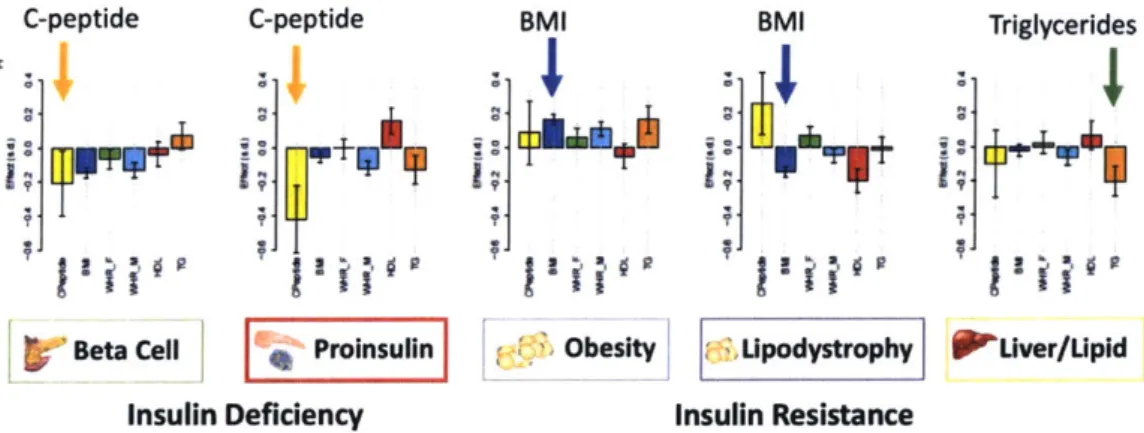
associations ascertained from publicly available genome-wide association studies (GWAS) for 94 known T2D variants and 47 diabetes-related traits, they identified five novel robust clusters of T2D loci, two related to insulin deficiency and three related to insulin resistance (Figure 4 and Table 1). They also found that in up to 17,365 individuals with T2D, about 30% of individuals had a genetic risk score (GSR) in the top decile of uniquely one cluster, and had phenotypic traits that distinguished them from others with T2D [30].
C-peptide C-peptide BMI BMI Triglycerides
Beta Cell Proinsulin Obesity Lipodystrophy Liver/Lipid
Insulin Deficiency Insulin Resistance
Beta Cell Proinsuflin Obesity Upodystrophy Uver/Upid Lod Combined
NLad-30 NLocI-7 NLcd-5 NLod-20 NLed 5 NLod -62
outcome bta P-vale beiP-aue beta .P-win_ --beta P-wine beta _ -value Bt I ____va__ ___
CAD 0.021 2.08E" -0.003 0.67 0.016 0.04 0.021 2.Sx10-e -0.009 0.27 0.017 1.2x10-"
KD 0.003 0.35 0.009 0.22 0.015 0.04 0.0002 0.97 0.011 0.18 0.004 0.06 GFR 0.000 0.87 0.0002 0.70 -0.0008 0.06 -0.00003 0.89 -0.002 1.2x10e 0.000 0.07 ACR 0.001 0.42 0.003 0.27 0.003 0.32 0.006 9.0x10 -0.010 3.7x10 0.002 0.01 troke..S 0.016 2.0x10⁴ 0.009 0.37 0.022 0.03 0.014 9.1x10- -0.002 0.84 0.013 1.3x10--trokeCE 0.004 0.59 -0.001 0.94 0.048 0.01 0.005 0.62 0.002 0.93 0.007 0.20 rokeLVD 0.032 5.6x10 -0.006 0.73 0.020 0.31 0.026 0.01 -0.017 0.46 0.023 5.1x10' tr0.17105027-3 _0.007__ trokeSVD 0.032 2.6x04 0.029 -0.17 0.027 0.22 0.036 1.5x10 3 -0.007 0.79 0.028 7.3x10 BP 0.035 0.09 -0.014 0.76 -0.088 0.07 0.149 4.9x10~- -0.041 0.45 0.048 93xI0 DBP 0.014 0.30 -0.027 0.36 -0.046 0.14 0.073 6.4x10' 0.0005 0.99 0.023 0.01
Table 1: Associations of cluster genetic risk scores & clinical outcomes
from
GWAS [30/Limitations:
Limitations of this study include that the genetic variants used in the cluster analysis were
restricted to those associated with T2D in populations of European ancestry.
2.3 Research Approach in Context
The above studies demonstrate exciting progress in deconstructing disease heterogeneity for T2D sub-classification. While these studies offer exciting directions for future research, they are also limited (as discussed in section 2.2) by the nature of the variables included in analyses and translation into practice. Additional limitations include ethnicity of the study population, replication of findings, type of phenotype measurements which change over the disease progression.
Our research aims to address these issues where we plan to:
1. First test the concept of T2D disease clustering using freely available MIMIC III database.
2. Next, enhance and improve the clustering model using data from Partner's Biobank [4] [5]. Replicate the results using UK Bio-Bank data [13], [14].
3. Look at multiple phenotype factors taken across a bigger time interval and not just restrict
to the measurements at the time of diagnosis.
4. Future goal would be to develop predictive analytic models to predict the diabetes sub-type of incoming patients, disease progression and response to medication.
Specifically, this thesis will focus on initial clustering analysis and experimentation using
3 Experimentation
This chapter discusses in detail the clustering experiment as a first attempt to identify the sub-types of T2D patients. It includes the details about the database (MIMIC III in this case) used, description of the machine learning techniques used for clustering and dimension reduction, data preparation and aggregation, different variations of the clustering experiment, and the results from those experiments.
3.1 MIMIC III Database
As mentioned in section 1.3, the MIT owned MIMIC III database was chosen as the data source for the first iteration of the clustering experiment due to its ease of data accessibility and management. MIMIC is a large, freely-available database comprising deidentified health-related data associated with patients who stayed in critical care units of the Beth Israel Deaconess Medical Center [10].
MIMIC supports a diverse range of analytic studies spanning epidemiology, clinical decision-rule improvement, and electronic tool development. It is notable for the following factors:
* It is freely available to researchers worldwide
* The latest version of MIMIC - MIMIC-III vl.4, comprises over 58,000 hospital
admissions for 46,520 patients (38,645 adults and 7,875 neonates)
" The data spans June 2001 -October 2012 and includes information such as: o demographics,
o vital sign measurements, o laboratory test results, o procedures,
o medications,
o imaging reports, and
o bedside monitor trends and waveforms.
Data Accessibility and Management
The database, although de-identified, still contains detailed information regarding the clinical care of patients, so must be treated with appropriate care and respect. Researchers seeking to use the database must formally request access using the steps as outlined below [31].
* Complete the required training course "Data or Specimens Only Research" from Collaborative Institutional Training Initiative (CITI) program.
" Create an account on PhysioNet [31] and follow the instructions on there to apply for access
to the MIMIC-III project.
* You can download the database once your application has been approved.
Once you have the access, you can download the MIMIC III database [32] which is provided as a collection of comma-separated (CSV) files, along with scripts to help users import the data into popular database systems. One can either use the CSV files directly for data analysis or install the database locally in a database management system. MIMIC III is basically a relational database with 26 well-structured tables encompassing approximately 47 GB of data. Table 2 below gives a brief description of the various tables in MIMIC. Scripts for installing the database in Postgres, MySQL, and Oracle are available in the MIMIC code repository [33].
All experimentation in this thesis was performed using CSV format of the MIMIC III dataset
with R as the programming language.
The following tables are used to define and track patient stays: ADMISSIONS Every unique hospitalization for each patient in the database
CALLOUT information regarding when a patient was cleared for ICU discharge and when the patient was actually discharged
ICUSTAYS Every unique iCU stay In the database
PATIENTS Every unique patient in the database
SERVICES The clinical service under which a patient is registered
TRANSFERS Patient movement from bed to bed within the hospital, including ICU admission and discharge The following tables contain data colected in the critical care unit:
CAREGIVERS Every caregiver who has recorded data in the database
CHARTEVENTS All charted observations for patients
DATETIMEEVENTS All recorded observations which are dates, for example time of dialysis or insertion of lines.
INPUTEVENTSCV Intake for patients monitored using the Philips CareVue system while in the ICU
INPUTEVENTSMV Intake for patients monitored using the iMDSoft Metavison system while in the ICU
NOTEEVENTS Dedentifiled notes, including nursing and physii n notes, ECG reports, imaging reports, and discharge summaries.
OUTPUTEVENTS Output information for patients while in the ICU
PROCEDUREEVENTSMV Patient procedures for the subset of patients who were monitored in the ICU using the IMDSoft MetaVison system.
The following tables contain dati conected In the hospital record system:
CPTEVENTS Procedures recorded as Current Procedural Terminology (CPT) codes
LABEVENTS Contains all laboratory measurements for a given patient, Including out patient data.
DIAGNOSESICD ospital assigned diagnoses, coded using International Statistical Classification of Diseases (ICD) system
DRGCODES Diagnosis Related Groups (DRG), which are used by the hospital for billing purposes. MICROBIOLOGYEVENTS Microbiology measurements and sensitivities from the hospital database PRESCRIPTIONS Medications ordered, and not necessarily administered, for a given patient
PROCEDURES_!CD Patient procedures, coded using the International Statistical Classification of Diseases (ICD) system The following tables contain dkctionarles:
D CPT High-level dictionary of Current Procedural Terminology (CPT) codes
D ICD DIAGNOSES Dictionary of International Statistical Classification of Diseases (ICD) codes relating to diagnoses
DJCD PROCEDURES Dictionary of International Statistical Classification of Diseases (ICD) codes relating to procedures
DITEMS Dictionary of ITEMIDs appearing in the MIMIC database, except those that relate to laboratory tests
DLABITEMS Dictionary of ITEMIDs in the laboratory database that relate to laboratory tests
3.2 Data Analytics and Machine Learning Techniques
As discussed in section 1.3, since the driver and dependent variables are not well classified, 'cluster analysis' was chosen as the machine learning strategy for T2D sub-classification. In particular K-means (as discussed in next section 3.2.1) clustering algorithm was used to identify the sub-groups of T2D patients. Two separate iterations of K-means clustering were
implemented - (1) Without dimension reduction, and (2) With dimension reduction using PCA.
Below is a brief overview of the various data analytics and machine learning techniques used in the clustering experiment.
3.2.1 Clustering Algorithm
An unsupervised machine learning approach that utilizes clustering (K-means) was used to identify sub-groups of T2D patients based on the phenotype measurements and evaluate the utility of those sub-groups in T2D stratification. Clustering involves the task of dividing the population or data points into a number of groups such that data points in the same groups are more similar to each other as compared to those in other groups. In simple words, the aim is to segregate groups with similar traits and assign them into clusters [15]. In other words, the goal for unsupervised learning is to model the underlying structure or distribution in the data in order to learn more about the data. Clustering includes varying algorithms that differ significantly, such as identifying groups by small distances between cluster members, by dense areas of the data space, by intervals or particular statistical distribution. Some of the popularly known clustering methods are K-means, Hierarchical, b-NMF, Gaussian Mixture models. Hua Xu covered detailed description of different clustering techniques in his thesis [4].
K-means Clusterin!
K-means is a widely used partitioning clustering algorithm [34]. It stores k centroids that it uses to define clusters, one centroid for each cluster. Initially the centroids are randomly placed.
A point is considered to be in a particular cluster if it is closer to that cluster's centroid than any
other centroid. K-means finds the best centroids by alternating between (1) assigning data points to clusters based on the current centroids (2) choosing centroids (points which are the center of a cluster) based on the current assignment of data points to clusters [35]. This process is repeated and as a result centroid change their location in each iteration until their locations converge. In other words, the centroids do not move anymore.
The distance is calculated using the following objective function and the aim of the algorithm
is to minimize this function: J = I 1 x - c 2 where n is the number of data points
within cluster
j
E {1,..., K}, and cj is the centroid of cluster j.Selecting the number of clusters is an important step in this process and will be discussed later in this chapter.
3.2.2 Dimension Reduction Technique
As stated before, PCA was used for clustering iteration using dimension reduction. Dimension Reduction is the technique of converting high-dimensional data into lower-dimensions without any loss of information. This technique is typically used to obtain features of high importance and independence. Dimension reduction is especially meaningful for clinical data where features tend to have a high degree of non-linearity and are difficult to visualize. Common
dimension reduction models include Principle Component Analysis (PCA), Linear
Discriminant Analysis (LDA), t-Distributed Stochastic Neighbor Embedding (t-SNE), Singular-value Decomposition (SVD) and Autoencoder.
Principal Component Analysis (PCA)
PCA is a well-known technique in dimension reduction [36], [37]. PCA is a statistical procedure that uses an orthogonal transformation to convert a set of observations of possibly
correlated variables (entities each of which takes on various numerical values) into a set of values of linearly uncorrelated variables called principal components [38] without the loss of information. Each principal component is a linear combination of the original variables. Principal components are extracted in such a way that the first principal component explains maximum variance in the dataset and each succeeding component in turn has the highest variance possible under the constraint that it is orthogonal to the preceding components. The resulting principal components are an uncorrelated to each other.
PCA works by finding the top k eigen vectors from originally n (n >k) dimensional data space
thus to transform the data into k dimensions. PCA is often used prior to running a clustering ML algorithm on the data [4].
3.2.3 Statistical Analysis Technique for the Clusters
Various statistical techniques exist to compare distributions across multiple groups in order to test if significant differences exist among them. One-way analysis of variance (ANOVA), also known as one-factor ANOVA [13] [14], is an extension of independent two-samples t-test [39] for comparing means in a situation where there are more than two groups for comparison. Since clustering experiments in this research resulted in more than two clusters/sub-groups, therefore,
ANOVA was used to compare the results for subjects (patients) across different clusters.
3.2.4 Programming Language and Environment
R studio was used as the IDE (Integrated Development Environment) and all computations were done using R programming language version 3.4.2.
3.2.5 Summary of Experiment Design Options
Table 3 below shows different options for clustering, dimension reduction, programming languages, database and environment selection. Highlighted in blue are the selections used for experiments in this thesis. This table can act as a guiding framework for future researchers for different experiment design options.
Custering Algorithm K-means Hierarchical JbNMF Gaussian Mixture Model
Dimeslon Reduction PCA LDA t-SNE SVD
Programmig Language R Python Scala
Notebook IDE R-Studio Jupyter Notebooks IDatabricks MiMIC Database Format JCSV Postgres
JMySQL
OracleTable 3: Experiment Design Selection
3.3 Clustering: Data Analysis and Exploration
An overview of MIMIC III tables was discussed in the section 3.1. This section explores some specific tables that were used for the experiment in details. Below is a brief description of these tables and Figure 5 below shows the key-fields that relate these tables and the type of relationship. For e.g., 'PATIENTS' table has one row for each unique patient (SUBJECTID being the primary key in this table) and each patient in the 'PATIENTS' table can have one or more rows in the 'ADMISSIONS' table, depending upon the number of times she/he was
admitted in the hospital. These two tables are linked through the 'SUBJECTID' field, shown
by the 1:many relationship in the diagram below (Figure 5).
row-ki subjectid gender dob dod dod hosp dod_ssn expire fai 46,520 rows 19 > 1: many subject id
1:many <3 651,047 rows 1: many
subject-ld hadmId
bmany
subject-id < 3 27,a54,055 roms|
Figure 5: MIMIC Tables relationship mapping
" ADMISSIONS: Contains every unique hospital admission for each patient. Column
HADMID identifies each admission for a given patient. This table has a total of 58796 rows and also, includes demographic details of the patient such as 'ethnicity', 'religion', 'marital status', etc. It links to PATIENTS table on SUBJECTID and each patient can
have more than one entry (HADMID) in the ADMISSIONS table.
* PATIENTS: Each row in the table represents a unique patient in the database and it
has total of 46520 patients. Links to ADMISSION table on SUBJECTID. Includes
information such as 'gender', 'date of birth', 'date of death' (if applicable) of the patient.
* DIAGNOSESICD: This table contains hospital assigned diagnoses codes. One patient can have more than one diagnoses for each hospital admission. Links to PATIENTS on SUBJECTID, and ADMISSIONS on HADM_ID. This table contains
651047 rows with diagnoses codes for all the patients.
* LABEVENTS: Contains all laboratory measurements for each patient including
out-patient data. Links to PATIENTS on SUBJECTID, and ADMISSIONS on
HADMID. Has approximately 28M rows, which encompass 726 unique lab measurements for different patients.
Note: The LABEVENTS table contains both in-hospital laboratory measurements and out of hospital laboratory measurements from clinics which the patient has visited (since the patient is not "in" a hospital when visiting a clinic, these patients often referred to as "outpatients " and the data is often called "outpatient" data). Laboratory
measurements for outpatients do not have a HADMID.
hadm id admkime dmeen dW*k" admisino ioe dwuhawgejoctio, inauuro ma -status edo~hm dign ir hospiWa_-xplre~jfta has-chwart nsdata < 1 158,976 rows 118
-* DICDDIAGNOSES: Dictionary of International Classification of Diseases (ICD)
codes relating to diagnoses. Links to DIAGNOSESICD on ICD9_CODE and has a list of total 14567 ICD codes.
* DLABITEMS: Dictionary of the ITEMIDs in the laboratory database that relate to
the laboratory tests. Has a list of total 753 lab items and links to LABEVENTS on
ITEMID.
3.4 Clustering: Data Preparation
and Aggregation
The goal of the experiment was to perform clustering on T2D patients based on their lab measurements to be able to find sub-groups of T2D patients. A series of data filtration and aggregation steps were performed to prepare the data for the clustering experiment as shown in Figure 6. These steps are further discussed in detail below.
* Each row represents
46250 patients 9478 patients 4148 patients 2105 patients unique patient
726 Lab Measurements -3M Observations 602 Lab Measurements 27 Lab Measurements . Each Column represents
-28M Observations -1M Observations unique lab measurement /
phenotype
* Each call represents the mean value of all observations of that lab measurement of a patient
LablSu b LAID 2 ... LabID27
Subject Id 1 3&.=0 14.33M
Subject Id 2 59.0000 15.3333
Subject Id 2105
Figure 6: Data Preparation and Aggregation Process
The final output of this process was a matrix of T2D patients where:
* Each row represents a unique patient.
* Each column represents a unique lab measurement.
* Each cell contains the mean value of a particular lab measurement (column) for that patient
(row). The mean was calculated by taking an average from all the observations available of that lab measurement for that particular patient.
3.4.1 Detailed Steps
1. The first step was to filter T2D patients from the complete patient data. This was done by
finding the subsets of patients having T2D ICD-9 codes in the DIAGNOSESICD table.
Appendix B provides a list of the ICD-9 codes for T2D. This step resulted in a subset of 9478 patients identified with T2D.
2. Next step involved filtering the lab measurements (from LABEVENTS table) for T2D patients as identified in step 1. This resulted in 8M observations. A summary of the dataset
for T2D lab measurements is shown in Figure 7 below.
Ssimary(EventsT2O)
R=3-D 5t&JECT.10 MAWLI.D
Min. : 6046 Min. : 13 Min. :109009
lst Qu.: 7339548 1st Qu.:11795 st Qu.:124911
Median :14265669 Median :22936 Median :149271 Mean :14147044 Nean :31691 Mean :149618 3rd Qu.:2005432 3rd Qu.:47731 3rd Qu.:174140 Max. :27967649 Max. :99999 Max. :19916
MA's :1746626 VALUEUGM FLAG W/dL :1610839 :5619715 nq/L :15726 abnormal:298679 % :1998617 delta : 16457 :823225 K/uL :446659 g/d :293633 (Other):2174582 I9420 CMTTINE Min. :50000 216346-13 65:64:40: 127 1st Qiu.:5682 2178-49-15 03:59:00: 106 Median :56963 2178-16-26 16:42:66: 16" Mean :51163 2155-46-13 16:36:00: 12 3rd Qu.:51256 2169-16-16 07:58:0: 112 Max. :51555 2179-0-10 04:20:90: 101 (Other) :8014267
Figure 7: Summary of lab-events for all T2D patients
3. Since all the patients in the MIMIC III database are from critical care unit, only the
out-patient lab measurements were used for the clustering analysis in-order to remove the confounding effects of the other serious ailments due to which these patients might have been admitted to the hospital critical care unit. Hence, from all the lab measurements in step 2, only the subset of out-patient lab measurements for T2D was considered (where,
HADMID = NA).
4. This filtering step resulted in a subset of 1749620 lab observations (602 different types of lab measurements) for 4148 T2D patients. Figure 8 below shows a summary of the out-patient lab events dataset for T2D out-patients.
3 summary(lablventsT2Out)
NW-10 SIBJECT.D Min. : 7261 Min. : 13 Ist Qu.: 5861160 15t Qu.: 9356
Median :1147861S Median :18559 Mean :11765972 Mean :22968 3rd Qu. :16865764 3rd Qu.:27244 Max. :27904361 Max. :99957 VALUE18M FLAG mg/dL :371229 :1161773 Eq/L :285474 abnormal: 580278 5 :273816 delta : 756 :193751 K/uL :1108617 1U/L : 13284 (Other):427249 HA1L10 Min. : M Ist QW.: NA Median : MA Mean :N 3rd Qu.: MA Max. : NM %As :1749626
ITEM1 C11M32 VALUE VALUENUUJ
Min. :50000 2102-18-28 11:36:60: 186 NEG : 71374 Min. : -33
1st Qu.:56917 2138-6-36 12:36:00: 95 6 : 26492 lst Qu.: 4 Median :51146 2176-12-36 14:55:66: 91 MOLD :166 Median : 1
Mean :51119 2114-46-26 11:56:46: 96 NOIL : 15183 Mean : 78
3rd Qu.:51265 21384-2-89 0:00:0: a5 1+ : 13267 3rd Qu.: 61
Max. :51555 2138-42-16 0:0:6: I5 See Comments: 12292 Mx. :214~666 (Other) :1749674 (Other) :1661632 MA's :235M38
Figure 8: Summary of outpatient lab-events for T2D patients
VALM MEG :187171 0 :186753 ART :94853 25 :426 26 :4418 24 : 43626 (Other):7497512 VALUENUE Min. : -413 1st Qu.: 4 Median : 19 Mean : 73 3rd Qa.: 63 Max. :512010 MA's :78178

![Table 2 below gives a brief description of the various tables in MIMIC. Scripts for installing the database in Postgres, MySQL, and Oracle are available in the MIMIC code repository [33].](https://thumb-eu.123doks.com/thumbv2/123doknet/14670832.556789/27.917.143.766.535.1014/description-various-scripts-installing-database-postgres-available-repository.webp)