HAL Id: hal-01189777
https://hal.archives-ouvertes.fr/hal-01189777
Submitted on 1 Sep 2015
HAL is a multi-disciplinary open access
archive for the deposit and dissemination of
sci-entific research documents, whether they are
pub-lished or not. The documents may come from
teaching and research institutions in France or
abroad, or from public or private research centers.
L’archive ouverte pluridisciplinaire HAL, est
destinée au dépôt et à la diffusion de documents
scientifiques de niveau recherche, publiés ou non,
émanant des établissements d’enseignement et de
recherche français ou étrangers, des laboratoires
publics ou privés.
wasps (Chalcidoidea: Pteromalidae)
Astrid Cruaud, Jenny G. Underhill, Maïlis Huguin, Guénaëlle Genson, Roula
Zahab, Krystal A. Tolley, Jean Yves Rasplus, Simon van Noort
To cite this version:
Astrid Cruaud, Jenny G. Underhill, Maïlis Huguin, Guénaëlle Genson, Roula Zahab, et al.. A
multi-locus phylogeny of the world sycoecinae fig wasps (Chalcidoidea: Pteromalidae). PLoS ONE, Public
Library of Science, 2013, 8 (11), �10.1371/journal.pone.0079291�. �hal-01189777�
Wasps (Chalcidoidea: Pteromalidae)
Astrid Cruaud
1*☯, Jenny G. Underhill
2☯, Maïlis Huguin
1, Gwenaëlle Genson
1, Roula Jabbour-Zahab
1,
Krystal A. Tolley
2,4, Jean-Yves Rasplus
1, Simon van Noort
3,41 INRA, UMR1062 CBGP Centre de Biologie pour la Gestion des Populations, Montferrier-sur-Lez, France, 2 South African National Biodiversity Institute, Kirstenbosch Research Centre, Cape Town, South Africa, 3 Natural History Division, South African Museum, Iziko Museums of Cape Town, Cape Town, South Africa, 4 Department of Zoology, University of Cape Town, Rondebosch, South Africa
Abstract
The Sycoecinae is one of five chalcid subfamilies of fig wasps that are mostly dependent on Ficus inflorescences for reproduction. Here, we analysed two mitochondrial (COI, Cytb) and four nuclear genes (ITS2, EF-1α, RpL27a, mago
nashi) from a worldwide sample of 56 sycoecine species. Various alignment and partitioning strategies were used to
test the stability of major clades. All topologies estimated using maximum likelihood and Bayesian methods were similar and well resolved but did not support the existing classification. A high degree of morphological convergence was highlighted and several species appeared best described as species complexes. We therefore proposed a new classification for the subfamily. Our analyses revealed several cases of probable speciation on the same host trees (up to 8 closely related species on one single tree of F. sumatrana), which raises the question of how resource partitioning occurs to avoid competitive exclusion. Comparisons of our results with fig phylogenies showed that, despite sycoecines being internally ovipositing wasps host-switches are common incidents in their evolutionary history. Finally, by studying the evolutionary properties of the markers we used and profiling their phylogenetic informativeness, we predicted their utility for resolving phylogenetic relationships of Chalcidoidea at various taxonomic levels.
Citation: Cruaud A, Underhill JG, Huguin M, Genson G, Jabbour-Zahab R, et al. (2013) A Multilocus Phylogeny of the World Sycoecinae Fig Wasps (Chalcidoidea: Pteromalidae). PLoS ONE 8(11): e79291. doi:10.1371/journal.pone.0079291
Editor: Diego Fontaneto, Consiglio Nazionale delle Ricerche (CNR), Italy
Received December 10, 2012; Accepted September 22, 2013; Published November 5, 2013
Copyright: © 2013 Cruaud et al. This is an open-access article distributed under the terms of the Creative Commons Attribution License, which permits unrestricted use, distribution, and reproduction in any medium, provided the original author and source are credited.
Funding: This work is based upon financial support received from the South African National Research Foundation grant GUN 61497 to SvN and from the French National Research Agency (ANR) grant that supports the “BioFigs” project. This research was also supported by the South African National Biodiversity Institute. Sequencing was supported by the network Bibliothèque du Vivant founded by the CNRS, the Museum National d’Histoire Naturelle, the INRA and the CEA (Génoscope). The funders had no role in study design, data collection and analysis, decision to publish, or preparation of the manuscript.
Competing interests: The authors have declared that no competing interests exist. * E-mail: cruaud@supagro.inra.fr
☯ These authors contributed equally to this work.
Introduction
Fig trees (Ficus, Moraceae) and their pollinating fig wasps (Agaonidae, Chalcidoidea, Hymenoptera) present a specialized case of an obligate pollination mutualism [1]. Each Ficus species is reliant on agaonid fig wasps for pollination and, in return, the pollinating fig wasp depends on its host Ficus for reproduction and larval development [2,3]. The fig - pollinator association is exploited by several other lineages of Chalcidoidea, a few Braconidae (Ichneumonoidea) and up to 30 fig wasp species can be associated with a single Ficus host [4,5]. Among these wasp lineages are the Sycoecinae (Chalcidoidea), a group that does not belong to Agaonidae as previously stated [6], but is clearly a member of the Pteromalidae sensu stricto [7–10].
In contrast to most other wasp lineages associated with figs, all the Sycoecinae are internal ovipositors. Sycoecines, which do not show any pollination behaviour, cannot pollinate actively pollinated Ficus species [11]. In passively pollinated Ficus species, large quantities of pollen are released by anther dehiscence so that all the emerging wasps become covered with pollen [12]. Therefore, sycoecines (Diaziella) associated with passively pollinated fig trees (Conosycea stranglers) are efficient pollinators [13].
Convergent evolution is believed to account for the morphological similarity between the sycoecines and pollinating fig wasps both being exposed to identical selection pressures due to the constraints of internal oviposition [14]. These morphological adaptations, such as smooth, elongated and dorso-ventrally flattened head and thorax, and the presence of tibial and mandibular modifications, enable both pollinators and
sycoecines to crawl through tightly appressed bracts surrounding the ostiole to enter the fig cavity.
Presently, the Sycoecinae comprises six genera and 72 described species. The current taxonomy is based on morphological delimitation [15–19] but no molecular phylogenetic analysis has been attempted so far. Therefore our understanding of sycoecine evolutionary relationships is wanting. Diagnostic characters for the six sycoecine genera are provided in Table 1, for identification keys and detailed taxonomy, the reader is directed to the website www.figweb.org [20]. Four sycoecine genera, Crossogaster Mayr (16 described species), Philocaenus Grandi (24), Sycoecus Waterston (10) and Seres Waterston (4), are restricted to the Afrotropical region and are associated with Ficus section Galoglychia (Table 1, detailed distribution available at www.figweb.org, [20]. The genus Diaziella Grandi (14 described species) occurs in the Oriental region and is associated with Ficus section
Urostigma, subsection Conosycea [21–23]. Finally, the New
Guinean genus Robertsia Bouček (4 described species) is associated with Ficus section Stilpnophyllum, subsection
Malvanthera (Table 1) [6,24]. Extrapolating from our sampling
of several hundred species of Ficus the total diversity of the Sycoecinae could reach 190 species worldwide. The subfamily is better known from the Afrotropical region (where an
estimated 63% of the species are described) than the Oriental and Indo-Australasian regions where only an estimated 10% of the species are described [20]. Consequently, and despite that the Sycoecinae is one of the better-known fig wasp subfamilies, overall more than 65 % of the species await description.
How fig wasp communities have been structured over space and time is a fascinating question that remains to be answered [1]. However, before addressing issues such as “how can we explain species coexistence in these closed communities?”, “do the partners have the same biogeographical history?” and “do we observe cophylogenetic patterns between partners?”, we first need robust phylogenies validated by expert taxonomists for all the involved fig-wasp lineages.
In this paper we employ multiple genetic loci, extensive taxon sampling of both described and undescribed species and several different analytical approaches to 1) evaluate the monophyly of the sycoecine genera, 2) provide a first comprehensive phylogenetic hypothesis for the subfamily, 3) propose a new classification and 4) discuss the phylogenetic relationships in light of the host fig tree relationships.
On a more general note, we were interested in testing a combination of frequently used and recently developed markers to resolve the phylogenetic relationships of chalcidoid
Table 1. Type species, diversity, distribution, host fig tree groups and diagnostic characters for the six previously defined
genera of Sycoecinae.
Genera Type species
Species
described Distribution
Host Ficus SUBGENUS/
section/subsection Diagnosis
Crossogaster Mayr,
1885 C. triformis Mayr, 1885 16 Afrotropical
Urostigma Galoglychia
Platyphyllae, Chlamydodorae, Crassicostae, Caulocarpae
Both sexes with one labial palp segment and two maxillary palp segments; the female eighth urotergite spiracular peritremata distinctly expanded; the male inner apical mandibular tooth is subequal (but still longer) to much longer than the outer tooth [17]
Diaziella Grandi,
1928 D. bicolor Grandi, 1928 14 Oriental
Urostigma Urostigma
Conosycea
Four-segmented fore tarsi; a laminar projection present on the proximal fore tarsal segment; a pronounced hypopygium that may extend well beyond the end of the metasoma; an ovipositor usually long (about the length of the metasoma) sometimes shorter [22].
Philocaenus
Grandi, 1952 P. barbatus Grandi, 1952 24 Afrotropical
Urostigma Galoglychia
Galoglychia, Platyphyllae, Chlamydodorae, Caulocarpae
Females with two anelli and four funicle segments; gastral tergites with a crenulated posterior edge; ventral tentorial pits in close apposition; eighth urotergite spiracle not expanded. Males have the outer mandibular tooth longer than the inner, without any ventral teeth present [18,19].
Robertsia Bouček, 1988 R. mandibularis Bouček, 1988 4 New Guinean Urostigma Stilpnophyllum Malvanthera
No antennal scrobe; clypeal sutures not defined; medial carina present between the toruli; tarsi five-segmented; hypopygium not extending beyond end of metasoma; ovipositor short, usually not discernable [24]. Seres Waterston, 1919 S. armipes Waterston, 1919 4 Afrotropical Urostigma Galoglychia Caulocarpae
Propodeal spiracles medially positioned with a plica extending from the internal edge of the spiracle to the posterior margin of the propodeum, which may sometimes be indistinct [15]. Sycoecus Waterston, 1914 S. thaumastocnema Waterston, 1914 10 Afrotropical Urostigma Galoglychia Cyathistipulae
Fore tibial spur modified into a plate of many fine teeth; first funicle segment with axial expansion; propleura excavated; pronotum with distinct lateral depressions [16].
Classification of the genus Ficus follows Berg and Corner [93]. doi: 10.1371/journal.pone.0079291.t001
lineages at various taxonomic levels. Chalcidoidea have tremendous importance in both natural and managed ecosystems. Several species are for example used as biological control agents of agricultural and ornamental pests [25]. However, our understanding of how many of these lineages are monophyletic and what are their phylogenetic relationships is clearly wanting [9,10]. Although genes should be selected to match the time period of the phylogenetic problem at hand [26,27], the most commonly used markers remain 28S and 18S ribosomal genes, Cytochrome oxidase I (COI) and Cytochrome b (Cytb), whatever the taxonomic level studied (e.g. [9,28–33]). While ribosomal genes often evolve too slowly to resolve relationships in rapidly diversifying lineages, mitochondrial genes become saturated over larger time scales and are poor estimators of a phylogeny at high taxonomic level [26,34]. By studying the evolutionary properties of the markers we sequenced, profiling their phylogenetic informativeness (sensu Townsend [27]) under different alignment procedures, and comparing inferred topologies, we predict their utility for phylogenetic inference at shallower and deeper taxonomic levels.
Materials and Methods
1. Taxonomic sampling
Species identification was based on morphological characteristics according to the current literature and was conducted by SvN and JYR. Morphological observations were performed on 10 to 20 representatives of each species. A total of 81 sycoecine specimens representing all the known genera and 56 species, of which 50% are undescribed, were included in the molecular study (Table 2). Seventy percent of the species were represented by sequences from one specimen only. The type-species of the genera Seres (S. armipes) and
Philocaenus (P. barbarus) were also included in our analyses.
All necessary permits were obtained for the collection of specimens in nature reserves and national parks (Ministère des Eaux et Forêts et du Reboisement, Libreville, Gabon permit granted by Emile Mamfoumbi Kombila, Directeur de la Faune et de la Chasse; Uganda Wildlife Authority UWA/TDO/33/02; UNCST NS 214; Namibia Ministry of Environment and Tourism permit 1289/2008; Ezemvelo KZN Wildlife permits 2985/1999; 24139/2000; 29820/2002; 4502/2005; 4345/2005; 4346/2005;1958/2007; Kenyan Wildlife Service KWS/RP/5001; Cape Nature permits 288/1999; AAA004-00092-0035; AAA007-00324-0035; Northern Cape Province permits Fauna 131/2010, Fauna 132/2010; Eastern Cape Province permits CRO 101/11CR and CRO 102/11CR; Permits for field work in Borneo were obtained from the Sarawak Forestry Corporation and the Forest Research Institute Malaysia; Permits for specimen collection in China were obtained from the Chinese Natural Science Foundation (30670358, 30571507), KSCX2-YW-Z-003; Permits for the collection of specimen in Sulawesi were obtained from the Research Center for Biology LIPI (No : 3180/SU.3/KS/2007); Specimen collection in Taiwan was funded by the ANR project BioFigs/National Science Council, Taiwan, R. O. C. code: 98WFA0100291). Wasps were collected by sampling figs containing either adults or
developing wasp larvae. The figs, containing wasps no more than a few days short of their emergence, were placed in handmade wasp-rearing chambers. Once emerged, adult wasps were killed and preserved in 95% ethanol. While the relationships between the chalcidoid subfamilies remain controversial, closer and more distant relatives were included as outgroups [9,10,35]. Six species belonging to the genera
Haltichella (Haltichellinae, Chalcididae), Bruchophagus
(Eurytominae, Eurytomidae), Grandiana (Otitesellinae, Pteromalidae), Micranisa (Otitesellinae, Pteromalidae),
Walkerella (Otitesellinae, Pteromalidae), and Megastigmus
(Megastigminae, Torymidae) were used (Table 2). Each time destructive extraction was used, vouchers were selected among specimens sampled from the same fig tree and the same fig after careful identification. Vouchers are deposited at CBGP, Montferrier-sur-Lez, France and Iziko South African Museum, Cape Town (SAMC). A high definition image library of vouchers was also constructed, using the EntoVision Premium Portable Imaging System, to allow future identification of specific taxa and traceability of our results (see Figure 1 for examples).
2. Marker choice, DNA extraction, PCR amplification and sequencing
We selected markers that retain phylogenetic signal within deeper nodes as well as within terminal clades. We combined two mitochondrial protein-coding genes (Cytochrome oxydase I, COI and Cytochrome b, Cytb) and four nuclear genes (the F2 copy of elongation factor-1a, EF-1α; the internal transcribed spacer 2, ITS2; the ribosomal protein RpL27a and the regulatory protein mago nashi).
mtDNA loci and ITS2 have proven useful in resolving insect molecular phylogenies at shallower taxonomic levels. However, they are rapidly evolving, which make them poor markers for deep divergences [26,34]. EF-1α has been successfully used to resolve within-family relationships (e.g. [36–39]). While the exonic portions of RpL27a have proven informative for resolving deep-level relationships within the Hymenoptera [40], its intronic portions have been successfully used to reconstruct the phylogeography of parasitoids of oak galls (Pteromalidae, [41,42]. To our knowledge, mago nashi which encodes for a transcription factor that plays essential roles in Drosophila axis formation [43] has never been included in studies of insect molecular phylogeny.
Genomic fig wasp DNA was isolated using standard phenol– chloroform extraction and Qiagen DNeasy or ZyGEM extraction kits following standard protocols. Primer sequences and amplification protocols followed Cruaud et al. [44] for Cytb and
COI, Cruaud et al. [45] for EF-1α , Lopez-Vaamonde et al. [46]
for ITS2 and Lohse et al. [41] for RpL27a and mago nashi. PCR products were purified using ExonucleaseI and Phosphatase, and sequenced directly using the BigDyeTerminator V3.1 kit (Applied Biosystems) and an ABI3730XL sequencer at Genoscope, Evry, France. Both strands for each overlapping fragment were assembled using the sequence editing software Geneious v5.5 [47]. All the sequences were deposited in GenBank (Table S1).
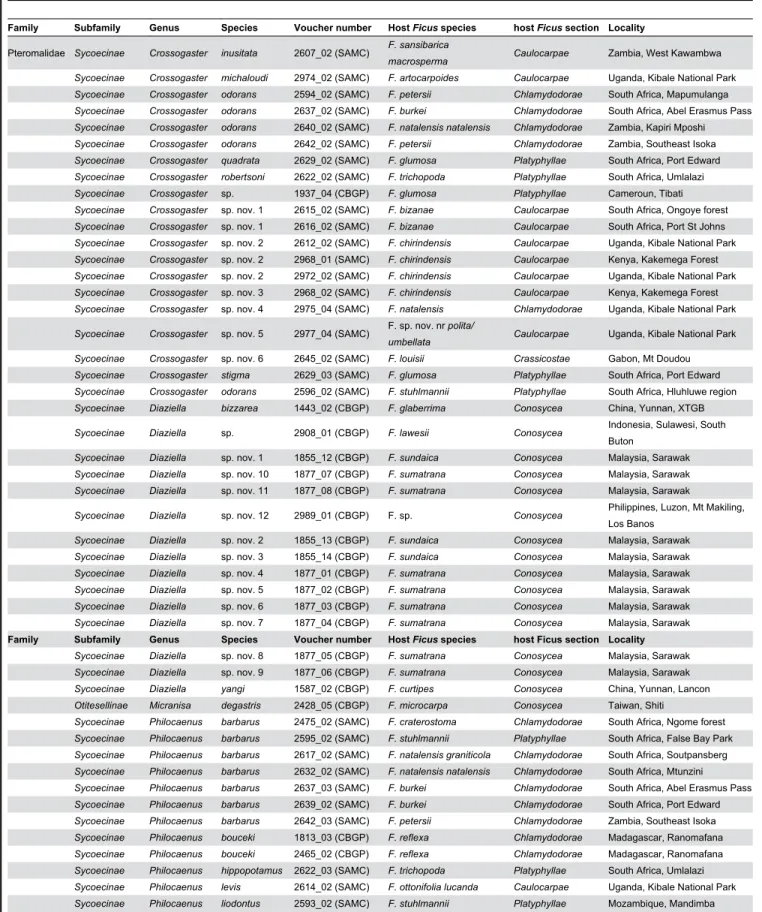
Table 2. List of Sycoecinae and outgroup species included in this study: voucher numbers and depository, taxonomic
information, host Ficus species and locality data.
Family Subfamily Genus Species Voucher number Host Ficus species host Ficus section Locality
Pteromalidae Sycoecinae Crossogaster inusitata 2607_02 (SAMC) F. sansibarica
macrosperma Caulocarpae Zambia, West Kawambwa Sycoecinae Crossogaster michaloudi 2974_02 (SAMC) F. artocarpoides Caulocarpae Uganda, Kibale National Park Sycoecinae Crossogaster odorans 2594_02 (SAMC) F. petersii Chlamydodorae South Africa, Mapumulanga Sycoecinae Crossogaster odorans 2637_02 (SAMC) F. burkei Chlamydodorae South Africa, Abel Erasmus Pass Sycoecinae Crossogaster odorans 2640_02 (SAMC) F. natalensis natalensis Chlamydodorae Zambia, Kapiri Mposhi Sycoecinae Crossogaster odorans 2642_02 (SAMC) F. petersii Chlamydodorae Zambia, Southeast Isoka Sycoecinae Crossogaster quadrata 2629_02 (SAMC) F. glumosa Platyphyllae South Africa, Port Edward Sycoecinae Crossogaster robertsoni 2622_02 (SAMC) F. trichopoda Platyphyllae South Africa, Umlalazi Sycoecinae Crossogaster sp. 1937_04 (CBGP) F. glumosa Platyphyllae Cameroun, Tibati Sycoecinae Crossogaster sp. nov. 1 2615_02 (SAMC) F. bizanae Caulocarpae South Africa, Ongoye forest Sycoecinae Crossogaster sp. nov. 1 2616_02 (SAMC) F. bizanae Caulocarpae South Africa, Port St Johns Sycoecinae Crossogaster sp. nov. 2 2612_02 (SAMC) F. chirindensis Caulocarpae Uganda, Kibale National Park Sycoecinae Crossogaster sp. nov. 2 2968_01 (SAMC) F. chirindensis Caulocarpae Kenya, Kakemega Forest Sycoecinae Crossogaster sp. nov. 2 2972_02 (SAMC) F. chirindensis Caulocarpae Uganda, Kibale National Park Sycoecinae Crossogaster sp. nov. 3 2968_02 (SAMC) F. chirindensis Caulocarpae Kenya, Kakemega Forest Sycoecinae Crossogaster sp. nov. 4 2975_04 (SAMC) F. natalensis Chlamydodorae Uganda, Kibale National Park Sycoecinae Crossogaster sp. nov. 5 2977_04 (SAMC) F. sp. nov. nr polita/
umbellata Caulocarpae Uganda, Kibale National Park Sycoecinae Crossogaster sp. nov. 6 2645_02 (SAMC) F. louisii Crassicostae Gabon, Mt Doudou Sycoecinae Crossogaster stigma 2629_03 (SAMC) F. glumosa Platyphyllae South Africa, Port Edward Sycoecinae Crossogaster odorans 2596_02 (SAMC) F. stuhlmannii Platyphyllae South Africa, Hluhluwe region Sycoecinae Diaziella bizzarea 1443_02 (CBGP) F. glaberrima Conosycea China, Yunnan, XTGB Sycoecinae Diaziella sp. 2908_01 (CBGP) F. lawesii Conosycea Indonesia, Sulawesi, South
Buton
Sycoecinae Diaziella sp. nov. 1 1855_12 (CBGP) F. sundaica Conosycea Malaysia, Sarawak Sycoecinae Diaziella sp. nov. 10 1877_07 (CBGP) F. sumatrana Conosycea Malaysia, Sarawak Sycoecinae Diaziella sp. nov. 11 1877_08 (CBGP) F. sumatrana Conosycea Malaysia, Sarawak
Sycoecinae Diaziella sp. nov. 12 2989_01 (CBGP) F. sp. Conosycea Philippines, Luzon, Mt Makiling, Los Banos
Sycoecinae Diaziella sp. nov. 2 1855_13 (CBGP) F. sundaica Conosycea Malaysia, Sarawak Sycoecinae Diaziella sp. nov. 3 1855_14 (CBGP) F. sundaica Conosycea Malaysia, Sarawak Sycoecinae Diaziella sp. nov. 4 1877_01 (CBGP) F. sumatrana Conosycea Malaysia, Sarawak Sycoecinae Diaziella sp. nov. 5 1877_02 (CBGP) F. sumatrana Conosycea Malaysia, Sarawak Sycoecinae Diaziella sp. nov. 6 1877_03 (CBGP) F. sumatrana Conosycea Malaysia, Sarawak Sycoecinae Diaziella sp. nov. 7 1877_04 (CBGP) F. sumatrana Conosycea Malaysia, Sarawak
Family Subfamily Genus Species Voucher number Host Ficus species host Ficus section Locality
Sycoecinae Diaziella sp. nov. 8 1877_05 (CBGP) F. sumatrana Conosycea Malaysia, Sarawak Sycoecinae Diaziella sp. nov. 9 1877_06 (CBGP) F. sumatrana Conosycea Malaysia, Sarawak Sycoecinae Diaziella yangi 1587_02 (CBGP) F. curtipes Conosycea China, Yunnan, Lancon Otitesellinae Micranisa degastris 2428_05 (CBGP) F. microcarpa Conosycea Taiwan, Shiti
Sycoecinae Philocaenus barbarus 2475_02 (SAMC) F. craterostoma Chlamydodorae South Africa, Ngome forest Sycoecinae Philocaenus barbarus 2595_02 (SAMC) F. stuhlmannii Platyphyllae South Africa, False Bay Park Sycoecinae Philocaenus barbarus 2617_02 (SAMC) F. natalensis graniticola Chlamydodorae South Africa, Soutpansberg Sycoecinae Philocaenus barbarus 2632_02 (SAMC) F. natalensis natalensis Chlamydodorae South Africa, Mtunzini Sycoecinae Philocaenus barbarus 2637_03 (SAMC) F. burkei Chlamydodorae South Africa, Abel Erasmus Pass Sycoecinae Philocaenus barbarus 2639_02 (SAMC) F. burkei Chlamydodorae South Africa, Port Edward Sycoecinae Philocaenus barbarus 2642_03 (SAMC) F. petersii Chlamydodorae Zambia, Southeast Isoka Sycoecinae Philocaenus bouceki 1813_03 (CBGP) F. reflexa Chlamydodorae Madagascar, Ranomafana Sycoecinae Philocaenus bouceki 2465_02 (CBGP) F. reflexa Chlamydodorae Madagascar, Ranomafana Sycoecinae Philocaenus hippopotamus 2622_03 (SAMC) F. trichopoda Platyphyllae South Africa, Umlalazi Sycoecinae Philocaenus levis 2614_02 (SAMC) F. ottonifolia lucanda Caulocarpae Uganda, Kibale National Park Sycoecinae Philocaenus liodontus 2593_02 (SAMC) F. stuhlmannii Platyphyllae Mozambique, Mandimba
Table 2 (continued).
Family Subfamily Genus Species Voucher number Host Ficus species host Ficus section Locality
Sycoecinae Philocaenus liodontus 2619_02 (SAMC) F. burtt-davyii Chlamydodorae South Africa, Woody Cape Reserve
Sycoecinae Philocaenus liodontus 2640_03 (SAMC) F. natalensis natalensis Chlamydodorae Zambia, Kapiri Mposhi Sycoecinae Philocaenus liodontus 2642_04 (SAMC) F. petersii Chlamydodorae Zambia, Southeast Isoka Sycoecinae Philocaenus medius 2593_03 (SAMC) F. stuhlmannii Platyphyllae Mozambique, Mandimba Sycoecinae Philocaenus medius 2640_04 (SAMC) F. natalensis natalensis Chlamydodorae Zambia, Kapiri Mposhi Sycoecinae Philocaenus medius 2958_02 (SAMC) F. natalensis natalensis Chlamydodorae Mozambique, South
Nhachengue
Sycoecinae Philocaenus rotundus 2623_02 (SAMC) F. abutilifolia Platyphyllae South Africa, Kwazulu-Natal, Jozini
Sycoecinae Philocaenus rotundus 2625_02 (SAMC) F. abutilifolia Platyphyllae South Africa, Soutpansberg Sycoecinae Philocaenus silvestrii 2602_02 (SAMC) F. lutea Galoglychia South Africa, Makhado Sycoecinae Philocaenus silvestrii 2603_02 (SAMC) F. lutea Galoglychia South Africa, Ongoye forest Sycoecinae Philocaenus sp. 1937_03 (CBGP) F. glumosa Platyphyllae Cameroun, Tibati
Sycoecinae Philocaenus sp. nov. 1 2633_02 (SAMC) F. usambarensis Crassicostae Zambia, Southwest Mporokoso Sycoecinae Philocaenus sp. nov. 2 2965_02 (SAMC) F. wakefieldi Platyphyllae Kenya, SW Nairobi
Sycoecinae Philocaenus warei 2628_02 (SAMC) F. glumosa Platyphyllae South Africa, Makhado Sycoecinae Philocaenus warei 2629_04 (SAMC) F. glumosa Platyphyllae South Africa, Port Edward Sycoecinae Philocaenus liodontus 2594_03 (SAMC) F. petersii Chlamydodorae South Africa, Mapumulanga Sycoecinae Philoceanus medius 2975_03 (SAMC) F. natalensis Chlamydodorae Uganda, Kibale National Park
Family Subfamily Genus Species Voucher number Host Ficus species host Ficus section Locality
Sycoecinae Robertsia sp. 2902_01 (CBGP) F. xylosycia Malvanthera Papua New Guinea, East New Britain, Raunsepna Sycoecinae Seres armipes 1930_02 (CBGP) F. ovata Caulocarpae Cameroun, West Baha Sycoecinae Seres solweziensis 2605_02 (SAMC) F. sansibarica sansibarica Caulocarpae South Africa, Legalameetse
Nature Reserve Sycoecinae Seres solweziensis 2606_02 (SAMC) F. sansibarica sansibarica Caulocarpae South Africa, Mpumalanga Sycoecinae Seres solweziensis 2611_02 (SAMC) F. ovata Caulocarpae Zambia, Kawambwa Sycoecinae Seres sp. nov. 1 0625_01 (CBGP) F. polita Caulocarpae Madagascar, Joffreville Sycoecinae Seres sp. nov. 1 1945_02 (CBGP) F. polita Caulocarpae Madagascar, Ambondanihefy Sycoecinae Seres sp. nov. 2 2607_03 (SAMC) F. sansibarica
macrosperma Caulocarpae Zambia, West Kawambwa Sycoecinae Seres wardi 1936_02 (CBGP) F. bubu Caulocarpae Cameroun, South Ebolowa Sycoecinae Sycoecus sp. nov. 1 2592_02 (SAMC) F. cyathistipula
cyathistipula Cyathistipulae Tanzania, Lake Chala Sycoecinae Sycoecus sp. nov. 2 2589_02 (SAMC) F. cyathistipula
cyathistipula Cyathistipulae Mozambique, Mount Namuli Sycoecinae Sycoecus sp. nov. 3 2970_02 (SAMC) F. densistipulata Cyathistipulae Uganda, Mabira Forest Sycoecinae Sycoecus sp. nov. 4 2978_02 (SAMC) F. nr barteri Cyathistipulae Zambia, Ikalenge Sycoecinae Sycoecus sp. nov. 5 2969_02 (SAMC) F. nr barteri Cyathistipulae Uganda, Mabira Forest Sycoecinae Sycoecus sp. nov. 6 2189_03 (SAMC) F. tesselata Cyathistipulae Gabon, Makokou
Sycoecinae Sycoecus taylori 2591_02 (SAMC) F. conraui Cyathistipulae Uganda, Kibale National Park Sycoecinae Sycoecus taylori 2971_02 (SAMC) F. conraui Cyathistipulae Uganda, Kibale National Park Otitesellinae Walkerella nr kurandensis 2428_06 (CBGP) F. microcarpa Conosycea Taiwan, Shiti
Otitesellinae Grandiana wassae 2492_02 (CBGP) F. wassa Sycicidium Solomon Islands, Guadalcanal Chalcididae Haltichellinae Haltichella rufipes GDEL0327 (CBGP) N/A N/A France, Alpes-Maritimes, Vallon
Gordolasque
Eurytomidae Eurytominae Bruchophagus caucasicus GDEL1288 (CBGP) N/A N/A France, Alpes-Maritimes, Lucéram, Mont L’Ablé Torymidae Megastigminae Megastigmus aculeatus 2962_01 (SAMC) N/A N/A Tanzania, SW Kalumbo More information is available from the authors upon request.
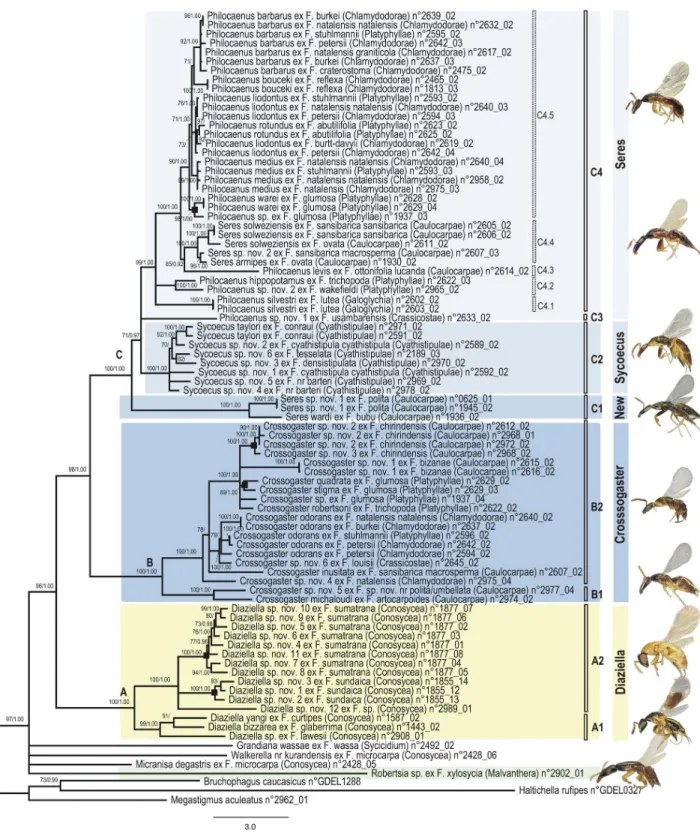
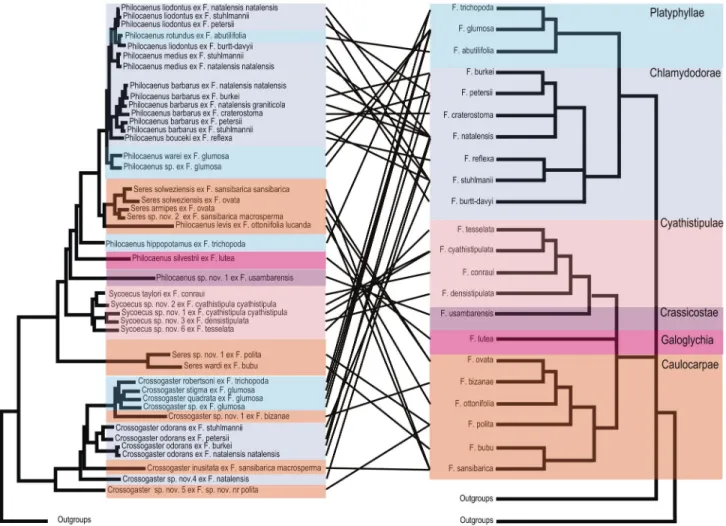
Figure 1. Phylogram of relationships among the Sycoecinae obtained from the analysis of the MAFFT alignment (combined dataset, without Gblocks cleaning, 6 partitions: mtDNAcodon1&2, mtDNAcodon3, EF-1α, ITS2, RpL27a, mago nashi). Uppercase letters refer to clades discussed in the text. The new classification is indicated by colored bars on the right
(yellow = oriental species, blue = afrotropical species). Nodes with likelihood bootstrap (BP) values < 70 have been collapsed. BP (> 70) and Bayesian posterior probabilities (> 0.90) are indicated at nodes. Illustrations of female habitus for the main clades are provided on the right. Host fig tree subsections are indicated between parentheses. Black boxes at nodes show cases of probable speciation on a single host Ficus species.
3. Phylogenetic analyses
Alignments of COI, Cytb, EF-1α and mago nashi were straightforward due to a lack of length variation. ITS2 and
RPL27a were aligned using various procedures, to assess the
impact of alignment methods on phylogenetic inferences. ITS2 and RPL27a alignments were reconstructed with ClustalW [48] and MAFFT 6.864 [49]. Default parameters were used in ClustalW and the L-INS-i option was chosen in MAFFT [49]. Alignments were then cleaned from highly divergent blocks using the online version of Gblocks 0.91b [50] using the default settings and a less stringent selection of blocks. For the latter strategy (hereafter named « Gblocks relaxed »), the "minimum number of sequences for a flanking position" and the "minimum number of sequences for a conserved position" were set to half the number of sequences, the "minimum length of a block” was set to 5 and selection of positions with gaps present in less than half of the sequences was allowed.
Alignments of the protein coding genes were translated to amino acids using Mega 4.0.2 [51] to detect frameshift mutations and premature stop codons, which may indicate the presence of pseudogenes. Alignments of individual gene regions obtained with each strategy were first analysed separately to produce single-gene trees and then concatenated, resulting in six combined datasets (ClustalW; ClustalW + Gblocks default parameters; ClustalW + Gblocks relaxed parameters; MAFFT; MAFFT + Gblocks default parameters; MAFFT + Gblocks relaxed parameters). All combined datasets (including charsets) have been deposited on TreeBase (http://purl.org/phylo/treebase/phylows/study/ TB2:S14838).
Phylogenetic trees of the six combined datasets were estimated using maximum likelihood (ML) and Bayesian methods. All analyses were conducted on a 150 cores Linux Cluster at CBGP as well as on the CIPRES Science Gateway [52]. Two alternative partitioning strategies were compared using Bayes factors (BF) [53]: Scheme 1: mitochondrial genes,
EF-1α, ITS2, RpL27a and mago nashi versus Scheme 2: first +
second codon positions of mitochondrial genes, third codon positions of mitochondrial genes, EF-1α, ITS2, RpL27a and
mago nashi. Following Kass and Raftery [53], Pagel and
Meade [54], and Schulte and de Queiroz [55], Bayes factors were calculated using the following formula: BF = 2*(ln L1 - ln L0) + (P1-P0) * ln (0.01) where ln Li and Pi are respectively, the harmonic mean of the ln likelihoods and the number of free parameters of model i. BF values from 2 to 6 were considered positive evidence, from 6 to 10 as strong evidence, and > 10 as very strong evidence favouring the alternative hypothesis over the null hypothesis. Best fitting model for each partition was identified using the Akaike information criterion [56] as implemented in MrAIC.pl 1.4.3 [57]. We performed ML analyses and associated bootstrapping using the MPI-parallelized RAxML 7.2.8-ALPHA [58]. GTRCAT approximation of models was used for ML boostrapping [58] (1000 replicates). Bootstrap percentage (BP) > 95% was considered as strong support and a BP < 70% as weak.
Bayesian analyses were conducted using a parallel version of MrBayes v. 3.2.1 [59]. We assumed across-partition heterogeneity in model parameters by unlinking parameters
across partitions. Parameter values for the model were initiated with default uniform priors and branch lengths were estimated using default exponential priors. To improve mixing of the cold chain and avoid it converging on local optima, we used Metropolis-coupled Markov chain Monte Carlo (MCMC), with each run including a cold chain and three incrementally heated chains. The heating parameter was set to 0.02 in order to allow swap frequencies from 20% to 70% [60]. We ran two independent runs of 20 million generations for the MAFFT-6 partitions and the MAFFT-Gblocks relaxed-6 partitions datasets and sampled values every 2000 generations. We ran two independent runs of 10 million generations for all other datasets and sampled values every 1000 generations. For the initial determination of burn-in, we examined the plot of overall model likelihood against generation number to find the point where the likelihood started to fluctuate around a constant value. The points sampled prior to convergence of the chains were then discarded. Convergence was also evaluated using the effective sample size (ESS) values of each parameters as reported in Tracer v1.5 [61]. The results were based on the pooled samples from the stationary phases of the two independent runs. Posterior probabilities (PP) > 0.95 were considered as strong support.
4. Test of alternative topologies
To compare topologies and assess whether certain alternative relationships among recovered clades could be statistically rejected, we performed AU [62] and SH [63] tests implemented in the program package CONSEL [64]. The program makermt was used to generates K=10 sets of bootstrap replicates. Each set consisted of 100,000 replicates of the row sums (10 times the default number of replicates). Default scales parameters were used (r1=0.5, r2=0.6, r3=0.7,
r4=0.8, r5=0.9, r6=1, r7=1.1, r8=1.2 r9=1.3, r10=1.4), meaning that
in the k-th set of replicates, Nk = rkN sites were randomly
chosen with replacement to calculate the row sums (with N=total number of sites). RAxML was used to compute the per-site log likelihoods for all trees.
5. Phylogenetic informativeness of markers
We initially compared the evolutionary properties of the markers using a Bayesian framework. For each partition of the complete combined datasets (without Gblocks cleaning), we studied base composition, substitution rates and rate variation among sites (α). We also compared rate variation among partitions, considering the parameter m (rate multiplier).
We profiled the phylogenetic informativeness (PI) of the markers, using the method described by Townsend [27] and implemented in the program PhyDesign [65]). This method uses per-site rate estimates to project the utility of a gene for resolving phylogeny across lineage history [27,66]. For each partition of a combined dataset, the phylogenetic informativeness of all sites can be summed, which provides the net phylogenetic informativeness (i.e. the degree to which the partition is predicted to contribute to resolution of the phylogeny across history). The informativeness can also be divided by the number of sites, resulting in the phylogenetic informativeness per site. We adopted this later approach in the present study as
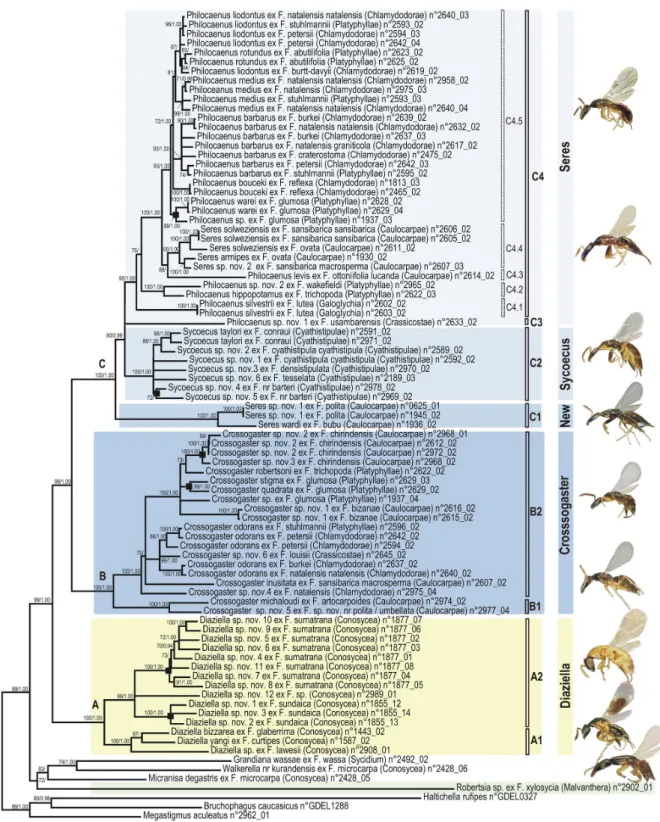
Figure 2. Phylogram of relationships among the Sycoecinae obtained from the analysis of the ClustalW alignment (combined dataset, without Gblocks cleaning, 5 partitions: mtDNA, EF-1α, ITS2, RpL27a, mago nashi). Uppercase letters
refer to clades discussed in the text. The new classification is indicated by colored bars on the right (yellow = oriental species, blue = afrotropical species). Nodes with likelihood bootstrap values < 70 have been collapsed. BP (> 70) and Bayesian posterior probabilities (> 0.90) are indicated at nodes. Illustrations of female habitus for the main clades are provided on the right. Host fig tree subsections are indicated between parentheses. Black boxes at nodes show cases of probable speciation on a single host
Ficus species.
it allows a comparison of the relative power of genes without the influence of gene length, which may be considered as more accurate [67,68]. PI profiles indicate historical epochs during which a partition is most likely to provide phylogenetic signal but do not discount for the misleading effect of homoplasy caused by convergence to the same character state in divergent lineages [27,67,68]. Therefore, one must be careful when interpreting PI profiles. When reading PI profiles from tips to root, PI of the marker increases until reaching its PImax. Once the profile has crested, there are more and more sites that are evolving faster than the optimal rate, which can result in homoplasy (“phylogenetic noise”, [68,69]. Homoplasy plays a greater effect when the internodes are short. Therefore, when trying to resolve relationships, it is preferable to use character sets with PI profiles peaking deeper in time than the epoch of interest [68].
Bayesian and ML analyses of ClustalW and MAFFT alignments produced similar topologies (see results) and informativeness was calculated using the MAFFT datasets (6 partitions, without Gblocks cleaning, default-Gblocks cleaning, relaxed-Gblocks cleaning). Site rates as inferred by MrBayes (report siterates=yes command) were compiled into PhyDesign formatted files (see PhyDesign FAQ) and used as input rates. Those “vector files” are available upon request. The ultrametric tree was obtained from the MAFFT ML tree (6 partitions) using PATHd8 [70] by arbitrarily setting the root to 1.
Results
1. Impact of alignment strategy
The final matrix contained 81 sycoecine specimens representing 56 ingroup species and six outgroups. Outgroup ITS2 sequences and Bruchophagus caucasicus, Haltichella
rufipes and Megastigmus aculeatus RpL27a sequences were
too divergent to be reliably aligned and were consequently
excluded from the analyses. No stop codons or frame shifts were detected in the protein coding regions.
Numbers of aligned base pairs, variable sites and parsimony-informative sites for each gene region used in this study are summarized in Table 3. MAFFT and ClustalW alignments of ITS2 and RPL27a resulted in datasets with similar properties (Δ total sites MAFFT/ClustalW = -2 for ITS2, 28 for
RPL27a; Δ parsimony informative sites MAFFT/ClustalW = -8 for ITS2, -4 for RPL27a). Removing highly divergent alignment blocks using Gblocks with default parameters dramatically reduced the number of parsimony-informative sites (about 95% loss for ITS2 and between 66% (ClustalW) and 70% (MAFFT) loss for RPL27a). This loss resulted in far less resolved ITS2 and RPL27a trees, when either the MAFFT + Gblocks default or ClustalW + Gblocks default datasets were analysed (Figures S17, S20 and see Table S3 for a comparison of tree resolutions). The Gblocks-relaxed parameters cleaning only slightly affected the resolution of the ITS2 tree and did not affect the resolution of the RPL27a tree (Table S3, Figures S18, S21).
For all partitions the best-fitting model chosen by MrAIC was GTR+I+Γ. We used a discrete gamma approximation [71] with four categories. A total of four analyses were performed per six combined datasets (2 partitioning schemes (5 versus 6 partitions) each analysed using ML and Bayesian methods, Table 4). For all bayesian analyses, after discarding 25% of the samples as burnin, ESS value of each parameter largely exceeded 200, which showed that convergence was reached. Twenty-four combined trees were obtained (Figures S1-S12) and deposited on TreeBase (http://purl.org/phylo/treebase/ phylows/study/TB2:S14838). For all datasets, Bayes factor indicated that the most complex partitioning scheme (6 partitions) was preferred over the least complex one (5 partitions) (Table 4).
All trees had well-resolved backbones and three major clades (A, B, C) were identified (Figures 1-4, S1-S12). As
Table 3. Numbers and percentages of aligned base pairs, variable sites and parsimony-informative sites for the gene
regions used in this study.
Partition Total sites Variable sites Parsimony-informative sites
mtDNA 2168 1082 (49.9%) 821 (37.9%) EF-1α 516 156 (30.2%) 115 (22.3%) mago nashi 309 108 (35.0%) 87 (28.2%) ITS2 Alignment ClustalW 705 461 (65.4%) 345 (48.9%) ITS2 Alignment ClustalW + Gblocks default 88 23 (26.1%) 17 (19.3%) ITS2 Alignment ClustalW + Gblocks relaxed 338 187 (55.3%) 155 (45.9%) ITS2 Alignment MAFFT 703 420 (59.7%) 337 (47.9%) ITS2 Alignment MAFFT + Gblocks default 87 23 (26.4%) 17 (19.5%) ITS2 Alignment MAFFT + Gblocks relaxed 373 229 (61.4%) 199 (53.3%) RpL27a Alignment ClustalW 658 380 (57.8%) 258 (39.2%) RpL27a Alignment ClustalW + Gblocks default 275 117 (42.5%) 86 (31.3%) RpL27a Alignment ClustalW + Gblocks relaxed 543 321 (59.1%) 251 (46.2%) RpL27a Alignment MAFFT 686 358 (52.2%) 254 (37.0%) RpL27a Alignment MAFFT + Gblocks default 261 105 (40.2%) 75 (28.7%) RpL27a Alignment MAFFT + Gblocks relaxed 542 338 (62.4%) 247 (45.6%) doi: 10.1371/journal.pone.0079291.t003
expected the Gblocks-default topologies (Figures 3-4; S3-S4; S9-S10) showed poorer nodal supports at shallower (within C2, C4.5 clades) and intermediate nodes (within clade C). The MAFFT - 6 partitions datasets was used as input for SH and AU tests of alternative topologies (Table S2). Those tests indicated that the Gblocks-default parameters topologies were all significantly different from the others, though our visual comparison of trees revealed that conflicting nodes had poor supports. The only topological conflict between all 24 topologies with a BP > 70 was the position of Diaziella sp. nov. 12 ex Ficus sp. (n° 2989_01) (Figures 3-4, dashed line). Its position was either unresolved (5 trees), as sister to the rest of clade A2 (6 trees, 80 < BP < 92; 0.52 < PP < 1.00) or nested within clade A2 (ClustalW+Gblocks relaxed-6 partitions tree, BP=75, PP=0.89). This uncertainty was probably due to the amount of missing data for this taxon (only 3 markers on 6, Table S1).
2. Evolutionary properties and phylogenetic informativeness (PI) of markers
Model parameter estimates for each partition of the Bayesian analyses of the MAFFT combined dataset - 6 partitions (mean and 95% credibility intervals) are reported in Table 5. Parameter estimates from the analysis of the Clustal W combined dataset (6 partitions) were similar (available upon request). As might be expected, the mtDNA partition showed extreme base compositional bias (69.7% and 96.0% of A/T for mtDNA first + second codon positions and third codon positions respectively). Among the nuclear genes analysed, while
RPL27a and mago nashi were A/T-biased (73.6% and 65.4 %
respectively), EF-1α and ITS2 show more or less even base
composition (50.9% and 55.2% of A/T, respectively). There was a higher rate of A-G and C-T transitions for all partitions (52.6% for ITS2, 64.1% for mtDNA first + second codon positions, 68.8% for RPL27a, 80,3% for EF-1α, 84.9% for
mago nashi and 88.8% for mtDNA third codon positions). The
mtDNA third codon positions showed a high rate of C-T transitions relative to any other transformations (57.0%). For the nuclear genes, the rates of transitions were close and so were the rates of transversions. The ITS2 rate matrix was the least skewed towards one type of change over another. The gamma shape parameter α was higher for the nuclear genes than for the mtDNA partitions, indicating that nuclear genes show less rate heterogeneity among sites than mitochondrial genes (Table 5). The rate multiplier parameters (m) indicated that rates of substitution were different among partitions. The mtDNA third codon positions evolved about twenty-three times faster than the fastest nuclear gene (ITS2). EF-1α was the most slowly evolving marker.
For the complete dataset (MAFFT without Gblocks cleaning -6 partitions), mtDNA (first+second and third codon positions) showed sharp peaks of informativeness at shallower nodes (Figure 5). Then, the profiles declined showing potential for homoplasy, which is not surprising when considering mtDNA evolutionary properties (Table 5). This prediction is confirmed by the observation of the real performance of the mtDNA marker (i.e. the single-gene tree) in resolving shallower relationships (Figure S13). Interestingly, PI profile suggested that ITS2 was informative across the whole phylogeny. Again, this prediction was confirmed by the observation of the ITS2 tree (Figure S16), on which main clades were recovered. Overall, shapes of the PI profiles correlated well with the corresponding single-gene tree topologies (Figures S13-S16,
Table 4. Arithmetic and harmonic means (lnL) for trees obtained in Bayesian analyses based on alternative alignment and
partitioning strategies.
DatasetPartitioning strategies Alignment Figures Harmonic Mean (LnL) Bayes factor (BF**)
1 P1 : mtDNA, EF-1α, ITS2, RpL27a, mago nashi [5 partitions, 54 free
parameters*] ClustalW 2, 4, S1 -41666.23 BF2/1 = 2487.0 2 P2 : mtDNAcodon1&2, mtDNAcodon3, EF-1α, ITS2, RpL27a, mago nashi
[6 partitions, 65 free parameters*] ClustalW 4, S2 -40397.38
3 P1 ClustalW + Gblocks default 4, S3 -31414.10 BF4/3 = 2432.8
4 P2 ClustalW + Gblocks default 4, S4 -30172.36
5 P1 ClustalW + Gblocks relaxed 4, S5 -37383.72 BF6/5 = 2459.5
6 P2 ClustalW + Gblocks relaxed 4, S6 -36128.63
7 P1 MAFFT 1, 4, S7 -41369.61 BF8/7 = 2474.5
8 P2 MAFFT 4, S8 -40107.02
9 P1 MAFFT + Gblocks default 4, S9 -31258.75 BF10/9 = 2432.1
10 P2 MAFFT + Gblocks default 4, S10 -30017.36
11 P1 MAFFT + Gblocks relaxed 4, S11 -38341.39 BF12/11 = 2457.9
12 P2 MAFFT + Gblocks relaxed 4, S12 -37087.12
*. excluding branch length and topology parameters. Given that all parameters are unlinked among partitions, the number of free parameters of the composite model is the sum of the free parameters of its submodels. For all partitions the best-fitting model chosen by MrAIC was GTR+I+Γ (10 free parameters).
** BF1/0 = 2*(ln L1 – ln L0) + (P1-P0) * ln (0.01) where ln Li and Pi are respectively, the harmonic mean of the ln likelihoods and the number of free parameters of model i.
BF values from 2 to 6 were considered positive evidence, from 6 to 10 as strong evidence, and > 10 as very strong evidence favouring the alternative hypothesis over the null hypothesis.
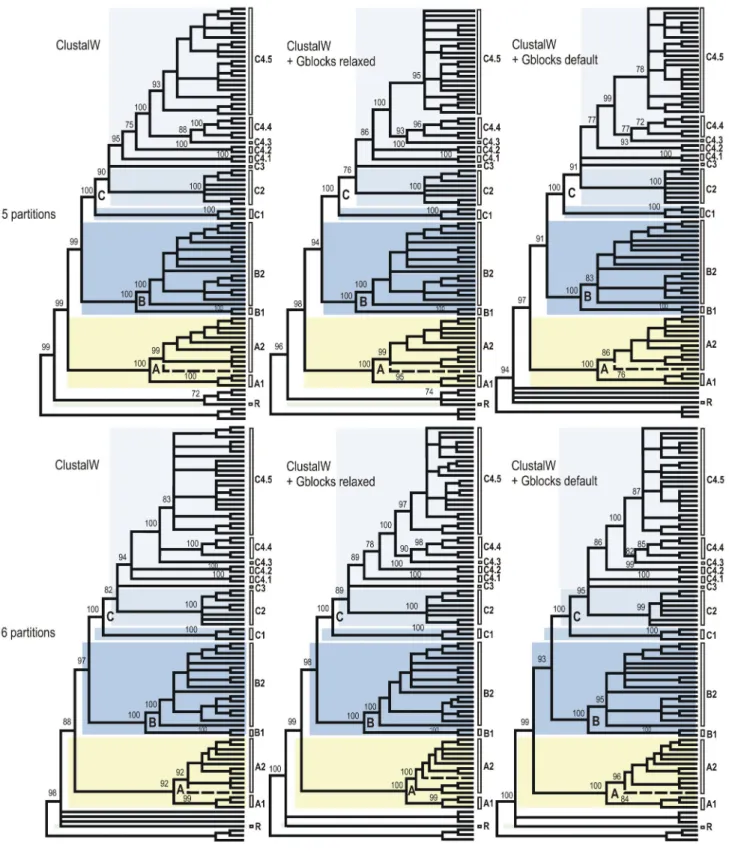
Figure 3. Cladograms of relationships among the Sycoecinae obtained from the ClustalW alignment of the combined dataset under three different alignment strategies and two partitioning schemes. The corresponding ML and Bayesian trees
are given in Figures 2, S1-S6. Nodes with BP support < 70% have been collapsed and BP supports for main clades are indicated at nodes. Uppercase letters refer to clades discussed in the text (see also Figure 2). The dashed line indicates the only taxon with a conflicting position among trees (see text).
Figure 4. Cladograms of relationships among the Sycoecinae obtained from the MAFFT alignment of the combined dataset under three different alignment strategies and two partitioning schemes. The corresponding ML and Bayesian trees
are given in Figures 1, S7-S12. Nodes with BP support < 70% have been collapsed and BP supports for main clades are indicated at nodes. Uppercase letters refer to clades discussed in the text (see also Figure 1). The dashed line indicates the only taxon with a conflicting position among trees (see text).
S19) and, more precisely, with the distribution of branch lengths across the topologies. The mtDNA topology had longer terminal than internal branches. The deeper in the tree, the shorter the branches, though enough information remained to resolve, at least partially, deeper relationships. Terminal branches of the ITS2 tree were much shorter than those of the mtDNA tree, but longer than those of the RPL27a tree. The deeper branches of the ITS2 tree were longer than those of the
RPL27a tree. Neither EF-1α nor mago nashi, the slowest
evolving markers contained enough information to resolve relationships within species complexes and sometimes even between species (Figures S14, S15). Our qualitative comparison of single gene tree topologies would lead us to the following ranking in informativeness at shallower nodes : mtDNA > ITS2 > RPL27a > mago nashi ~ EF-1α, which
corresponded to the relative position of the PI profile curves. At deeper nodes, this comparison would lead us to rank the markers as follows: ITS2 (longest branches) > RPL27a > mtDNA ~ mago nashi ~ EF-1α, which is again compatible with
the PI profiles on Figure 5. mago nashi PI profile curve lays a bit above EF-1α PI profile curve probably because some longer branches do appear in the mago nashi topology (Figure S15).
PI profiles were similar, when a relaxed Gblocks cleaning was performed (Figure S22), and, as expected, the informativeness of ITS2 and RPL27a sharply decreased, when default parameters were used to clean the alignment (Figure S23). A bit surprisingly, the default-Gblocks mtDNA PI score was the highest across the whole phylogeny, though RPL27a showed an equivalent resolution at intermediate nodes (Figures S13, S20).
3. Sycoecinae relationships
As we were interested in relationships at both lower and higher levels, we focussed on trees from the ML and Bayesian analyses of the complete datasets (ie without Gblocks cleaning). We deliberately kept what could be considered the
“worst” tree (ie ClustalW + 5 partitions, Figure 2, S1) and the “best” tree (ie MAFFT + 6 partitions, Figures 1, S8) as no one was preferred by the SH/AU tests of alternative topologies. We also wanted to over-emphasize that the few topological differences only occurred between nodes that were either poorly supported in both trees or poorly supported in at least one of the two trees. In the following section, BP and PP values are mentioned as followed: BP ClustalW-tree/BP MAFFT-tree; PP ClustalW-tree/PP MAFFT-tree or are summarized by unique values when no differences between the trees were observed.
The genus Robertsia never clustered with other Sycoecinae species. However, a monophyletic Sycoecinae could not be rejected by both SH and AU tests (Table S2).
All the remaining sycoecine genera formed a strongly supported clade (BP = 99/96, PP = 1.00). The phylogenies supported the monophyly of the genera Crossogaster (BP = 100, PP = 1.00), Diazella (BP = 100, PP = 1.00) and Sycoecus (BP = 100, PP = 1.00) but recovered neither Philocaenus nor
Seres as monophyletic. Both AU and SH tests rejected a
monophyletic Seres (Table S2).
The Sycoecinae (genus Robertsia excepted) clustered into three major clades: Diaziella species (clade A) appeared sister to a clade grouping all Afrotropical Sycoecinae (BP = 99/98, PP = 1.00/1.00), which clustered into two clades: clade B (Crossogaster spp.) and clade C (Philocaenus, Sycoecus and
Seres spp., BP = 100, PP = 1.00).
Within clade A, Diaziella yangi, D. bizarrea and D. sp. ex F.
lawesii (clade A1, BP = 100/99, PP = 1.00), were sister to a
clade (clade A2, BP = 99/100, PP = 1.00) that grouped all other
Diaziella species.
Within clade B, Crossogaster sp. nov. 5 + C. michaloudi (clade B1; BP = 100, PP = 1.00) were sister to the remaining
Crossogaster species (clade B2; BP = 100, PP = 1.00).
Interestingly, Crossogaster sp. nov. 6 ex F. louisii grouped with the C. odorans clade (BP = 99/100, PP = 1.00).
Table 5. Evolutionary properties of the partitions used in this study.
Partitions r A-C r A-G r A-T r C-G r C-T r G-T
EF-1α 0,069 (0,042-0,096) 0,317 (0,238-0,397) 0,044 (0,018-0,073) 0,04 (0,02-0,062) 0,486 (0,402-0,564) 0,044 (0,02-0,07) ITS2 0,118 (0,093-0,143) 0,251 (0,216-0,287) 0,159 (0,133-0,185) 0,091 (0,068-0,114) 0,275 (0,239-0,312) 0,106 (0,083-0,128) mago nashi 0,053 (0,03-0,08) 0,389 (0,302-0,477) 0,045 (0,026-0,066) 0,032 (0,008-0,06) 0,46 (0,372-0,552) 0,022 (0,002-0,042) RpL27a 0,075 (0,054-0,097) 0,327 (0,28-0,375) 0,068 (0,054-0,082) 0,081 (0,046-0,116) 0,361 (0,314-0,411) 0,088 (0,066-0,112) mtDNA 1&2 codon positions 0,065 (0,044-0,086) 0,301 (0,252-0,352) 0,117 (0,095-0,14) 0,132 (0,093-0,173) 0,34 (0,289-0,394) 0,046 (0,03-0,06) mtDNA 3 codon positions 0,009 (0-0,02) 0,318 (0,229-0,408) 0,003 (0,002-0,004) 0,089 (0-0,219) 0,57 (0,444-0,682) 0,011 (0-0,022)
Partitions pi A pi C pi G pi T alpha rate multiplier (m)
EF-1α 0,275 (0,238-0,312) 0,25 (0,217-0,283) 0,241 (0,207-0,275) 0,234 (0,203-0,268) 2,749 (0,141-4,323) 0,037 (0,03-0,044) ITS2 0,255 (0,232-0,28) 0,213 (0,191-0,235) 0,236 (0,212-0,26) 0,297 (0,272-0,321) 3,318 (1,981-4,874) 0,239 (0,205-0,271) mago nashi 0,359 (0,313-0,404) 0,167 (0,135-0,199) 0,179 (0,146-0,216) 0,295 (0,253-0,337) 7,623 (0,29-18,925) 0,062 (0,048-0,075) RpL27a 0,352 (0,324-0,382) 0,129 (0,111-0,147) 0,136 (0,116-0,156) 0,384 (0,355-0,413) 4,389 (1,761-7,465) 0,12 (0,105-0,139) mtDNA 1&2 codon positions 0,293 (0,272-0,314) 0,145 (0,127-0,164) 0,158 (0,14-0,175) 0,404 (0,38-0,427) 0,606 (0,427-0,81) 0,08 (0,066-0,091) mtDNA 3 codon positions 0,5 (0,482-0,516) 0,024 (0,022-0,026) 0,017 (0,015-0,019) 0,46 (0,443-0,477) 0,347 (0,319-0,377) 5,503 (5,44-5,561) Mean and 95% credibility intervals of the model parameters for each partition included in the Bayesian analyses of the MAFFT combined datasets (6 partitions) are reported. Parameter estimates from the analysis of the Clustal W combined dataset (6 partitions) were similar (available upon request).
Figure 5. Per site phylogenetic informativeness profiles of the markers based on the MAFFT dataset (6 partitions). Uppercase letters refer to clades discussed in the text (see also Figures 1 & 2).
Within clade C, Seres species hosted by Ficus polita and F.
bubu (clade C1, BP = 100, PP = 1.00) were recovered sister to
a strongly supported clade (BP = 90/71, PP = 0.99/0.97) including 1) Sycoecus species (clade C2, BP = 100, PP = 1.00), 2) an undescribed Philocaenus species (“clade” C3) and, 3) a strongly supported clade (C4, BP = 95/99, PP = 1.00) clustering Philocaenus species and all the remaining Seres species (type species of the genus Seres included). Within clade C4, four groups of Philocaenus species could be distinguished (C4.1 to C4.4). P. barbarus could be a complex of at least three species. Furthermore, P. liodontus and P.
rotundus did not form mutually exclusive clades.
Finally, our analyses recovered several cases, where most closely related species were sampled from the same host tree (black boxes in Figures 1 & 2), which could indicate sympatric speciation (Genera Diaziella, Crossogaster, Sycoecus and
Philocaenus) .
Discussion
1. Impact of alignment and partitioning strategies, accuracy of phylogenetic informativeness profiles
As underlined by Rokas et al. [26], one should be cautious when making generalizations about the taxonomic level at which a given marker might be useful. Genera belonging to different insect families may span a range of evolutionary ages, and hence evolutionary properties and phylogenetic informativeness (PI) of markers should be used as guidelines only [69]. Despite the potential problems while applying these properties across different families, we believe that our results may be useful for the designing of future phylogenetic studies between and within chalcidoid families, especially within the pteromalid complex [9]. It as been shown that MAFFT outperformed ClustalW on several datasets (e.g. [49]), however, this was not the case for our dataset. We also highlighted that complex partitioning schemes, even favoured by Bayes Factors did not lead to different topologies. Then, between what could be considered the “worst” tree (ie ClustalW + 5 partitions, Figures 2, S1) and the “best” tree (ie MAFFT + 6 partitions, Figures 1, S8) only few topological differences were identified and all of them occurred between nodes that were either poorly supported in both trees or poorly supported in at least one of the two trees. We also showed that using Gblocks
with default settings on our alignments dramatically decreased the number of parsimony informative sites (Table 3) and tree resolution. This indicates that one must be cautious when using Gblocks to clean alignments. Gene properties should be studied before Gblocks refinement and selection of blocks should be used only when focussing on relationships at high level, especially when an important number of markers are concatenated [72].
Overall, shapes of the phylogenetic informativeness (PI) profiles (Figure 5) correlated well with the distribution of branch lengths on the corresponding single-gene tree topologies (Figures S13-S21). It is noteworthy that ITS2 contained information spanning the whole tree and mtDNA did contain signal to contribute resolving shallower but also deeper nodes of the phylogeny. It was surprising that the mtDNA PI score was still the highest of any gene at the root of our phylogeny when we profiled the informativeness of each partition of the MAFFT-Gblocks default dataset (Figure S23). Klopstein et al. [67] suggested that PI could be biased towards fast rates (due to the whole set-up of the measure). This could explain the relative position of the curves on the MAFFT-Gblocks default PI profiles. Indeed, for this dataset, mean values of m (rate multiplier) scores for the two partitions: mtDNA-third codon (mtDNAnt3) and mtDNA-first + second codon (mtDNAnt1&2) positions were the highest of any partitions (Table 6). Nevertheless, the mtDNA PI score for the MAFFT dataset was not the highest of any gene at the root of our phylogeny (Figure 5), though the rate multiplier of the mtDNAnt3 partition was the highest of any other partitions (Table 5). Moreover, the mean values of m scores for the ITS2 and RPL27a partitions were higher than the mean value of m score of the mtDNAnt1&2 partition, though the mtDNAnt1&2 PI score was higher than ITS2 and RPL27a PI scores at shallower and intermediate nodes (Figure 5).
2. Monophyly of the sycoecine genera and new classification
2.1. Robertsia (clade A). The genus Robertsia is
morphologically very distinct from the other sycoecine genera (Table 1) and is the only Sycoecinae genus with apterous males [6,24]. Our study shows that taxonomic affinities of
Robertsia are ambiguous. However, no definitive conclusion
can be drawn from our results. Further studies, including more
Table 6. Rate multiplier values (m) for each partitions included in the Bayesian analyses of the MAFFT + Gblocks default
parameters and MAFFT + Gblocks relaxed parameters combined datasets (6 partitions).
Partitions rate multiplier (m) rate multiplier (m)
MAFFT + Gblocks (default parameters) MAFFT + Gblocks (relaxed parameters)
EF-1α 0.041 (0.033-0.044) 0.037 (0.029-0.044) ITS2 0.065 (0.032-0.103) 0.161 (0.137-0.186) mago nashi 0.069 (0.053-0.086) 0.063 (0.050-0.077) RpL27a 0.065 (0.052-0.081) 0.116 (0.100-0.134) mtDNA 1&2 codon positions 0.083 (0.070-0.096) 0.079 (0.067-0.092) mtDNA 3 codon positions 4.364 (4.328-4.397) 5.022 (4.976-5.068) doi: 10.1371/journal.pone.0079291.t006
representatives of the genus and New Guinean pteromalid genera are required. These studies could for example discard a possible long-branch attraction artifact between Robertsia and the outgroup species used in the present study or a negative impact of missing data (only ITS2, RPL27a and mago nashi could be obtained for this taxa).
2.2. Diaziella (clade A). Diaziella is strongly supported as
monophyletic across all analyses. This genus is also well defined morphologically [22]. All Diaziella species are associated with Ficus species occurring in Oriental tropical forests and belonging to the subsection Conosycea (Table 1, Figures 1 & 2). Our analyses highlighted two species-groups within the genus (A1 and A2). The species associated with the basal most Conosycea fig trees Ficus glaberrima, F. curtipes and F. lawesii [44,73] clustered in a strongly supported clade (clade A1). These species are characterized by a metallic tinge on the female thorax. Within the clade A2, two small radiations of eight and three species are hosted respectively by F.
sumatrana and F. sundaica. Females of these species are
characterized by a non-metallic thorax (black or yellow).
2.3. Crossogaster (clade B). Crossogaster is recovered as
monophyletic with strong support in all the analyses, a result also supported by morphology (Table 1). Crossogaster species are associated with four of the six Galoglychia subsections namely Platyphyllae, Chlamydodorae, Crassicostae and
Caulocarpae that occur in afrotropical forests and savannas
(Figures 1 & 2, Table 1).
Crossogaster splits into two well supported clades (B1 and
B2). Based on morphological interpretation, van Noort (1994a) split Crossogaster into two monophyletic species-groups and excluded three unassigned basal species. Both the C. odorans species-group (characterised by the presence of elongate multiporous plate sensilla (MPS) on five antennal funicle segments), and the C. triformis species-group (characterised by the presence of placoid MPS on the usually four antennal funicle segments) are included in our clade B2, but each group is not supported suggesting that MPS appearance and number of funicular segments is homoplasious. Our clade B1 corresponds with two of the species exhibiting plesiomorphic characters, C. michaloudi and C. lachaisei (Crossogaster sp. nov 5 is closely related to C. lachaisei). The third species exhibiting plesiomorphic characters, C. inusitata, is a basal representative included in clade B2. However, more representative taxa need to be included to redefine the
Crossogaster species-groups.
Interestingly, Crossogaster odorans appeared to cluster into several subclades, which is not surprising since Crossogaster
odorans was described from specimens associated with F. burkei. Van Noort (1994a) acknowledged that C. odorans
probably comprised a species complex and discussed the associated morphological variation.
2.4. A new genus basal to Seres + Sycoecus (clade C1). Since this clade is strongly supported with a long-branch
length and is characterized by strong morphological synapomorphies, it should represent a new genus that will be described elsewhere (van Noort & Rasplus, in prep). Species belonging to clade C1 exhibit a unique plate of teeth on the fore tibia of females and a metallic green head in males. Seres
wardi was first identified as a distinct member of Seres based
on morphology of both sexes [15]. Together with another distinct member (Seres longicalcar), S. wardi was placed in the genus Seres based on the perceived synapomorphic positioning of the propodeal spiracles [15], which now appears to have been derived independently on several occasions rendering Seres as currently recognised to be a polyphyletic assemblage. Species belonging to this clade are only associated with fig trees of the section Galoglychia subsection
Caulocarpae, all of them occurring in afrotropical rainforests
(Figures 1 & 2).
2.5. Sycoecus (clade C2). Sycoecus is recovered as a
strongly supported monophyletic clade across all the analyses, confirming the morphological delimitation of this genus that exhibits striking apomorphies (Table 1). All species of
Sycoecus are associated with fig trees from the subsection Cyathistipulae that grow in the evergreen forests of Central,
West and East Africa (Figures 1 & 2, Table 1).
2.6. A new genus associated with subsection Crassicostae ? (lineage C3). Unfortunately, we were able to
include only the one known Philocaneus species associated with the subsection Crassicostae, a subsection with a species distribution centred in the poorly sampled Congo basin. The remaining seven species in this subsection have not yet had their associated fig wasp faunal assemblages sampled or if sampled (F. louisii and F. elasticoides) potential Philocaenus species were not reared. Our results show that the phylogenetic position of Philocaenus sp. nov. ex. F.
usambarensis is ambiguous (Figures 1 & 2, C3). Although it is
recovered as sister to all other Philocaenus species, this relationship is not supported. Morphologically this species is also exceptional. The mandibles are very different and the ovipositor is exceptionally long for Philocaenus being longer than half of the metasomal length. There are a total of eight
Ficus species in subsection Crassicostae. Given the host
relationships of Philocaenus, this subsection may potentially host further related Philocaenus species. If inclusion of these species in the phylogeny results in a monophyletic clade, erection of a new genus may be warranted. However, for the time being, we prefer to keep this species as part of the genus
Seres (in its extended delimitation, see here under).
2.7. Seres, sensu nov. (Clade C4). In all analyses, a clade
clustering some Seres species and including S. armipes, type species of the genus Seres (clade C4.4) makes Philocaenus paraphyletic. In our opinion Philocaenus should be synonymized under Seres. Consequently, the following new combinations are proposed: Seres arrujumensis (van Noort, 2006) comb. nov., S. bakeri (van Noort, 1994) comb. nov., S.
barbarus (Grandi, 1955) comb. nov., S. barbatus (Grandi,
1952) comb. nov., S. bifurcus (van Noort, 1994) comb. nov., S. boučeki (Wiebes, 1982) comb. nov., S. cavus (van Noort, 1994) comb. nov., S. clairae (van Noort, 1994) comb. nov., S.
comorensis (van Noort, 1994) comb. nov., S. comptoni (van
Noort, 1994) comb. nov., S. geminus (van Noort, 1994) comb. nov., S. hippopotomus (van Noort, 1994) comb. nov., S.
insolitus (van Noort, 1994) comb. nov., S. jinjaensis (van Noort,
1994) comb. nov., S. levis Waterston, 1920 (Original combination restored). S. liodontus (Wiebes, 1979) comb. nov.,