Design and Fabrication of a Post-Processing Furnace for 3D Printed Parts by
Ram Chilukuri
Bachelor of Technology, Mechanical Engineering Indian Institute of Technology, Delhi, 1998
Submitted to the Department of Mechanical Engineering in Partial Fulfillment of the Requirements for the degree of MASTER OF SCIENCE IN MECHANICAL ENGINEERING
at the
MASSACHUSETTS INSTITUTE OF TECHNOLOGY
MAY 2000
@ 2000 Massachusetts Institute of Technology All rights reserved
Signature of author: ...
Department of Mechanical Engineering May 15, 2000
C ertified by : ... ... ...
Emanuel M. Sachs Professor of Mechanical Engineering
Accepted by: ...
Ain A. Sonin Chairman, Graduate Committee
Design and Fabrication of a Post-Processing Furnace for 3D Printed Parts
by
Ram Chilukuri
Submitted to the Department of Mechanical Engineering on May 15, 2000 in Partial Fulfillment of the Requirements for the Degree of
Master of Science in Mechanical Engineering ABSTRACT
Three dimensional printing is a rapid prototyping process that forms parts directly from a computer model by joining powdered material with a binder. The green part so obtained is subjected to post processing steps that include debinding, sintering and infiltration. Furnaces currently being used for post processing use a Hydrogen or a vacuum atmosphere and the cost of scaling them up to process large parts is prohibitively high. Previous work done at MIT came up with a design for an economical furnace, and a prototype small scale furnace. In this work, as a first step, the small scale furnace previously developed at MIT was optimized to yield good quality, oxide free sintered and infiltrated parts. The important thing learnt from the small scale furnace was that it in order to get oxide free parts, it was necessary to heat the furnace shell from the outside and allow the furnace to soak at 200 C until the dew point inside got to a low value
like -25 C, before ramping the furnace to 1200 C.
Having learnt about the process and obtained design parameters from the small scale furnace, a large scale furnace was constructed. This furnace has a rectangular cross section and is more than 20 times bigger in volume than the small scale furnace, which had a circular cross section. This furnace has an Aluminum shell, uses Alumina and Graphite insulation and uses Kanthal heating elements embedded in high Alumina content heater plates to heat the inside of the furnace (12 internal heaters for a total of 10.2 kW). It is designed to operate in a Forming gas or Argon atmosphere. In addition to the internal heaters, it has eleven strip heaters on the shell (a total power of 11 kW) to expel moisture from the insulation during the purging phase of a furnace run. The furnace has a Honeywell controller that uses PID control to ensure the desired operation of the furnace. The controller has events that are used to control the switching of the strip heaters and gas solenoid valves. SS420 parts were successfully sintered and infiltrated using the large scale furnace. At 1200 C, excellent temperature uniformity (temperature in a 5 C band) was found to exist inside the furnace both in the vertical direction and along the furnace depth.
A second issue that was studied as part of this work was the effect of directional
solidification on porosity in infiltrated parts. The small scale furnace was used to conduct directional solidification experiments on SS420 parts infiltrated with Bronze. These involved inducing a temperature gradient in a part (using a jet of Argon set up to strike the part on the top) at the end of an infiltration cycle. By comparing two extreme cases, directional solidification, in which the top of a solidifying part is kept cooler than the bottom, with reverse directional solidification, in which the bottom of the part is kept cooler than the top as it solidifies, it was established that directional solidification reduces porosity in parts.
Thesis Supervisor: Emanuel M. Sachs Title: Professor of Mechanical Engineering
Acknowledgements
I would like to thank Prof. Emanuel Sachs for giving me a chance to work on this project. I am
grateful to Prof. Sachs for all that he taught me over the last two years. I am truly impressed by his ability to come up with simple solutions to seemingly complex problems.
I would like to thank the following people who helped me during the course of my research:
Prof. Samuel Allen, for giving me ideas out of his infinite trove of material science knowledge. Adam Lorenz, who helped me come up to speed with furnace design. I would like to thank him for being a good colleague, ever ready to use his expertise to help me solve problems.
Julie Baars Kaczynski for promptly processing purchase orders for me, and for all the interesting conversations on a variety of non engineering topics. It was fun working with her.
Diane Brancazio, for designing the furnace shell. It was a pleasure working with her. David Brancazio and James Serdy, for being ever ready to help me.
Mark Belanger, for making all my visits to the LMP machine shop fun experiences, and for being a good friend. I'd also like to thank Gerry Wentworth for helping me in the machine shop.
Peter Morley of MIT Central Machine Shop, for expediting all my job orders.
Yin- Lin Xie of Material Science, for helping me section, polish and photograph infiltrated parts.
I would also like to thank the following folks for making my stay at the 3D printing lab a
memorable one: Andreas Straube, Ben Polito, Berndt Heid, Bjorn DeBear, Costas Hadjiloucas, David Ables, David Guo, Diana Buttz, Enrico Vezzetti, Garth Grover, Huaijun Wu, Markus Werner, Olaf Dambon, Patrick Saxton, Sang-bum Hong, Xiaorong Xu and Zubin Irani. Special thanks to David Guo for being a great friend.
Finally, I would like to thank my parents, C.V. Avadhani and C. Prasanna, for all their love a*d encouragement, without which this work would not have been possible.
Table of Contents
Abstract ... 2 Acknowledgem ents ... 3 Table of Contents ... 4 List of Figures ... 7 List of Tables... 12 1 Introduction ... 131.1 Three Dim ensional Printing... 13
1.2 M otivation and objective ... 14
1.3 Previous work ... 15
1.4 Organization of this work ... 16
2 Insulation Experim ents... 17
2.1 Sm all scale furnace... 17
2.2 Effect of Silica in the heater plates... 19
2.3 Other considerations... 21
2.4 Sum m ary ... 24
3 Design of a Debinding Apparatus ... 25
3.1 Current practice... 25
3.2 Design of a debinding apparatus... 27
3.2.1 Determ ination of the annular clearance ... 28
3.2.2 Testing the design... 29
3.3 Im proved design... 32
3.4 Sum m ary...33
4 Directional Solidification... 34
4.1. Porosity ... 34
4. 1. 1. Problem s associated with porosity... 34
4.1.2. Causes of porosity ... 34
4.1.3. Experim ents to study and m inim ize porosity ... 35
4.2. Design of experim ent ... 36
4.2.1. Hypothesis...36
4.2.3. D eterm ination of cooling gas flow rate... 38
4.3. D irectional solidification experim ents ... 41
4.3.1. Initial efforts ... .41
4.3.2. Reverse directional solidification... 41
4.3.3. M odeling surface porosity... 43
4.3.4. Tem perature profiles ... 45
4.4. Sum m ary ... 49
5 Design and Fabrication of the Large Scale Furnace ... 50
5.1. Therm al design... 50
5.1.1. Estim ating steady state heat losses... 50
5.1.2. Estim ating ram p up and total power requirem ent ... 52
5.1.3. Selection of internal heaters ... 55
5.2. Furnace shell and external features... 55
5.2.1. External strip heaters... 57
5.2.2. Fittings on the shell ... 57
5.2.3. Furnace D oors and heat shields... 58
5.2.4. Pow er connections to internal heaters... 59
5.3. Insulation... 62
5.3.1. Initial efforts ... 62
5.3.2. Polym er spray... 64
5.3.3. N extel thread and Inconel m esh ... 65
5.3.4. Initial testing... 66
5.3.5. Choice of extra insulation m aterial ... 69
5.4. Sum m ary ... 73
6 Electrical, G as and Safety System s... 74
6.1 Electrical system s ... 74
6.1.1 Pow er supply ... 74
6.1.2 W iring schem e for external heaters... 76
6.1.3 Controller ... 79 6.1.4 Internal heaters ... 81 6.1.5 Blow er ... 84 6.1.6 G as solenoids... 85 6.2 G as system s...85 6.3 Safety system s ... 89 6.4 Conclusion... 92 7 Furnace Testing ... 93
7.1 Initial furnace runs ... 93
7.2 D eterm ining an optim al furnace run ... 94
7.2.1 Furnace runs for obtaining oxide free parts ... 95
7.2.2 Other ram p schem es ... 98
7.2.3 D ew point sensing ... 101
7.3 Tw o zone control schem e and tem perature profiling... 102
7.3.1 Experim ents w ith tw o zone control... 102
7.4 Sum m ary ... 109
8 Conclusion and Future W ork... 111
8.1 Sum m ary of achievem ents ... 111
8.2 Recom m endations for future w ork... 113
A ppendix 1: List of V endors... 114
A ppendix 2: Furnace Part D raw ings ... 119
A ppendix 3: Sam ple Program for the Large Scale Furnace... 159
Appendix 4: Using a Nextel Lined SS Crucible for Infiltrating Parts ... 161
List of Figures
Chapter 1
FIGURE 1.1: SCHEMATIC SHOWING STEPS INVOLVED IN THE THREE DIMENSIONAL PRINTING PROCESS... 13 FIGURE 1.2: SCHEMATIC SHOWING THE POST PROCESSING STEPS CARRIED OUT ON A GREEN PART. ... 14 FIGURE 1.3: SMALL SCALE FURNACE BUILT AT M IT. ... 16 Chapter 2
FIGURE 2.1: SCHEMATIC OF THE SMALL SCALE FURNACE SHOWING VARIOUS FEATURES... 17 FIGURE 2.2: PICTURE OF THE SMALL SCALE FURNACE DEVELOPED AT MIT. ... 18 FIGURE 2.3: DEW POINT VS. TIME: PURGE AT ROOM TEMPERATURE FOR TWO HOURS FOLLOWED BY A RAMP
T O 12 0 0 C ... 19 FIGURE 2.4: DEW POINT VS. TIME: SOAK AT 200 C UNTIL DEW POINT GOES TO -25 C, THEN RAMP TO 1200 C. ... 2 0
FIGURE 2.5: COMPARISON OF MOISTURE RELEASE AT TEMPERATURES ABOVE 900 C: LOW VS. HIGH
A L U M IN A H E A T E R S . ... 2 1
FIGURE 2.6: PARTS SINTERED IN THE SMALL SCALE FURNACE: (A) WITH NO BAND HEATERS, RAMP TO 1200 C, FORMING GAS ATMOSPHERE, LOW ALUMINA HEATERS (B) WITH BAND HEATERS, SOAK AT 200 C, THEN RAMP TO 1200 C, FORMING GAS ATMOSPHERE, LOW ALUMINA HEATERS (C) SAME AS 2.6B,
EXCEPT THAT ATMOSPHERE IS SWITCHED FROM FORMING GAS TO ARGON AT 600 C (D) SAME AS 2.6B, EXCEPT THAT THE HEATERS IN THE FURNACE HAVE A HIGH ALUMINA CONTENT. ... 22
FIGURE 2.7: SCHEMATIC OF THE SET UP FOR THE VACUUM TEST CARRIED OUT USING THE SMALL SCALE F U R N A C E ... 2 3
Chapter 3
FIGURE 3.1: SCHEMATIC SHOWING THE CONCEPT OF A DEBINDING CHAMBER. NOTE THAT THE ANNULAR CLEARANCE BETWEEN THE EFFLUENT TUBE AND THE HOLE IN THE GRAPHITE LID, T =1/2(D-D)... 25 FIGURE 3.2: SCHEMATIC SHOWING GAS FLOW INTO THE FURNACE AND TWO POSSIBLE EXIT PATHS FOR
OUTGOING GAS: ONE THROUGH THE ANNULAR GAP AND OUT THROUGH THE EFFLUENT TUBE AND THE
OTHER THROUGH THE REGULAR OUTLET 01. ... 26 FIGURE 3.3: SCHEMATIC SHOWING AN INCREASE IN THE EFFECTIVE ANNULAR GAP BETWEEN THE TUBE
AND THE HOLE DUE TO M ISALIGNM ENT. ... 30 FIGURE 3.4: PICTURE OF A SS TRUSS THAT WAS SUCCESSFULLY DEBOUND AND SINTERED USING THE
D E SC R IB E D SE T U P ... 3 1
FIGURE 3.5: SIMPLIFIED SCHEMATIC OF A MODIFIED FLOW METER. SUCH A FLOW METER, WHEN MOUNTED AT OUTLET 01 OF THE FURNACE CAN BE USED TO MAINTAIN CONSTANT PRESSURE INSIDE THE
FURNACE DURING THE ENTIRE FURNACE CYCLE WITHOUT USER INTERVENTION... 32 Chapter 4
FIGURE 4.1: SCHEMATIC SHOWING IMPORTANT DIMENSIONS OF THE TEST PART. ... 35 FIGURE 4.2: ILLUSTRATION OF THE SPLIT MOLD CONCEPT: PRE SINTERED METAL CHUNKS ON THE OUTSIDE
HOLD THE TWO HALVES OF THE MOLD TOGETHER. ... 36 FIGURE 4.3: (A) SCHEMATIC SHOWING DIMENSIONS CHOSEN FOR THE TEST PART (LEFT) AND, (B) PICTURE
O F TH E TE ST PA R T (R IG H T )... 38 FIGURE 4.4: HEAT AND GAS FLOW DIRECTIONS, ASSUMING ONE DIMENSIONAL HEAT TRANSFER... 39 FIGURE 4.5: PICTURES A, B AND C ARE FROM THE CROSS SECTION OF A DIRECTIONALLY SOLIDIFIED PART.
SOLIDIFICATION. THE PARTICLES ARE SS, AND THE FILLER IS BRONZE. PORES ARE SEEN AS BLACK S P O T S . ... 4 2
FIGURE 4.6: SCHEMATIC SHOWING A SHRINKAGE CAVITY FORMED NEAR THE SURFACE OF A COOLING
PART. IF THE PRESSURE DIFFERENCE ACROSS THE INFILTRANT FILM AT THE SURFACE IS TOO HIGH, THE FILM MIGHT RUPTURE GIVING RISE TO SURFACE POROSITY... 44
FIGURE 4.7: APPROXIMATION SHOWING THE CROSS SECTION OF A CHANNEL THAT THE LIQUID INFILTRANT COULD FLOW THROUGH TO REACH A SHRINKAGE CAVITY AND FILL IT... 44
FIGURE 4.8: SCHEMATIC SHOWING THE TWO HOLES THAT WERE DRILLED INTO A PART TO DO
TEMPERATURE PROFILING INSIDE THE PART. ... 46
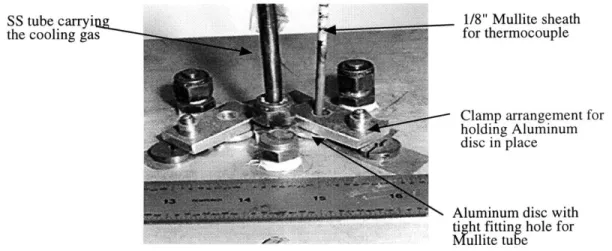
FIGURE 4.9: CROSS SECTION OF MULLITE SHEATH USED FOR THE TYPE K PROFILING THERMOCOUPLE. .... 46 FIGURE 4.10: PICTURE OF THE SET UP USED FOR TEMPERATURE PROFILING. NOTE THE MULLITE SHEATH
AN D THE A LU M IN UM CLAM PS. ... 47
FIGURE 4.11: GRAPH SHOWING THE VARIATION OF TEMPERATURE INSIDE AN INFILTRATED PART WITH AND
WITHOUT COOLING GAS. THE COOLING GAS INDUCES A GRADIENT OF AROUND 5 C/CM IN THE PART. THE 1200 C IN THE LEGEND INDICATES THE FURNACE THERMOCOUPLE READING IN STEADY STATE.. 48
FIGURE 4.12: TEMPERATURE PROFILE MEASURED IN A COOLING PART. A POSITIVE GRADIENT INDICATES
THAT THE TOP IS COOLER THAN THE BOTTOM. NOTE THE EFFECT THE COOLING GAS FLOW HAS ON THE
GRADIENT. THE SHARPLY INCREASING TEMPERATURE GRADIENT SEEN AT T=O IS A TRANSIENT CAUSED BY TURNING THE COOLING GAS ON 15 SEC BEFORE T=0. ALSO SHOWN IN THE GRAPH IS THE FU RN A CE TEM PER A TU R E ... 49
Chapter 5
FIGURE 5.1: SCHEMATIC SHOWING DIMENSIONS OF THE HOT FACES OF THE INSULATION THAT GOES INTO
THE SMALL SCALE FURNACE. THESE DIMENSIONS WERE USED TO CALCULATE THE AREA OF THE HOT
Z O N E O F T H E FU R N A C E ... 5 1 FIGURE 5.2: RESISTANCE TO HEAT TRANSFER FROM THE HOT ZONE THAT IS AT 1200 C TO THE AMBIENT
ATMOSPHERE. HEAT TRANSFER INVOLVES CONDUCTION THROUGH THE INSULATION, CONDUCTION THROUGH THE ALUMINUM SHELL AND CONVECTION TO THE ATMOSPHERE... 51 FIGURE 5.3: SCHEMATIC SHOWING DEAD SPACE BETWEEN THE PART PISTON AND THE INSULATION.
DIMENSIONS OF THE INSULATION WERE ESTIMATED BY ASSUMING VALUES FOR THE DEAD SPACE BETWEEN THE PISTON AND THE HOT FACE OF THE INSULATION. THE DIMENSIONS THUS OBTAINED
WERE USED TO DETERMINE STEADY STATE HEAT LOSSES BY SCALING UP THOSE FROM THE SMALL
SCALE FURNACE BASED ON THE AREA OF INSULATION EXPOSED TO 1200 C. ... 52 FIGURE 5.4: PICTURE OF THE LARGE SCALE FURNACE. NOTE THE STRIP HEATER AND THE VIEW PORTS ON
T H E F R O N T D O O R ... 54
FIGURE 5.5: PICTURE SHOWING A TOP VIEW OF THE FURNACE SHELL. NOTE THE QF40 FITTINGS AND THE
THERM OCOUPLE FEEDTHROUGHS ... 56 FIGURE 5.6: COMPARISON OF THE TWO KINDS OF DOORS THAT CAN BE USED WITH THE FURNACE. THE LEFT
DOOR IS FOR USE DURING TEMPERATURE PROFILING AND THE RIGHT DOOR WITH THE VIEWPORTS IS FOR USE DURING REGULAR FURNACE RUNS. ... 58 FIGURE 5.7: PICTURE OF THE FURNACE FITTED WITH A DOOR USED FOR TEMPERATURE PROFILING. THE
DOOR HAS SIX PORTS FOR INSERTING THERMOCOUPLES INTO THE FURNACE. THE THERMOCOUPLES
CAN BE USED TO MEASURE THE TEMPERATURE INSIDE THE FURNACE AS A FUNCTION OF THE
D ISTA N C E FR O M TH E D O O R ... 59 FIGURE 5.8: PICTURE SHOWING AN INTERNAL HEATER WITH ITS LEADS BRAZE JOINED TO BRASS TUBES.
THE HEATER LEADS STICK " INTO THE BRASS TUBES. THE BRAZE IS A SILVER-COPPER EUTECTIC... 60
FIGURE 5.9: PICTURE SHOWING THE BRAZE JOINT BETWEEN THE HEATING ELEMENT AND THE BRASS TUBE. ONCE OUTSIDE THE HEATER PLATE, THE HEATING ELEMENT IS DOUBLE TWISTED TO REDUCE
RESISTIVE HEATING. THIS KEEPS THE BRAZE JOINT COOL... 60 FIGURE 5.10: PICTURE SHOWING THE SWAGELOK FITTING AND TEFLON SLEEVE ASSEMBLY THAT WAS
TESTED AS A POSSIBLE CANDIDATE FOR USE AS A POWER FEEDTHROUGH. ... 61 FIGURE 5.11: PICTURE SHOWING CREEP IN THE TEFLON SLEEVE THAT WAS USED IN A SWAGELOK FITTING
AND MAINTAINED AT 200 C FOR A FEW HOURS ... 61 FIGURE 5.12: ULTEM FITTING WHICH WAS USED AS A POWER FEEDTHROUGH FOR HEATER WIRES... 62 FIGURE 5.13: PICTURE DEMONSTRATING HOW A SILICONE TUBE CAN BE USED TO ACHIEVE A LEAK PROOF
FIGURE 5.14: PICTURE SHOWING THE POWER FEEDTHROUGH ASSEMBLY. THE WIRE FROM THE SCR IS CONNECTED TO THE BRASS TUBE BY A BRASS CONNECTOR. THE ULTEM FITI'ING IS SCREWED INTO
TH E A LU M IN U M STA N D O FF... 63 FIGURE 5.15: DRAWING OF THE BRASS CONNECTOR USED TO CONNECT A WIRE FROM THE SCR TO A BRASS
TUBE THAT IS BRAZED TO A HEATER LEAD. HOLES A AND B IN THE DRAWING ARE CLEARANCE HOLES
FOR 8-32 AND 6-32 SCREW S RESPECTIVELY... 63 FIGURE 5.16: SCHEMATIC SHOWING A SECTION THROUGH AN ALUMINUM STANDOFF ON THE FURNACE
WALL. THE MULLITE TUBE INSIDE THE STANDOFF IS TO PREVENT THE HEATER WIRE FROM TOUCHING T H E A LU M IN U M SH ELL . ... 64
FIGURE 5.17: PICTURE OF THE RESULTS OF FIRING INSULATION SPRAYED WITH RHOPLEX TO 1200 C. THE INSULATION ON THE LEFT WAS RAMPED TO 1200 C AT 5 C/MIN STARTING AT ROOM TEMP., WHILE
THAT ON THE RIGHT WAS HELD IN THE FURNACE AT 500 C FOR AN HOUR BEFORE RAMPING TO 1200 C
AT 5 C/MIN. THE IDEA WAS TO GIVE TIME FOR COMPLETE POLYMER BURNOUT AT 500 C BEFORE
RAMPING TO 1200 C. BOTH THESE RESULTS WERE UNACCEPTABLE. ... 66 FIGURE 5.18: PICTURE SHOWING ALUMINA INSULATION SEWN TOGETHER ALONG THE PERIPHERY USING
N E X T E L T H R E A D ... 67 FIGURE 5.19: INTERIOR OF FURNACE. INCONEL WIRE MESH SUPPORTS THE INSULATION ON THE TOP, BACK, AND FRONT FACES OF THE FURNACE. NEXTEL SLEEVE ON THE PERIPHERY OF THE FRONT INSULATION
PROTECTS IT FROM BEING DAMAGED WHEN THE FURNACE IS BEING LOADED/UNLOADED. ALSO NOTE HOW THE HEATERS ARE MOUNTED ON THE INCONEL SUPPORTS. ... 68 FIGURE 5.20: SCHEMATIC SHOWING A SECTION THROUGH THE ENCLOSURE THAT WAS BUILT AROUND A
SINGLE HEATER. THIS HEATER WAS POWERED BY A VARIAC AND THE VOLTAGE REQUIRED TO A-TTAIN A STEADY STATE TEMPERATURE OF 1200 C INSIDE THE ENCLOSURE WAS FOUND AS A FUNCTION OF
THE QUANTITY OF INSULATION ON THE 9" BY 7" FACE OPPOSITE THE HEATER PLATE... 68 FIGURE 5.21: DEW POINT INSIDE THE FURNACE VS. TIME FOR A SAMPLE OF ALUMINA INSULATION FIRED IN
THE TUBE FURNACE. NOTE THE HUMPS IN DEW POINT WHEN THE FURNACE TEMP. IS 400 AND 600 C. 70
FIGURE 5.22: DEW PT. VS. TIME FOR THE EMPTY FURNACE. THIS IS A CONTROL RUN. NOTE THE ABSENCE
OF HUM PS IN DEW POINT UNLIKE IN FIGURE 5.21... 71 FIGURE 5.23: DEW PT. VS. TIME FOR A RUN WITH GRAPHITE INSIDE THE FURNACE. NOTE THAT THE
AVERAGE DEW POINT LEVEL IS FAR LESS THAN THAT FOR ALUMINA ( FIGURE 5.21). ALSO, HUMPS IN DEW POINT ARE NOT AS PROMINENT AS IN FIGURE 5.21. ... 72 FIGURE 5.24: PICTURE SHOWING THE " GRAPHITE INSULATION THAT GOES BEHIND THE 1" ALUMINA
INSULATION. ALSO SEEN IN FRONT OF THE ALUMINA INSULATION ON THE DOOR IS A SECOND LAYER
OF " GRAPHITE INSULATION, WHOSE PURPOSE IS TO PREVENT ANY LEAKING HOT GAS FROM
REACHING THE ALUMINUM SHELL AND TO ACT AS A GETITERING AGENT. ... 73 Chapter 6
FIGURE 6.1: CONVENTION USED FOR REPRESENTING WIRES IN ALL WIRING DIAGRAMS IN THIS CHAPTER. 74 FIGURE 6.2: SCHEMATIC SHOWING WIRING FROM THE 240 V AC SOURCE TO THE 120 V AC BUS USED TO
POWER THE CONTROLS OF THE FURNACE. ALSO SHOWN IN THE FIGURE IS THE WIRING OF THE BLOWER THAT SHALL BE DISCUSSED IN SECTION 6.1.5 ... 75 FIGURE 6.3: FIGURE SHOWING WIRING OF THE 24 V DC POWER SUPPLY (ON THE LEFT). ALSO SHOWN IN
THE FIGURE ON THE RIGHT IS A SCHEMATIC OF THE CONTROLLER PINS, TO BE DISCUSSED LATER... 76
FIGURE 6.4: WIRING DIAGRAM FOR THE 24 V AC POWER SUPPLIES THAT ARE USED TO POWER THE SCR
FIRING CARDS, WHOSE WIRING SCHEMATIC IS SHOWN ON THE RIGHT. THE FIRING CARDS ARE
PHYSICALLY M OUNTED ON TO THE SCRS. ... 77 FIGURE 6.5: WIRING DIAGRAM FOR RELAY R1 THAT TURNS BANK 1 OF EXTERNAL HEATERS ON/OFF. ALSO
SE E F IG U R E 6 .7 ... 7 8 FIGURE 6.6: WIRING DIAGRAM FOR RELAY R2 THAT TURNS BANK 2 OF EXTERNAL HEATERS ON/OFF. ALSO
SE E F IG U R E 6 .7 ... 7 9 FIGURE 6.7: WIRING DIAGRAM FOR THE ELEVEN EXTERNAL HEATERS. ALSO SEE FIGURE 6.5 AND FIGURE
6 .6 . ... 8 0 FIGURE 6.8: SCHEMATIC SHOWING RELATIVE POSITIONS OF THE INTERNAL HEATER PLATES AND POWER
CONNECTIONS TO EACH PLATE. SEE FIGURE 6.9 FOR DETAILS ON HOW THE HEATERS ARE HOOKED TO
FIGURE 6.9: SCHEMATIC OF WIRING BETWEEN THE SCRS AND THE HEATERS. ALSO SEEN IN THE FIGURE
ARE THE CONTROL SIGNALS TO THE SCRS. SEE FIGURE 6.10 FOR SCHEMATIC OF WIRING FROM 240 V
A C SU PPL Y T O S C R S. ... 83 FIGURE 6.10: WIRING FROM THE 240 V AC SUPPLY TO THE SCRS. THE CONTACTOR IS TURNED ON/OFF BY A
120 V A C SIG N A L ... 84
FIGURE 6.11: SCHEMATIC OF THE WIRING OF THE POTENTIOMETERS THAT CAN BE USED TO TRIM THE VOLTAGE SIGNAL GOING TO THE SCRS. THE CONTROLLER GIVES A 4-20 MA SIGNAL THAT IS
CONVERTED TO A VOLTAGE SIGNAL USING THE RESISTOR R. ... 85 FIGURE 6.12: SCHEMATIC OF ALL THE RESISTANCES IN PARALLEL WITH EACH OTHER AS SEEN FROM THE
CONTROLLER'S OUTPUT TERMINALS 43 AND 44. THE IDEA IS TO DETERMINE R THAT WILL CAUSE THE
EQUIVALENT RESISTANCE ACROSS PINS 43 AND 44 TO BE 0.3 K ... 86 FIGURE 6.13: WIRING DIAGRAM FOR RELAY 356CR WHICH IS USED TO CLOSE (OPEN) THE NO ARGON
SOLENOID WHILE SIMULTANEOUSLY OPENING (CLOSING) THE NC FORMING GAS SOLENOID... 87 FIGURE 6.14: SCHEMATIC OF THE GAS SYSTEM USED IN THE FURNACE. THERE ARE TWO POSSIBLE
ATMOSPHERES THE FURNACE HAS BEEN SET UP TO RUN IN: ARGON AND FORMING GAS. ... 88 FIGURE 6.15: SCHEMATIC OF THE GAS FLOW LINE FROM THE FURNACE OUTLET TO THE EXHAUST DUCT... 89 FIGURE 6.16: SCHEMATIC OF THE WIRING OF SAFETY SWITCHES IN SERIES. THE SWITCHES CARRY THE 120
V AC CONTROL SIGNAL TO THE CONTACTOR, 258CON, THAT TURNS ON POWER TO THE INTERNAL H E A T E R S . ... 9 0
FIGURE 6.17: SCHEMATIC OF THE FLOW ALARM'S PINS. SWITCH S3 IS NORMALLY CLOSED. THE FLOW
ALARM SENSOR BODY IS MOUNTED ON THE FLOW METER, WHILE THE CIRCUIT BOARD IS MOUNTED ON T H E FU R N A C E FR A M E ... 9 1
FIGURE 6.18: WIRING DIAGRAM FOR THE OVERTEMP. BUZZER ALARM WHICH GETS ACTIVATED BY AN
ALARM SIGNAL FROM THE OVERTEMP. CONTROLLER. THE SPRING LOADED PUSHBUTTON, WHEN PRESSED , SILENCES THE ALARM ... 91 Chapter 7
FIGURE 7.1: GRAPH SHOWING THE RESPONSE OF THE FURNACE TO A STEP CHANGE IN SET POINT FROM 1180 C TO 1200 C. THE ABSENCE OF ANY SIGNIFICANT OVERSHOOT IN THE RESPONSE SHOWS GOOD
C O N T R O LLER A C T IO N . ... 94
FIGURE 7.2: GRAPH SHOWING THE RESPONSE OF THE FURNACE TO A STEP CHANGE IN SET POINT FROM 800 C TO 780 C. THE ABSENCE OF ANY SIGNIFICANT OVERSHOOT IN THE RESPONSE SHOWS GOOD
CO N TR O LLER A CTIO N . ... 95 FIGURE 7.3: DEW POINT CURVE FOR A FURNACE RUN (RUN 1) CONDUCTED USING THE SCHEME DESCRIBED IN THE TEXT. NOTE THAT THE PURGING TIME (REGIONS 1 AND 2) IS AROUND 4 HOURS. COMPARE THIS
WITH RUN 2 IN FIGURE 7.5, WHERE THE PURGE TIME IS 3 HOURS. ... 96 FIGURE 7.4: PICTURE OF THE SS420 PART THAT WAS SUCCESSFULLY SINTERED IN THE FURNACE USING THE SCHEME DESCRIBED IN SECTION 7.2.1. THE DEW POINT CURVE FOR THIS RUN IS SHOWN IN FIGURE 7.3.
... 9 7 FIGURE 7.5: DEW POINT CURVE FOR RUN 2, CONDUCTED RIGHT AFTER RUN 1 WHOSE DEW POINT CURVE IS
SHOWN IN FIGURE 7.3. THE FURNACE WAS OPENED FOR 40 MINUTES AFTER IT COOLED DOWN TO
ROOM TEMPERATURE AT THE END OF RUN 1, BEFORE STARTING RUN 2. NOTE THAT THE PURGING TIME FOR THIS RUN IS AROUND 3 HOURS AS OPPOSED TO 4 HOURS FOR RUN 1... 98 FIGURE 7.6: DEW POINT CURVE FOR RUN 5. THE BOTTOM ZONE OF INTERNAL HEATERS WAS KEPT ON WITH A SET POINT OF 200 C DURING THE PURGE IN ORDER TO QUICKLY HEAT UP THE INSIDE AND SPEED UP
THE M OISTURE REM OVAL PROCESS. ... 99 FIGURE 7.7: DEW POINT CURVE FOR RUN 6. THE GAS FLOW RATE IN THIS RUN WAS 30 SCFH AS OPPOSED TO
THE 13 SCFH USED IN RUN 5. NOTE THAT THE PURGE TIME IN THIS RUN IS 122 MINUTES, MORE THAN
60 MINUTES LOWER THAN THAT IN RUN 5, WHOSE DEW POINT CURVE IS SHOWN IN FIGURE 7.6. ... 100 FIGURE 7.8: PICTURE OF A SS 420- COPPER PART THAT WAS INFILTRATED SUCCESSFULLY DURING RUN 6.
THE DEW POINT CURVE OF THE CYCLE USED IN RUN 6 iS SHOWN IN FIGURE 7.7. THE PART WAS
SUSPENDED INSIDE THE FURNACE USING THE 1/8" DIAMETER MOLY. ROD SEEN IN THE PICTURE, AND
DIPPED INTO THE COPPER MELT ONLY AFTER ALL THE COPPER HAD MELTED AND STEADY STATE HAD
BEEN A T TA IN ED A T 1200 C ... 10 1 FIGURE 7.9: PICTURE OF THE FURNACE FITTED WITH THE DOOR USED FOR TEMPERATURE PROFILING... 103
FIGURE 7.10: SCHEMATIC OF A SECTION THROUGH THE FURNACE, AS SEEN FROM THE SIDE. PROFILING
WAS DONE FOR X=0 TO X=18.5" ALONG THE FURNACE DEPTH AT EACH OF THE SIX PORTS SHOWN IN
FIGURE 7.9. THE FRONT, MIDDLE AND REAR HEATER PLATES ARE RESPECTIVELY 6", 8" AND 6" LONG AND ROUGHLY EXTEND FROM THE FRONT INSULATION TO THE REAR INSULATION. ... 104
FIGURE 7.11: SCHEMATIC SHOWING THE RELATIVE LOCATION OF THE THERMOCOUPLE PORTS ON THE
FR O N T D O O R . ... 105
FIGURE 7.12: TEMPERATURE PROFILES OBTAINED ALONG THE DEPTH OF THE FURNACE AT EACH OF THE
SIX PORTS SHOWN IN FIGURE 7.11. NOTE THAT THE TEMPERATURE IS IN A 5 C BAND OVER THE
LENGTH OF THE HEARTH PLATE. ... 106 FIGURE 7.13: TEMPERATURE PROFILES OBTAINED AT PORT 2 AS PART OF THE TRIMMING EXPERIMENT
CARRIED OUT TO TRY AND SMOOTH OUT THE TEMPERATURE PROFILE INSIDE THE FURNACE... 107
FIGURE 7.14: TEMPERATURE PROFILE ALONG THE HEIGHT OF THE FURNACE, MEASURED USING A PORT IN
THE MIDDLE OF THE TOP FACE OF THE FURNACE. NOTE THE TIGHT 2 C BAND THE TEMPERATURE IS IN O V E R A 14 " H E IG H T . ... 10 8
List of Tables
Chapter 2
TABLE 2.1: FURNACE PRESSURE VS. TIME. A VACUUM WAS PULLED INTO A "SEALED" FURNACE AND THE PRESSURE RISE AS A FUNCTION OF TIME WAS USED TO QUANTIFY LEAKS INTO THE FURNACE... 23
Chapter 5
1 Introduction
1.1 Three Dimensional Printing
Three dimensional printing (3DP) is a rapid prototyping process that forms parts directly from a computer model by joining powdered material with a binder. A thin layer of powder is spread and is selectively joined by a binder deposited using ink jet printing technology. The powder bed is then lowered, another powder layer is spread and binder is deposited to print the next cross section. This process is repeated until the whole part is generated. Figure 1.1 shows the steps involved in 3DP. The part thus obtained is called a green part. 3DP is fast and flexible, allowing the use of different material and binder systems.
4rr.
Sprea( Podtr Print Lajpr Drop Pistn
Repeat Cycd
termeAte maV Last LaWp Priael Fisk( Prt
Figure 1.1: Schematic showing steps involved in the Three Dimensional Printing process.
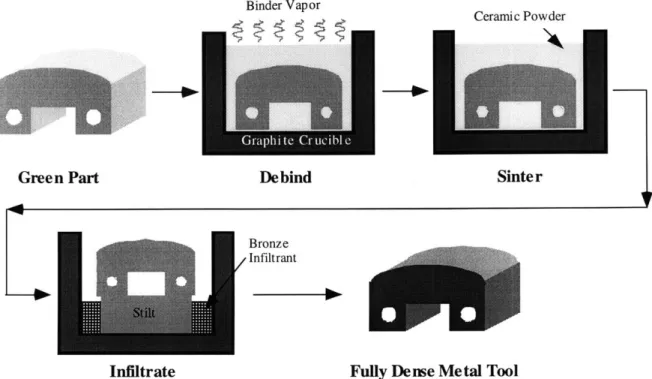
The green part is delicate and must undergo further processing before it can be used. The green part has 60% metal powder by volume, and the rest is void space. The binder is burned out in a furnace where the part also undergoes light sintering. The part is then sintered and infiltrated with a low melting point alloy to fill the porosity. Figure 1.2 shows the post processing steps.
Binder Vapor
Ceramic Powder
Green Part Debind Sinter
Bronze Infiltrant
Infiltrate Fully Dense Metal Tool
Figure 1.2: Schematic showing the post processing steps carried out on a green part. 1.2 Motivation and objective
Existing furnaces such as the MRF furnace currently being used to post process 3D printed parts at MIT are expensive. The MRF furnace is capable of holding a vacuum and running in a pure hydrogen atmosphere. Scaling up this furnace would be very expensive since the cost of components such as heating elements, heat shields, vacuum pumps, and shell wall capable of withstanding vacuum increase rapidly with size.
The primary focus of this research is on developing a post-processing furnace that can be scaled up economically.
Interconnected porosity in 3D printed parts is a phenomenon that needs to be understood and eventually eliminated. Porosity that is connected is not desirable since it causes cooling channels in 3D printed injection molding tooling to leak. It is believed that porosity occurs due to solidification shrinkage, trapped gases and evolution of gases from the infiltrant melt during solidification. Previous work has tried to investigate some of these issues: however, to date, leak free molds have not been obtained. Lack of a custom furnace has impeded a comprehensive investigation of the porosity issue. One of the objectives of this work is to develop a custom furnace and equip it with features needed to conduct experiments to identify and control
parameters affecting porosity. Experiments include gated infiltration and directional solidification. Gated infiltration refers to separating the molten infiltrant from the sintered skeleton until a gate is opened. Directional solidification involves inducing a temperature gradient in a cooling part such that infiltrant in different zones of the part solidifies at different points in time.
Currently, MIT uses two separate MRF furnaces for post processing: one for debinding the green part and the other for sintering and infiltrating it. The furnace used for debinding gets contaminated with condensed vapors of the polymeric binder thus making it unsuitable to be used for sintering or infiltration. Hence, a separate furnace is needed for sintering and infiltration. Great savings in capital cost could be achieved if one furnace could be used for all three post-processing steps. This work also develops a method by which the same furnace can be used for all the post processing steps.
1.3 Previous work
Previous work on scalable furnace processing was done at the MIT 3D printing lab by Adam Lorenz [4]. Lorenz built and tested a series of experimental furnaces in order to come up with a design for an economical furnace. The design consisted of a gas tight outer shell, Alumina insulation and metallic-heating elements embedded in ceramic heater plates. It used a forming gas atmosphere instead of pure Hydrogen or a vacuum in order to achieve significant cost savings. MIT then hired a furnace manufacturing company, C.I. Hayes of Providence, RI, to build a large scale furnace. However, this furnace failed to provide a proper atmosphere for sintering (resulting in oxidized parts), necessitating a review of some of the design elements. The furnace built by Hayes used 3" of Alumina board as insulation. It was found that the board released water vapor even when the furnace was at 1200 C. This was because insulation away from the shell did not get hot enough to expel moisture even when the inside of the furnace was at 1200 C. Moreover, the board had silica-based binder that decomposed and contaminated the furnace atmosphere at high temperatures. As part of a revised design, the board was replaced by high Alumina content (95%) blanket insulation. In order to expel moisture out of the insulation more effectively, it was decided that the shell might need to be heated from the outside. In order for the outside heating to be effective, the shell material was changed from SS to Aluminum, a
better thermal conductor. These design changes were incorporated in a small scale prototype furnace consisting of an aluminum shell, alumina insulation and Kanthal heaters (Figure 1.3).
Figure 1.3: Small scale furnace built at MIT.
This research is aimed at optimizing the small scale furnace to yield good quality parts, and using the parameters thus obtained to build and test a large scale furnace, which in addition to demonstrating scalability could be used to conduct experiments on porosity.
1.4 Organization of this work
This work is organized into seven chapters. The second chapter deals with experiments conducted on Alumina insulation to understand its moisture release properties as a function of temperature. It also explains how the small scale furnace was optimized to obtain oxide free parts. Chapter three explains the design of a debinding mechanism that was successfully built and tested in the small scale furnace. Chapter four describes experiments on directional solidification conducted mainly on the SS420-Bronze material system using the small scale furnace. Chapter five deals with the mechanical and thermal system design of the large scale furnace. A lot of the design parameters used were obtained experimentally. Chapter six deals with the electrical, gas and safety systems of the large scale furnace. It gives a detailed description of the control and wiring scheme of the furnace. Chapter seven describes furnace testing and optimization. Finally, chapter eight summarizes this work and lays ground for future work using the furnace built in this work.
2 Insulation Experiments
This chapter describes how a previously developed small scale furnace was optimized to yield oxide free parts. Doing this involved a series of experiments conducted to study the moisture content inside the furnace as a function of temperature.
2.1 Small scale furnace
View ports Graphite insulation 0 Ring A lumina insulation Kanthal heaters Aluminum shell SS leg Gas inlet Power feedthroughs _
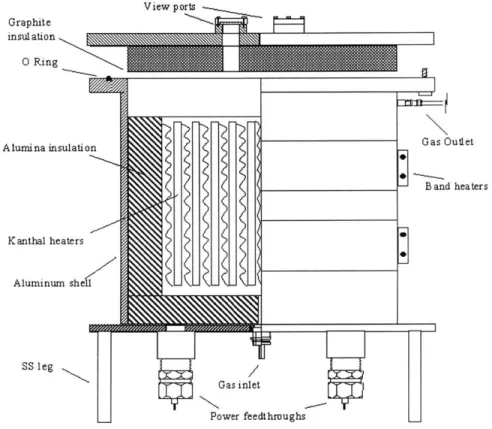
Figure 2.1: Schematic of the small scale furnace showing various features.
The small scale furnace (Figures 2.1 and 2.2) was designed to have an operating temperature of 1200 C on the inside and a shell temperature of 200 C in steady state. An inch of high purity (95%) Alumina insulation was used to achieve this. The furnace would run in Forming gas (95% Argon and 5% Hydrogen) and a volume flow rate of five volume changes an hour was considered enough to prevent oxidation of stainless steel (SS) parts.
Gas Outlet
A typical sintering run involves soaking the SS part at 1200 C for an hour. When the
furnace was ramped to 1200 C at 5 C/min starting at room temperature, it was found that the parts got oxidized during sintering.
Figure 2.2: Picture of the small scale furnace developed at MIT.
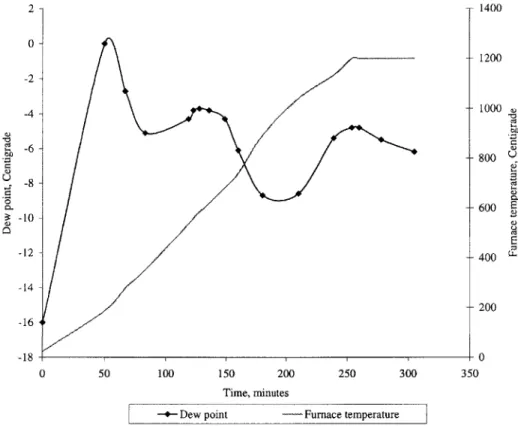
This was because moisture was being released from the hygroscopic Alumina insulation even when the furnace was at 1200 C, at which temperature SS was most susceptible to oxidation. In order to overcome this problem, the furnace was purged at room temperature for two hours before ramp up until the dew point reached a sufficiently low value (-25 C). However, as soon as ramp up started, the dew point shot up to high levels (Figure 2.3). Clearly, moisture was being expelled out of the insulation as the insulation got heated up. Also, the outer parts of the insulation did not reach 100 C or above until the inside was around 1000 C. Thus water was continued to be expelled even when the furnace temperature was in a region where steel was most susceptible to oxidation (the reactivity follows an Arrhenius temperature dependence). No doubt, the part was oxidized (Figure 2.6a). In order to overcome this problem, two band heaters were mounted around the shell of the furnace. These were provided with thermostats to control the shell temperature at 200 C. The idea was to turn the internal heaters and the external heaters on at a set point of 200 C and purge the furnace with forming gas at five volume changes an hour until the dew point got to -25 C. This would ensure that all the insulation soaked at 200 C and thus any water in the insulation would be expelled before the ramp to 1200 C started.
This method worked and produced a part that was much cleaner than that produced in the previous run (Figure 2.6b). Figure 2.4 shows the dew point as a function of time in one such run. It is interesting to note that the dew point starts going up when the ramp begins and peaks when the furnace is at around 480 C before starting to down again. Another interesting fact is that the dew point begins to rise as the furnace temperature goes past 900 C. This behavior can also be seen in figure 2.3. Since the entire vapor from the Alumina insulation had been expelled by this time, some other phenomenon was taking place at furnace temperatures above 900 C.
2 - 1400 0 -1200 -2 4 -- 1000 -6 -800 U -8--600 E -10 -60 -12 -400 -14 200 -16 -18- 0 0 50 100 150 200 250 300 350 Time, minutes
-+- Dew point - Furnace temperature
Figure 2.3: Dew point vs. time: purge at room temperature for two hours followed by a ramp to 1200 C.
2.2 Effect of Silica in the heater plates
Clearly, a chemical reaction was taking place at temperatures above 900 C. A closer look
at the heater plate composition showed that the plates had 33% Silica. It was hypothesized that a possible cause of the water vapor could be the reduction of this Silica by Hydrogen present in the Forming gas. In order to test this hypothesis, a run was carried out in which the atmosphere was switched from Forming gas to Argon. This switch was done at 600 C so that at a ramp rate of 5
Hydrogen by the time the furnace got to 900 C. If a chemical reaction involving Hydrogen was causing a rise in dew point (and oxidation of the part) at temperatures above 900 C, then, the switch to Argon should yield a clean part (since there would be no Hydrogen to reduce the Silica and produce water vapor). Indeed, the part quality obtained (Figure 2.6c) was much better than
30 1200 20 -1000 10-00 800 600 CU -10 - 00 0 50 100 150 200 250 300 350 400 450 500 550 Time, minutes
-- Dew point -- Furnace temperate
Figure 2.4: Dew point vs. time: soak at 200 C until dew point goes to -25 C, then ramp to
1200 C.
that obtained in the run without the switch.
With sufficient reason to believe that Silica in the heaters was responsible for the rise in dew point level at furnace temperatures above 900 C, a set of new heaters having 93% Alumina and
just
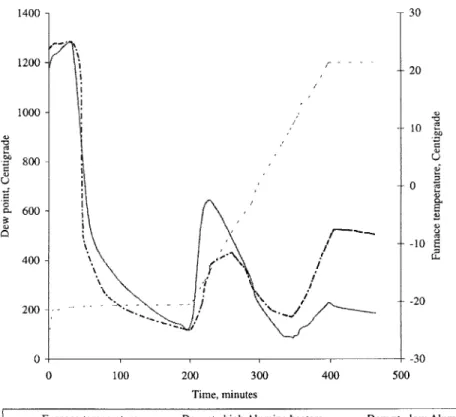
7% Silica as opposed to the 33% in the previous heaters was installed in the furnace. Figure 2.5 compares the variation of dew point with time when the furnace was run with the low Alumina heaters and the high Alumina heaters respectively. It can be seen that the rise in dew point when the furnace temperature is around 900 C is negligible with the high Alumina heatersas compared to that seen with the low Alumina heaters. Also, the part obtained had no oxidation when the high Alumina heaters were used (Figure 2.6d). This can be explained by the fact that
the heaters had low Silica content and thus water vapor released by the reduction of Silica was minimal.
Thus, it was established that the reduction of Silica present in the heater plates was indeed responsible for the increase in the amount of water vapor in the furnace at high temperatures. Also, it was found that as the furnace was run in Forming gas, over time, the Silica got continuously depleted and the rise in dew point at high furnace temperatures was no longer seen. 1400- 30 1200 -20 1000) -- 0 600 -0 600 400 -200 - -- '... -20 0 -30 0 100 200 300 400 500 Time, minutes
- - - Furnace temperature Dew pt., high Alumina heaters - - - Dew pt., low Alumina heaters
Figure 2.5: Comparison of moisture release at temperatures above 900 C: low vs. high Alumina heaters.
2.3 Other considerations
In order to ensure that the parts sintered in the furnace were oxide free, a moisture trap
was used in the gas flow line. Also, high purity Forming gas having less than 10 PPM of water vapor was used as opposed to the previously used industrial grade Forming gas that had up to 30 PPM of moisture. It was decided to replace the Alumina insulation on the top door of the furnace with Graphite. Graphite would act as a gettering agent by reacting with and removing any water
vapor in the furnace. If the dew point inside the furnace is relatively high over several runs (as a result of say, not purging the furnace long enough at 200 C before ramping up to 1200 C), a
wb
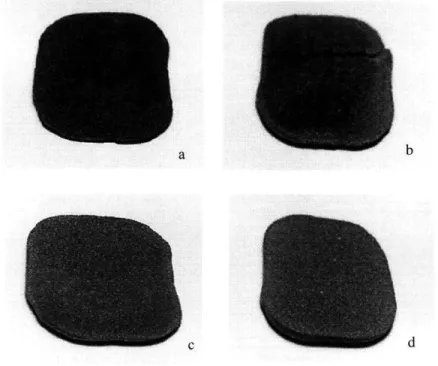
c d
Figure 2.6: Parts sintered in the small scale furnace: (a) with no band heaters, ramp to 1200 C, Forming gas atmosphere, low Alumina heaters (b) with band heaters, soak at 200
C, then ramp to 1200 C, Forming gas atmosphere, low Alumina heaters (c) same as 2.6b, except that atmosphere is switched from Forming gas to Argon at 600 C (d) same as 2.6b,
except that the heaters in the furnace have a high Alumina content.
visible change can be seen in the Graphite, indicating loss of material by oxidation. The chapter on the assembly of the large scale furnace discusses the issue of Graphite vs. Alumina in greater detail.
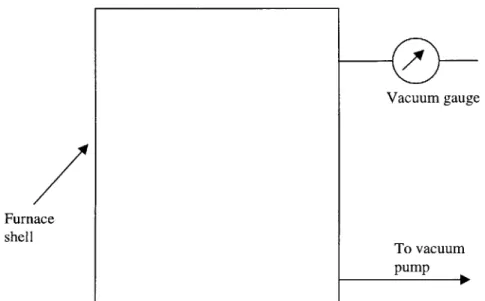
A vacuum test was performed on the furnace to get an idea of the size of any leaks that
existed in the furnace. Figure 2.7 shows a schematic of the set up for the vacuum test. The idea was to seal all the furnace openings, pull a vacuum inside the furnace and observe the rate of pressure rise inside the furnace. This could then be used to compute the average gas flow rate into the furnace through the leaks. In order to dilute the effect of inflow through the leaks, purging gas a twenty times the leak flow rate could be made to flow through the furnace. It is important to note that this method is extremely conservative since the leak rate into the furnace when it is running with positive pressure inside will be much less than the leak rate when there is
a vacuum inside. All openings in the furnace were sealed off and a vacuum was pulled inside the furnace. The pump was shut off and the pressure rise in the furnace was recorded as a function of time. Table 2.1 shows the rise in furnace pressure as a function of time (t = 0 is when the vacuum
is pulled). Vacuum gauge Furnace shell To vacuum pump
Figure 2.7: Schematic of the set up for the vacuum test carried out using the small scale furnace.
The volume inside the furnace, neglecting that of the tubes going to the pump and the gauge is V
= 0.006613 cubic meters. The air in the room was at a temperature T = 24 C. A pressure change inside the furnace, Ap= 5 Torr corresponds to a difference in density Ap = Ap/RT, where R is the gas constant. The mass of air that leaked in is Am = Ap*V, which comes to 5.17*10- kg. The
average flow rate of air can be calculated from the times in the table to be about 5* 10- kg/sec. That gives a ball park value of the air leakage that can be expected. In order to dilute this
Time, seconds Pressure, Torr
0 10
105 15
220 20
330 25
Table 2.1: Furnace pressure vs. time. A vacuum was pulled into a "sealed" furnace and the pressure rise as a function of time was used to quantify leaks into the furnace.
leakage, we may want the flow rate of forming gas to be 20 times this value, i.e. around 1*105 kg/sec. The molecular weight of forming gas, which is 95% Argon and 5% hydrogen by volume is 0.95*40+0.05*2 = 38.1 g/mole. This means that the gas constant for Forming gas is 8314/38.1
= 218.2 kJ/kg K (8314 J/kg K is the universal gas constant). The density of forming gas is p/RT=
105 /(218.2*298) = 1.54 kg/cubic meter. Thus a mass flow of 1*10-5 kg/sec corresponds to a flow rate of I*10-5 /1.54 = 0.64*10-5 cubic meter/sec. This is about 4 volume changes an hour. Thus,
the flow rate of five volume changes an hour used in the experiments described in this chapter is a good flow rate.
2.4 Summary
It was found from experiments that the following were needed to obtain good quality, and unoxidized sintered parts in the small scale furnace:
" external heaters to keep the aluminum shell at 200 C . high alumina heater plates
. graphite on the door to act as a gettering agent
. high purity forming gas at a flow rate of at least 5 volume changes an hour * a purge with the furnace soaking at 200 C until the dew point was -25 C
This information was used in the design of the large scale furnace, which is described in Chapter
3 Design of a Debinding Apparatus
Currently, two furnaces are needed for complete post processing of 3D printed parts. The first to debind green parts, which involves binder burn off and the second to sinter and infiltrate the debound parts. In addition to the additional capital investment the second furnace entails, debinding the green part in a separate furnace is more time consuming since it involves an additional ramp up and cool down.
This chapter describes the design, fabrication and testing of a debinding apparatus for use in the small scale furnace. The developed design is easily scalable and thus can also be used in the large scale furnace.
/
Effluent
tube
d: Diameter of SS tube
D: Diameter of the hole in the graphite
lid
L Graphite lid
Tapped holes for SS
Graphite crucible screws
Green part
Figure 3.1: Schematic showing the concept of a debinding chamber. Note that the annular clearance between the effluent tube and the hole in the Graphite lid, t =1/2(D-d).
3.1 Current practice
A 3D printed green part consists of powder that is held together by binder, which is
typically a polymer such as Acrysol. This polymer is burnt off at around 500 C at which temperature the part undergoes light sintering, giving the part structural integrity. Binder burnout releases hydrocarbons that tend to deposit on the walls of the furnace. This makes the furnace unusable for sintering or infiltration, both of which require a contaminant free environment.
To get around this problem, the current practice is to use two separate furnaces, one for debinding and the other for sintering and infiltration. This involves an additional capital expenditure on a second furnace and increases the post processing time. Also, it requires that the debound part (that is not structurally strong) be physically transferred from one furnace to the other. Clearly, it would be ideal to have debinding and sintering take place in a single run in the
Cooling water inlet
Cooling
water outlet Effluent outlet:SS tube
I -Forming gas ir furnace Furnace gas outlet 01 Needle valve Graphite crucible Green part Alumina pedestal
Figure 3.2: Schematic showing gas flow into the furnace and two possible exit paths for
outgoing gas: one through the annular gap and out through the effluent tube and the other through the regular outlet 01.
same furnace.
It|
Furnace shell
3.2 Design of a debinding apparatus
In order to prevent contamination of the furnace due to binder burnout, the green part was housed in a graphite crucible with a graphite lid. The lid had a through hole in its center and was screwed on to the crucible by means of two SS screws (Figure 3.1). It should be noted that SS is not the best material to be used for the screws, since it reacts with the graphite to form cast iron. For future applications, use of Alumina screws is recommended. A SS tube passing through this hole carried the effluent generated inside the crucible out of the furnace. In order to keep the effluent generated by binder burnout from leaking out into the furnace through the annular gap between the tube and the hole, the pressure outside the crucible must be maintained higher than the pressure inside it. Forming gas entering the furnace through the bottom can get out of the furnace through the regular outlet 01, whose opening is controlled by a needle valve or through the annular gap into the graphite crucible and out of the SS effluent tube (Figure 3.2). The fraction of inlet gas going out of the furnace through the regular outlet and the effluent tube depends on the resistance the two openings offer to its flow. Let p1 denote the pressure inside the graphite crucible and p2 that in the furnace (outside the crucible). The effluent tube vents out into the atmosphere and is roughly 2m long. The gas flowing though it cools down to room temperature very soon after it leaves the furnace and can thus be assumed to be at room temperature for purposes of calculation. Pressure drop for flow through the effluent tube is given
by
pI-pa= 8QgL/(nR4)...(1)
where pa is atmospheric pressure,
Q
is the flow through the tube, g is the viscosity of the Forming gas, L is the length of the effluent tube and R is the inside radius of the effluent tube. Equation 1 assumes fully developed flow in the tube. If all the Forming gas entering the furnace were to leave it through the effluent tube (worst case), thenQ
=8.7*10-6 m3/s. Also, at room temperature, g = 2.2*10-S kg m/s. Using L = 2 m and R = 0.085" in equation 1 gives a pressuredrop of 0.2" of water over the length of the tube. Thus, for all practical purposes, the pressure inside the graphite crucible is atmospheric.
During furnace use, it is desired to maintain a pressure difference p2-p 1 equal to 4" of water. The problem at hand was to determine the annular clearance, t, such that a reasonable amount of flow would pass through the annulus for the given pressure difference of 4" of water.
3.2.1 Determination of the annular clearance
The viscous pressure drop during flow through the annulus can be approximated by using the Poiseuille equation. For flow between two plates of width w and separated by a distance h, the flow rate,
Q
is given byQ/w
= h3 /12g* (-dp/dx)...(2) where x is in the direction of flow.In the case of the annulus (see Figure 3.1),
w = 7t*(D +d)/2...(2a) H = t...(2b )
-dp/dx = (p2-pl)/L ... (2c)
Thus, in this case, using equations 2a and 2b, the Bernoulli pressure drop (=1/2pv2) is 1/2p(Q/wt)2 and the viscous pressure drop is 12QgL/(w t3). Neglecting Bernoulli pressure drop,
which is found to be negligible compared to the viscous term, the drop p2-pI is given by
p2-p 1 = 12Q gL/(w t3
)...(3)
Now,
Q,
the flow through the annulus is a fraction ofQ',
the flow into the furnace. At temperatures above room temperature,Q'
is related to Qi , the flow at room temperature, byQ '= Q rps/p ... (4)
where ps is the density of forming gas at room temperature and p is the density of the gas at the furnace temperature.
Q = n Q '...(5)
where n is the fraction of incoming gas that leaves the furnace through the annular gap.
Plugging equations (3) and (4) into (2) gives
Ap = 12RL(n Qrtps/p)/(wt3) ... (6)
The annular clearance t was estimated by assuming a pressure difference of 4" of water and that
30% of the flow went through the annulus (n = 0.3) at room temperature. At room temperature, R
= 2.2*10-5 kg m/s, p = ps = 1.546 kg/m3,
Qrt
= 8.7*10-6 m3/s (=5 volume changes an hour for an 8" diameter by 8" height furnace). Choosing a diameter of " for the SS tube fixes w (see equation 2a). L, the thickness of the crucible's graphite cover is chosen to be ". Plugging thesein equation 6 gives t = 3.5/1000".
3.2.2 Testing the design
When it came to drilling the hole in the Graphite lid, the diameter of the SS tube was measured to be 0.242" and thus the hole was reamed to a diameter of 0.249". The first test that was done with the setup (at room temperature) involved closing outlet 01 such that all the flow entering the furnace went out through the annular gap. It was found that the pressure build up in the furnace was 2" as opposed to 12" which is predicted by equation 6 for n=1. This can be explained by the fact that the SS effluent tube is not concentric with the hole in the lid. (Figure
3.3). Clearly, as figure 3.3 shows, the effective annular gap for a non-concentric case is larger
than t and thus resistance to flow is lesser, which results in a lower pressure build up for a given flow. A trial and error method was used to find the gap that would yield a pressure difference of 2" in the case when all the flow entering the furnace went out through the annular gap. It was found that using a value equal to 1.83t in equation 6 for the annular gap yielded a pressure difference of 2". Thus the effective annular clearance is 1.83t. This makes sense, for, as figure
3.3 shows, going clockwise, the annular gap starts off at zero where the tube touches the hole in
were correct, then the theoretically predicted and experimentally observed pressure in the furnace would agree at 500 C. To test this, when the furnace was at 500C, outlet 01 was closed and the pressure inside the furnace was noted to be 10" of water. At 500 C, the theoretical pressure difference assuming that all the flow goes out of the furnace through the annular gap (=
1.83t) can be predicted using equation 6. At 500 C, g = 4.63* 10-5 kg m/s, p = 0.58 kg/M3 and the annular gap shrinks a little since the thermal expansion of SS is greater than that of Graphite.
(agraphite = 6* 10-6 and steel = 12*10- ). Plugging these values in equation 6 yields a pressure
difference of 11.3" of water that is close to the observed value of 10" of water. Thus, the assumption that the effective annular gap is 1.83t is a good one.
2t
ole in graphite top
SS tube
Figure 3.3: Schematic showing an increase in the effective annular gap between the tube and the hole due to misalignment.
It is important to note that the annular gap will vary every time the debinding mechanism is assembled before a furnace run. The annular gap could be t all around (perfectly concentric case) or could vary from zero to 2t as shown in figure 3.3 (perfectly non-concentric case) or could be somewhere between the two extreme cases. Irrespective of what the alignment is like, the following scheme can be used during any furnace run. At room temperature, Outlet 01 can be opened enough to get a furnace pressure of around 2" of water and to have enough flow through 01 to take dew point measurements. As the furnace ramps up, the pressure inside the furnace would rise, and 01 would need to be opened as required to keep the furnace pressure at 4" of water. Equation 6 can be used to see that at 500 C, when outlet 01 has been opened enough
to get the furnace pressure to 4" of water, around 35% of the gas flowing into the furnace leaves via the annular gap. At 1200 C, using, g = 7*10-5 kg m/s, p = 0.324 kg/M3 in equation 6 it is seen that around 13% of the flow leaves the furnace via the annular gap when 01 has been opened enough to keep the furnace pressure at 4" of water.
The next step was to debind and sinter a green part using the set up. In order to ensure that the mechanism was working and no binder from the green part leaked out into the furnace, a
U tube was mounted inside the furnace (Figure 3.2). This tube carried a continuous flow of
water, and thus served as a cold finger. If any polymer leaked out into the furnace, it would condense on the finger and would thus be visible after the test.
Figure 3.4: Picture of a SS truss that was successfully debound and sintered using the described set up.
A green part was placed in the graphite crucible and the cover was tightened onto the
crucible using two SS screws. Boron nitride paint was smeared on to the part of the SS effluent tube that was inside the Graphite lid in order to prevent any reaction between the SS tube and the Graphite. Before the flow of cooling water was started, the furnace was purged for half an hour with forming gas at 10 volume changes an hour. Once the dew point in the furnace was below the temperature of the cooling water, cooling water flow was started. Had the flow been started earlier, water vapor inside the furnace would have condensed on the cooling tube. The furnace was then ramped up and outlet 01 was opened according to the previously described scheme.
Debinding was carried out at 500 C for one hour after which the furnace was ramped to 1200 C. Upon completion of the run, the U tube was examined and no condensate was found on the tube. This showed that there was no leakage of effluent gas out of the crucible. Figure 3.4 shows a part that was sintered and debound successfully using this setup.
Connected to tubing that vents into the atmosphere Tapered passage Flow meter body (plastic) Float From outlet 01 of the furnace
Figure 3.5: Simplified schematic of a modified flow meter. Such a flow meter, when mounted at outlet 01 of the furnace can be used to maintain constant pressure inside the
furnace during the entire furnace cycle without user intervention.
3.3 Improved design
The design described in the previous section works well. However, as the furnace heats up, furnace pressure begins to rise and the needle valve at outlet 01 needs to be opened in order to keep the furnace pressure at 4" of water. This needs to be done frequently as the furnace heats up, and, needless to say, is inconvenient. Figure 3.5 shows a simplified schematic of an alternative to using a needle valve at outlet 01. The idea is to use a variable area flow meter instead. The flow meter has a varying cross section passage (slightly tapered) and a float that sits over an orifice that serves as the gas inlet. The float stays in equilibrium under the influence of its own weight and the force of the gas underneath. The idea is to find the weight of the float (by trial and error) that will cause it to not rise above the orifice until the pressure of the gas is 4" of
water or more. The float weight can be altered by changing the material of the float. If this flow meter is fitted at outlet 01 of the furnace, then, as long as the pressure inside the furnace is below 4" of water, all the forming gas entering the furnace will leave it through the effluent outlet. However, as soon as the furnace pressure starts to rise above 4" of water as a result of furnace ramp up, the float will rise, causing part of the gas to exit the furnace out of outlet 01. This method will ensure that the pressure inside the furnace stays below 4" of water during the entire furnace run without user intervention.
3.4 Summary
This chapter described the design and successful application of a debinding apparatus that can be used to debind and sinter a green part in a single run without contaminating the furnace. An improved design that involves using a modified flow meter to maintain constant pressure inside the furnace without user intervention is also presented. The debinding apparatus presented in this chapter can easily be scaled up for use in the large scale furnace.
4
Directional Solidification
Interconnected porosity in 3D printed parts causes leakage in injection molding tooling and thus needs to be eliminated. It is believed that porosity is caused due to solidification shrinkage, trapped gas or evolution of dissolved gas when the liquid melt solidifies. Having optimized the small scale furnace to deliver oxide free sintered parts, the next step was to conduct experiments using this furnace to study the issue of porosity.
4.1. Porosity
4.1.1. Problems associated with porosity
The infiltrant has a lower melting point than the matrix material and gets wicked up the sintered part by capillary action. For successful infiltration, good wetting must occur between the infiltrant and the sintered skeleton. After infiltration, the resulting structure should be fully dense: however, this is almost never the case. Usually, there is porosity in infiltrated parts. Pores are undesirable since they act as crack nucleation sites, thus making the part more susceptible to failure. Interconnected porosity is worse, since it causes cooling channels in 3D printed injection molds to leak, rendering the molds unusable.
4.1.2. Causes of porosity
It is believed that the following mechanisms contribute to porosity:
" If a region in the sintered part is oxidized or contaminated, infiltrant will not wet it and
thus there will be residual porosity.
. Porosity can also arise if a gas pocket is enveloped by the infiltrant melt inside the part. . Metals shrink on solidification and this may lead to the formation of shrinkage voids. For