HAL Id: halshs-00441487
https://halshs.archives-ouvertes.fr/halshs-00441487
Preprint submitted on 16 Dec 2009HAL is a multi-disciplinary open access archive for the deposit and dissemination of sci-entific research documents, whether they are pub-lished or not. The documents may come from teaching and research institutions in France or abroad, or from public or private research centers.
L’archive ouverte pluridisciplinaire HAL, est destinée au dépôt et à la diffusion de documents scientifiques de niveau recherche, publiés ou non, émanant des établissements d’enseignement et de recherche français ou étrangers, des laboratoires publics ou privés.
Quotas allocation rules in Romania assessed by a
dynamic CGE model
Rodica Loisel
To cite this version:
Rodica Loisel. Quotas allocation rules in Romania assessed by a dynamic CGE model. 2008. �halshs-00441487�
Accepted for publication in Climate Policy (Septembre 2008)
Quotas allocation rules in Romania
assessed by a dynamic CGE model
Rodica Loisel1 CIRED-CNRS
Abstract
Alternative mechanisms for EU ETS (European Union Emissions Trading Scheme) quotas allocations within the Romanian economy are evaluated using a general equilibrium model within a dynamic intertemporal framework. Several distribution rules are simulated based on: the historical emissions, the least-cost approach and the auctioning scheme with and without a preliminary selection of eligible sectors. (1) The resulting marginal abatement cost in ETS eligible sectors is only 5.75 EUR/t CO2 for reducing pollution by 20.7%. Such a low level is explained by low energy prices and by substitution possibilities with low carbon content resources (nuclear and hydroelectricity). (2) Including all sectors in the trade creates a more flexible market than in the ETS, since more reduction options are available. (3) The ETS has high feasibility for monitoring. All eligible sectors (except refineries and metallurgy) present the lowest abatement cost in the economy. (4) Auctioning introduces a strong carbon price-signal, which reduces emission intensity but creates distortions in terms of trade and worsens the country’s energy dependency. (5) Environmental policy has modest macroeconomic results and tends to correct the resources allocation. (6) The strong double dividend obtained under certain circumstances indicates Romania’s potential for improving its energy efficiency and carbon intensity.
Keywords: climate policies, EU ETS, National Allocation Plan, quotas allocation, Romania, dynamic GCE modeling.
JEL classification: C68, H2, Q43, Q5.
1
45 bis, av. de la Belle Gabrielle, 94736 Nogent sur Marne, France. E-mail: [email protected]
1. Introduction
The European Union (EU) introduced into the Community climate strategy one major component, the Emissions Trading Scheme (ETS), designed to achieve CO2 reduction from main energy-intensive installations (EC, 2003a). The ETS represents the most important carbon market in operation. The countries’ individual objective is set in the National Allocation Plan (NAP) that states the total quantity of CO2 quotas and the allocation rules to participating sectors. The elaboration of a NAP is a controversial task entailing much debate around heterogeneous assignment factors across Member States. The diversity of NAPs arises from the considerable freedom delegated to Member States for the magnitude of allowances and the rules of quotas distribution (Kolshus and Torvanger, 2005). The first step in the elaboration of a NAP is to undertake a top-down economy-wide analysis of the share of allowances that should be granted to sectors covered by the ETS. Scientific assessments of reduction potential can provide useful insights into the least cost approach to adopt in a carbon constrained economy.
Three questions are addressed for the Romanian context: to find the optimal distribution rule, to identify the sectors where emission cuts can be achieved and to understand what the costs are likely to be. The efficiency of different quotas distribution schemes is set by means of a numerical top-down study applied to Romania by using a general equilibrium framework. The necessity of this exercise comes from the statement that in the first trading period “most NAPs only made at best a half-hearted effort at incorporating the reduction potential into the sectoral differentiation in the NAP or the setting of the total cap” (CAN-E, 2006, p.35).
The quotas allocation rules addressed in this paper refer to the Romanian National Allocation Plan built within the EU-ETS that sets the emission cap at 75.9 Mt CO2 (20.7% less than Romanian forecasts of emission needs; EC, 2007); the eligible sectors are electricity, refineries, metallurgy, glass, cement and paper. The EU Commission suggests three modes of allocating targets, based on historical emissions, on forecast emissions and on a least-cost approach (EC, 2003b). The method used for setting the national cap is a combination of the first two modes: the historical reference period is 2001-2004, while the base year for CO2
emissions projections is the year 2003. Romania has chosen to distribute freely all allowances, except for the new entrant reserves allowances, which remain unused at the end of the period (RME, 2006).
Romania ratified the UNFCCC (1994) and the Kyoto Protocol (2001) with a commitment to reduce GHG emissions by 8% compared with 1989 levels. Historically, total emissions decreased in Romania by about 50% in 2002, mainly due to the strong decline in industrial production and the restructuring of the economy in transition to a market economy. The commissioning of the first reactor at the nuclear power plant in 1996 also had a significant impact on GHG reductions. Given the amount of hot air, it is very unlikely that the reference emissions will surpass the level of the Kyoto Protocol target before the end of 2012, even in a high economic growth scenario (RME, 2005a). However, by 2020 economic growth could increase GHG emissions by 40% above the 2002 level (RME, 2005b). Thus, better insight into the development of emissions will allow Romania to manage its emissions over the long term. Further actions need to be taken at the national level, aiming at particular investment measures in CO2-intensive sectors such as energy and transport.
Romania has a low per capita emission level due to a relatively low economic development level but high emissions per unit of energy or GDP (carbon intensity). Consequently, the abatement of CO2 emissions could have an important positive effect, but it strongly depends on the capacity and the flexibility of the economy to absorb the adjustment costs. These costs are usually disproportionately high in relation to the economic situation, which despite a high growth rate (6.7% in 2006) presents a low GDP per capita level (one third of the EU average). This paper describes the mechanism for the designing of NAP in the context of Romania, for 2008-2012. Particularities concern the distribution rule through grandfathering, the eligible sectors, and the cap set to the reference period. The third phase of the ETS may seeseveral changes such as the redefinition of combustion installations, much stricter targets, the extension to new industries, like aluminium and ammonia producers, and to new gases, such as nitrous oxide and perfluorocarbons. The European Commission intends to increase the auctioning the rule, about 60% of allowances in 2013 and 100% in 2020, but adjustments are expected with a future international agreement, to be agreed in Copenhagen in 2009 (EC, 2008).
Our research covers the second phase of the ETS for understanding the NAP mechanism and provides lessons for future development of environmental policies within the ETS. To simulate scenarios on different allocation rules, we build an intertemporal dynamic general equilibrium model (section 2). Simulations are based on the historical emissions, the least-cost approach and the auctioning scheme, with and without a preliminary selection of eligible sectors. The analysis focuses on the marginal abatement cost and on the micro and macro-economic effects induced during transition and in the final state (section 3). The final section concludes and formulates some policy recommendations (section 4).
2. Theoretical specifications of the model
The model is built within a neoclassical framework mainly inspired from models applied to energy issues (Nordhaus, 1992; Lee et al., 1994; Beaumais, 1995; McKibbin and Wilcoxen, 1995; Burniaux and Troung, 2002, etc). The model assumes a small open economy, which faces exogenous world-market prices. Each sector uses labour, capital and inputs provided by production sectors; all factors are assumed to be fully mobile across sectors. All prices in the model are in relative terms, while capital price is chosen as the numeraire in the model. The economy is disaggregated into 14 production sectors: four energy sectors (electricity, coal, oil and gas), four energy intensive sectors eligible for the ETS (metallurgy, glass, cement, paper) and six sectors not covered (chemistry, transport, agriculture, construction, services and ‘other activities’).
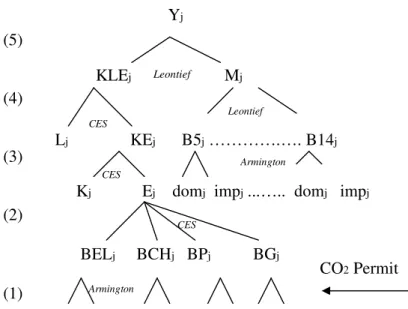
A constant returns-to-scale neo-classical production function describes the domestic production. The separation of different types of energy and non-energy inputs is in line with the general KLEM1 approach, as most commonly adopted in the energy literature. The nested structure follows the same principle in all productive sectors (j) as presented in the Figure 1, yet with varying elasticities and technical parameters.
The source of carbon dioxide emissions is the use of primary inputs coming from all energy sectors.2 It is assumed that emissions are proportional to the amount of primary energy used in each sector and that both domestic and imported energy inputs have the same emission
coefficients. This avoids substitution with imported inputs for the sole reason of evading the carbon-constraining policy. The environmental regulation also concerns fossil-fuel imports, since their combustion takes place domestically.
Figure 1. The nested production function
The formalisation of the permit market assumes a perfect competition framework, which could well be the case in the context of thousands of installations participating in the trade. The permit market simulates here only real emission reductions and takes into account neither the existing nor prospective JI projects nor the amount of hot air that participation in the Kyoto Protocol permit market would generate. The surplus of almost 125 Mt CO2 would make Romania a net permit seller on this market. Losses of CO2 emissions are due to the transitional recession and the consequent general economic contraction on the supply-side. They do not stream from real environmental improvements and the fact that most reductions have never occurred could undermine the permit market structure and create instability if their volumes are significant (Pesic, 2003; Klepper and Peterson, 2004).
The carbon market operates a zero-sum game, meaning that the more CO2 a sector emits, the greater the efforts required of other sectors to decrease their emissions:
∑∑
− = j i j i j i CO CO2 2 ) 0( , , , where CO2i,jrepresents the number of permit granted to the sector j that employs a production technology using the energy input i.
If Pper is the price of the emission permit, the product
∑
ij i per CO
P 2, is defined as the scarcity
rent and the expression
∑
−i j i j i per CO CO
P ( 2, 2, )is the sector permit balance, which might be
either positive or negative, meaning that a sector is buyer or seller on the permit market. In the context of perfect competition on the permit market, the optimal principle to set the least cost abatement approach consists in the integration of the net permit balance into the price frontier, at the lowest level of the technological process. This technique is economically efficient because it avoids the transfer of the carbon price on the consumer, and sends the signal downstream into the production technology, encouraging substitutions between inputs.
KLEj Mj
Lj KEj
Kj Ej domj impj ...….. domj impj
BELj BCHj BPj BGj B5j ………….…. B14j CES Leontief Armington CES Armington CES
domj impj domj impj domj impj domj impj
Yj (5) (4) (3) (2) (1) Leontief CO2 Permit
Estimation of the abatement cost is set on the basis of optimal economic criteria for creating the right incentives that eliminate speculative actions on the market. In the same way, the benchmark statement of NAPs should be set on the basis of best available technique standards for individual processes and should not use the average performance of existing plants (CAN-E, 2006).
The consumer is representative for all households. He receives a fixed share of dividends from productive sectors, wages paid by the producer and the rest of the world as well as transfers from the State and firms. Household makes the trade-off between leisure and consumption by maximizing the intra-temporal utility, (u C lt, )t , following the principle of a CES function. The utility does not include the pollution stock for examining the welfare variation net of environmental gains. The welfare indicator (EV) is expressed by the hicksian measure of the equivalent income variation:
) , , , ( ) , , , (Pc1 w1 r1 U1 e Pc0 w0 r0 U1 e
EV = − , where Pc denotes the consumer price, w the
nominal wage, r the interest rate and U the inter-temporal utility described below.
The State is not an optimizer agent and its activity is assessed against the expenditure and revenue accounts of the base year. As for the balance of the rest of the world, the external debt is exogenous and the equilibrating variable is the exchange rate.
The dynamics is based on the active population’s exogenous growth and capital accumulation, following Ramsey (1928), Cass (1965) and Koopmans (1965). The dynamics of active population is limited by the demographical decline recorded in Romania after 1990, but active population’s growth is however assumed (0.1% by year), because the current unemployment rate is officially set at around 8% and unofficially at 40%. The latter is mostly due to agriculturally-disguised unemployment that occurred during economic restructurating in the 1990s which diminished industrial labour in favour of the agricultural sector (Stanculescu and Bereveoscu, 2004).
The model assumes an infinitely living representative household that maximizes utility subject to the intertemporal budget constraint defined by per capita variables, reflated with the active population growth rate, n:
∑
∏
∑
∏
∑
= − = − − + + + + = + + + + + − = t t s s t t t t t t t s s t t t t k t t t t t l C r TRSp ep C pc n r TRSr l w K p n c s l C u U Max t t , 1 1 , 1 1 1 , ) 1 ( ) ( ) 1 ( ) 1 ( ) ( ) 1 ( / ) , ( ) 1 ( 1 1 1 θ ρ θwhere
θ
is the intertemporal elasticity of substitution, ρ the rate of time preference, TRSr et TRSp are respectively households’ received and paid transfers. The modified golden rule is determined by the Euler equation:) 1 )( 1 ( 1+r = +ρ +n
At the producer level, the capital accumulation equation (function of per capita variables) implies backward looking specifications, given the capital depreciation rate δ :
[
(1 )]
/(1 )1 I K n
Kt+ = t + −δ t + .
The equilibrium is set on the saving-investment balance; Walras law is checked at each period, but still has an intertemporal form: current savings decrease with the repayment of a fraction θ of the public debt, dpub , discounted with the interest rate:
+ − + − − + − = −1 1 1 t t t t t t t t dpub n r PubDef Sentr Shous invtot pinv walras θ ,
where walras is a control variable of equilibrium, pinv the investment price, invtot the volume of total investment, Shous and Sentr are respectively the saving of households and enterprises, and PubDef the public deficit.
Resolution is done by means of the GAMS/MCP software (Brooke et al., 1998). The efficiency parameters of the technology as well as the share parameters are obtained through calibration. The social accounting matrix is built on data provided by Romanian National Accounts (NIS, 2006) related to the year 2003.
3. Numerical simulations
We simulate a 20.7% reduction of the emission level attained in 2003 which represents 19.8 Mt CO2. It is tantamount to implicit assumption that the reference year reproduces the projected emissions up to 2008-2012. The constraint is gradually applied to the trade period and concerns only ETS sectors.
Five allocation schemes are simulated. The first scenario is based on the historical approach applied to the reference emissions of the year 2003, and the permits are allocated by grandfathering (HA). Other distribution rules are tested, such as the least-cost approach (LCA), the auctioning (AUC), and the integration of all sectors into the trade (All). Alternatively, income from permits-auctioning is recycled in the economy by reducing employers’ labour taxes (REC). Simulations are done for thirty periods and the shock is applied from 2008, which corresponds to the sixth period in our model, having therefore an announced character related to the agents’ perfect anticipation.
3.1 The historical approach case (HA)
On the basis of forward-looking specifications, the model allows households to anticipate the consequences of the new policy and to adapt their consumption and saving behaviour to the new price system. Despite increased volume of consumption (0.12%), the social welfare index, measured as the equivalent variation of the consumption income, shows a negative variation (-0.78%). This is an income effect (-0.12%), as wages, profits and social transfers decrease (-0.11%, -0.13% and -0.44% respectively); we also discount the partial repayment of the public debt at each period.
Following the functional forms adopted in the consumer program, three inter- and intra-temporal decisions are simultaneously taken, based on the trade-off between the consumption in the short and long terms, between the leisure and consumption in each period, and between intratemporal saving3 and consumption. The trajectory of consumption shows the effects of individual choices: for an anticipated decrease of the price index, the representative household expands its aggregate demand until the policy becomes effective. After the period when the shock is applied, consumption slims down to its convergence value.
Graph 1. Household price, saving and consumption trajectories (%, reference = 0) -0.4 -0.2 0 0.2 0.4 0.6 0.8 1 5 10 15 20 25 30 Consumption Price Saving
Intertemporal trade-off between present and future consumption tends to favour the long run so that there is a switch in respective rates of growth: the saving curve is below the consumption’s trajectory at the beginning of the interval, and above its curve after the shock. Intratemporal trade-off between leisure and consumption is done in favour of the latter for a substitution value set at 1.9; the increase in labour slowly diminishes leisure and encourages consumption.
Two main arguments are considered below to explain the negative effect of the policy on social welfare and the positive impact on individual consumption. The latter is indeed rather counterintuitive as the policy is very restrictive:
(1) the mechanism implied at the welfare level concerns the consumption income related to both the intertemporal utility value and the price system. In this way, its formula takes into account the intertemporal aspects that integrate all resources accumulated during the interval discounted with the interest rate. The increase in the discount rate depreciates the intertemporal income compared with the reference period and leads to a higher decrease in the intertemporal welfare value.
(2) the consumption increases throughout the interval. We recall that households are not subject to the environmental constraint and thus they are only indirectly affected by the restriction set on emissions. Energy goods and services represent a low fraction in the current household expenditures (9%) and the new policy involves the decrease of electricity demand only, which represents 3.3% of the total expenditures. The environmental policy has thus a marginal effect on the residential energy consumption.
A positive price-effect is added: the price’s decrease for goods provided by ‘other activities’ significantly diminishes the total expenditures, as their part in the budget is very important (39%).
From the environmental point of view, the decrease in energy demand (-0.4%) points out the positive impacts the policy has at household level on the use of these resources. Meanwhile, individual substitutions do not favour products with weak carbon content, as only electricity
demand decreases. The price-signal sent to households is not strong enough to change their consumption behaviour. Thus, policy should be expanded at this level and the residential energy consumption constrained.
The macroeconomic effects are relatively low considering the high constraint imposed on the system. The low effect on the real GDP (-0.16%) is explained by factor mobility and substitution possibilities that are allowed through functional forms in the producer-nested technology. Both initial and final allocations are optimal as presented in the producer program; still the final situation appears more efficient from the environmental point of view while integrating the quantitative constraint on pollution. Structural change hypotheses are adopted with regard to the transitional phase Romania comes through, which implies reorganisation of the industrial picture, with fast mutations of human and financial resources across sectors.
With regard to the current account, changes are in terms of exports (-0.51%), imports (0.11%) and exchange rate (-0.63%). The external debt is fixed at the initial level which makes a pressure on the terms of trade and depreciates the national currency. The shock has thus a negative impact and leads to a loss of competitiveness in most of the sectors. The policy has positive effects, however, regarding the energy import structure, as coal and gas decrease by respectively 22% and 1.2%. Consequently, Romanian energy dependency falls by 4.2%, which is an underestimated result by the initial assumption that sets the international price exogenously to one. An increase in this value is expected while the emission constraint is applied at the regional or international level.
Graph 2. Evolution of the GDP by components (%, reference = 0)4
-0.45 -0.4 -0.35 -0.3 -0.25 -0.2 -0.15 -0.1 -0.05 0 0.05 5 10 15 20 25 30 realGDP Households State Investment
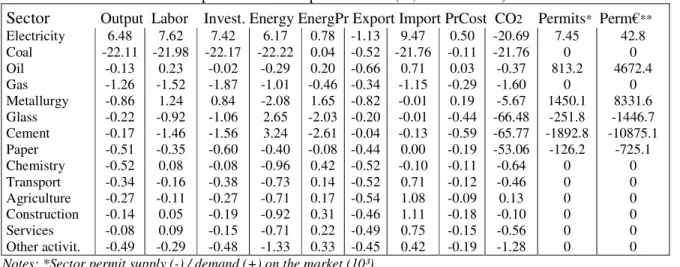
In contrast with the modest macro results, sector effects show important variations for the producer, mainly in the trading sectors: the coal output is significantly reduced (-22%), as producers account for the emission coefficients in their optimisation program; consequently, the demand increases for electricity facilities (6.5%). The production costs increase in most of the sectors, except for glass and cement, as a result of increased labour and energy prices on the one hand and permit purchase on the other hand.
Sectors that become net sellers of permits are glass, cement and paper production. They present thus low-cost abatement opportunities and record gains on the permit market. The cement production accounts for only energy related emissions and significantly the process emissions are excluded.
Table 1. Sector results from the permit market implementation (%, reference = 0)
Sector Output Labor Invest. Energy EnergPr Export Import PrCost CO2 Permits* Perm€**
Electricity Coal Oil Gas Metallurgy Glass Cement Paper Chemistry Transport Agriculture Construction Services Other activit. 6.48 -22.11 -0.13 -1.26 -0.86 -0.22 -0.17 -0.51 -0.52 -0.34 -0.27 -0.14 -0.08 -0.49 7.62 -21.98 0.23 -1.52 1.24 -0.92 -1.46 -0.35 0.08 -0.16 -0.11 0.05 0.09 -0.29 7.42 -22.17 -0.02 -1.87 0.84 -1.06 -1.56 -0.60 -0.08 -0.38 -0.27 -0.19 -0.15 -0.48 6.17 -22.22 -0.29 -1.01 -2.08 2.65 3.24 -0.40 -0.96 -0.73 -0.71 -0.92 -0.71 -1.33 0.78 0.04 0.20 -0.46 1.65 -2.03 -2.61 -0.08 0.42 0.14 0.17 0.31 0.22 0.33 -1.13 -0.52 -0.66 -0.34 -0.82 -0.20 -0.04 -0.44 -0.52 -0.52 -0.54 -0.46 -0.49 -0.45 9.47 -21.76 0.71 -1.15 -0.01 -0.01 -0.13 0.00 -0.10 0.71 1.08 1.11 0.75 0.42 0.50 -0.11 0.03 -0.29 0.19 -0.44 -0.59 -0.19 -0.11 -0.12 -0.09 -0.18 -0.15 -0.19 -20.69 -21.76 -0.37 -1.60 -5.67 -66.48 -65.77 -53.06 -0.64 -0.46 0.13 -0.10 -0.56 -1.28 7.45 0 813.2 0 1450.1 -251.8 -1892.8 -126.2 0 0 0 0 0 0 42.8 0 4672.4 0 8331.6 -1446.7 -10875.1 -725.1 0 0 0 0 0 0
Notes: *Sector permit supply (-) / demand (+) on the market (10³). **Sector loss (+) or gains (-) from the permit trade (10³ EUR).
The electricity sector presents the most contrasting effects, as it is the greatest polluter in the economy and also the biggest energy supplier. This explains to some degree why an increase in the production price responds to an increase in the supply. The demand-effect is due to low emission coefficients that characterise the output. The price increase is less surprising, as the intermediate consumption in this sector is mainly energetic and increased prices of inputs; to this input cost-effect, we add an increase in the demand for emission permits (7450 permits). Refineries and metallurgy are also net buyers in the permit market. The production technology of refineries presents few substitution possibilities between energy products: the main input in this sector is the oil that can hardly substitute for other energy inputs. Metallurgy records the highest loss, despite a high energy intensity level which could imply low abatement cost. In contrast, the intensive energy consumption combined with an energy price increase (1.6%) leads to a consequent rise in the production cost (0.2%) and to a decrease in sector supply (-0.9%).
The chemistry sector follows the same trend even if it is not constrained by the environmental policy: the high variation of energy inputs cost decreases the volume of production.
Transports are affected too, as the oil is the main input. The gas sector also records a decrease in production, in spite of the low carbon content of its output and of the weak price variation: the fall in production of energy-intensive activities, such as metallurgy, paper and chemistry, explains their reduced demand for gas inputs. Light industries – agriculture, constructions and services – benefit from the increase in household demand according to a price-effect which implies a lower decrease in their output. Supply decreases in response to higher energy costs. All sectors, except for agriculture, reduce their CO2 emissions, even if they are not covered by the trade and thus not constrained by the policy. This implies that the policy applied only to energy and energy-intensive sectors can create a price-signal strong enough to interfere in the consumption decisions of the other producers. Meanwhile, the energy intensity of the GDP is increasing (2.2%) as a consequence of increased consumption of electricity. We conclude
then that environmental constraints do not necessarily imply decrease in the energy demand, because permit gains can stimulate production and changes can occur in the energy inputs structure.
The permit market represents a volume of 2.27 million of traded allowances that sets the equilibrium price to 5.75 euros. The marginal abatement cost plays a key role in models dealing with climate change issues. Its value is often seen as a measure of welfare on the supply-side. The cost of reducing the emission of one tonne of carbon dioxide is computed in this model net of transaction costs. It may appear low considering that the cap is set at 79.3% of the reference emission for the trading sectors.
Two main factors explain the modest value of the marginal abatement cost: the low energy prices and the high substitution possibilities between energy inputs. There is consensus on the fact that economies with low energy prices need a low price-signal in order to achieve their target. The same relation is valid in economies that predominantly use coal in sectors with a good chance of replacing it with other inputs, especially in the electricity sector (Böhringer and Rutherford, 2000). The Romanian economy presents both characteristics, as energy prices are still low and coal can further be replaced by hydro and nuclear resources.
We now extend the analysis to other emission limitation objectives applied in the same trading sectors. The abatement cost curve shows the value of the permit for several levels of alternative targets, which remains relatively low for carbon constraints set below 30%.
Graph 3. Marginal abatment cost curve
0 10 20 30 40 50 60 5 10 15 20 25 30 35 40 45 50 55 60 Objective (% ) E U R /t C O 2
3.2. Results from alternative allocation rules
It is assumed that all sectors participate in the permit trade and that they freely benefit from the initial allocation (scenario All). In order to render comparable the results for the two cases (HA versus All), the constraint in All scenario is the environmental benefit obtained in industrial sectors within the HA case, precisely a target set to 15.2%. For the other scenarios, the constraint is set to 20.7% of the ETS sectors’ emissions, providing a different outcome for the overall industrial emissions.
Simulation results show that the permit price is higher in the HA case (5.75 EUR against 4.8 EUR in the All case), which corresponds to a lower equilibrium volume of traded quotas (2.27 M of permits against 3.97 M in the All scenario). As expected, the permit market in the All case has greater flexibility; in this way, a market opening to light industries and other energy sectors, such as coal and gas, offers the opportunity to integrate less costly options to reduce emissions. The HA market might appear from this point of view rather rigid, as it limits trade to energy-intensive installations. As transaction costs are not considered in this model, results should be understood as underestimated with regard to monitoring costs.
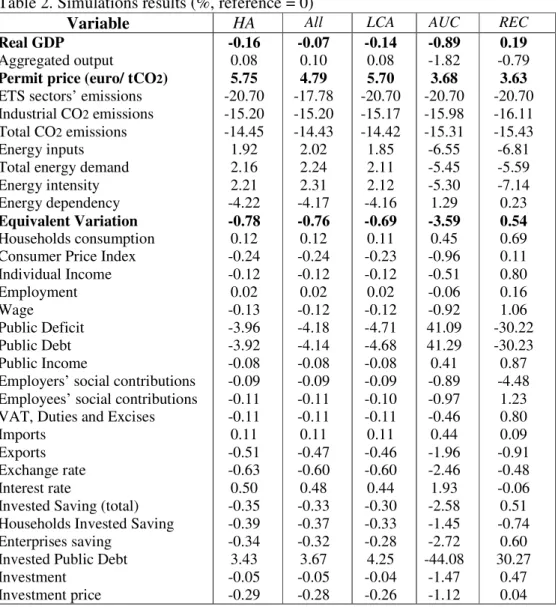
Table 2. Simulations results (%, reference = 0)
Variable HA All LCA AUC REC
Real GDP
Aggregated output
Permit price (euro/ tCO2)
ETS sectors’ emissions Industrial CO2 emissions Total CO2 emissions Energy inputs Total energy demand Energy intensity Energy dependency
Equivalent Variation
Households consumption Consumer Price Index Individual Income Employment Wage Public Deficit Public Debt Public Income
Employers’ social contributions Employees’ social contributions VAT, Duties and Excises Imports
Exports Exchange rate Interest rate
Invested Saving (total) Households Invested Saving Enterprises saving
Invested Public Debt Investment Investment price -0.16 0.08 5.75 -20.70 -15.20 -14.45 1.92 2.16 2.21 -4.22 -0.78 0.12 -0.24 -0.12 0.02 -0.13 -3.96 -3.92 -0.08 -0.09 -0.11 -0.11 0.11 -0.51 -0.63 0.50 -0.35 -0.39 -0.34 3.43 -0.05 -0.29 -0.07 0.10 4.79 -17.78 -15.20 -14.43 2.02 2.24 2.31 -4.17 -0.76 0.12 -0.24 -0.12 0.02 -0.12 -4.18 -4.14 -0.08 -0.09 -0.11 -0.11 0.11 -0.47 -0.60 0.48 -0.33 -0.37 -0.32 3.67 -0.05 -0.28 -0.14 0.08 5.70 -20.70 -15.17 -14.42 1.85 2.11 2.12 -4.16 -0.69 0.11 -0.23 -0.12 0.02 -0.12 -4.71 -4.68 -0.08 -0.09 -0.10 -0.11 0.11 -0.46 -0.60 0.44 -0.30 -0.33 -0.28 4.25 -0.04 -0.26 -0.89 -1.82 3.68 -20.70 -15.98 -15.31 -6.55 -5.45 -5.30 1.29 -3.59 0.45 -0.96 -0.51 -0.06 -0.92 41.09 41.29 0.41 -0.89 -0.97 -0.46 0.44 -1.96 -2.46 1.93 -2.58 -1.45 -2.72 -44.08 -1.47 -1.12 0.19 -0.79 3.63 -20.70 -16.11 -15.43 -6.81 -5.59 -7.14 0.23 0.54 0.69 0.11 0.80 0.16 1.06 -30.22 -30.23 0.87 -4.48 1.23 0.80 0.09 -0.91 -0.48 -0.06 0.51 -0.74 0.60 30.27 0.47 0.04
The scenario built within the least-cost approach (LCA case) assumes that eligible sectors are those included in the Historical Approach simulation (HA). The recourse to the LCA supposes a more theoretical technique: it is based on the fact that the abatement costs are substantially different across sectors, and for measuring these differences, a uniform CO2 tax is simulated in all sectors. The resulting emissions are used to determine the sectoral allocation, meaning that more allowances are granted to industries with more expensive abatement possibilities than to those with lower abatement costs.
The simulation run under the least cost approach reveals possibilities to reduce emissions in the following sectors ranked by decreasing order: cement, electricity, gas, glass, paper, coal,
constructions, agriculture, services, ‘other activities’, chemistry, refineries, metallurgy and transports. While the historical approach indicates the following rank: cement, glass, paper, electricity, oil and metallurgy. It appears that all ETS eligible sectors except refineries and metallurgy present the lowest abatement cost in the economy. Giving their higher abatement costs, these two sectors benefit of a more generous initial allocation under the LCA case, which explains why CO2 emissions decrease less compared with the HA test.
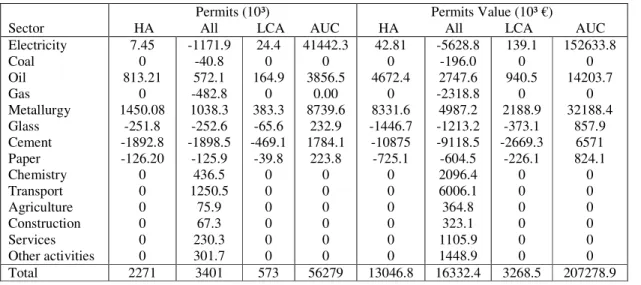
The permit allocation in the HA case projects the historical emissions, while in the LCA scenario more allowances are granted to sectors with costly abatement possibilities (refineries and metallurgy) and fewer to those with lower abatement cost (cement, glass, paper and electricity). Results from the LCA scenario are close to the HA case, but the resulting permit price is slightly lower (5.71 versus 5.75 EUR), reflecting more efficiency in the LCA allocation scheme. In spite of a similar total initial allocation (5.63 M permits), demand and supply take different equilibrium values: 2.27 M permits in the HA case and only 0.57 M permits in the LCA case. The fact that the trading almost disappears is the natural consequence of permits distribution according to each sector marginal cost.
Table 3. Sector results on the permit market
The analysis of the permit auction (AUC case) is also of great interest, even if the European Directive says that at least 90% of their initial allocation should be granted for free to eligible sectors, in order to ensure a period of information and experience in dealing with this instrument. We simulate the hypothesis that all permits are auctioned to ETS sectors and assume that the auction is done at the same price for all allowances.
The abatement cost value is a function of the permit demand, which is lower in the auction case, as the energy intermediate consumption decreases by almost 6.6%. The permit supply is higher in this scenario (56.3 M permits), which lowers the equilibrium price (3.68 EUR). The energy demand decreases in all sectors for two interdependent reasons: the output decreases in all activities as a demand-effect and the energy price rises as a cost-effect. From the perspective of the environmental policy, the shock has a positive impact on the final demand (-5.5%), on the energy intensity (-5.3%) and on total CO2 emission levels (-15.4%). But the national energy dependency is increasing (1.3%): the domestic price increase encourages imports for similar goods, despite the national currency depreciation.
Sector
Permits (10³)
HA All LCA AUC
Permits Value (10³ €)
HA All LCA AUC Electricity Coal Oil Gas Metallurgy Glass Cement Paper Chemistry Transport Agriculture Construction Services Other activities 7.45 0 813.21 0 1450.08 -251.8 -1892.8 -126.20 0 0 0 0 0 0 -1171.9 -40.8 572.1 -482.8 1038.3 -252.6 -1898.5 -125.9 436.5 1250.5 75.9 67.3 230.3 301.7 24.4 0 164.9 0 383.3 -65.6 -469.1 -39.8 0 0 0 0 0 0 41442.3 0 3856.5 0.00 8739.6 232.9 1784.1 223.8 0 0 0 0 0 0 42.81 0 4672.4 0 8331.6 -1446.7 -10875 -725.1 0 0 0 0 0 0 -5628.8 -196.0 2747.6 -2318.8 4987.2 -1213.2 -9118.5 -604.5 2096.4 6006.1 364.8 323.1 1105.9 1448.9 139.1 0 940.5 0 2188.9 -373.1 -2669.3 -226.1 0 0 0 0 0 0 152633.8 0 14203.7 0 32188.4 857.9 6571 824.1 0 0 0 0 0 0 Total 2271 3401 573 56279 13046.8 16332.4 3268.5 207278.9
The auctioning policy has a punishing effect in social and economic terms: lower agents’ resources imply lower investment and slow good accumulation with negative effect on the final growth (-0.89%). The scarcity of capital leads to an increase in the interest rate (1.9%) that depreciates the intertemporal consumer income more, which explains the strong negative impact on social welfare (-3.6%). At the budget level, the permit incomes increase the State revenues, but the decline in the activity lowers tax income and increases both the public debt and the budget deficit. These negative effects can be adjusted by complementary policies, such as permit revenue recycling.
With this aim in mind, we simulate the case where auction income is recycled to firms by reduced taxation on labour, such as employer social contributions (REC case). The policy enhances the rise in employment and thus in wage income, and benefits households by increased consumption and intertemporal welfare as well. The consumption and investment variation explains the GDP growth that is most significant across simulations. The comparison with the grandfathering scheme (HA, All and LCA) leads to the conclusion that a more restrictive policy implies deeper structural transformations that can be favourable to factor allocation when complementary measures are effective.
Transversal analysis of our simulations indicates relative weak values of the permit price for high environmental objectives (less than 5.8 EUR). This modest value is explained by the initial high energy intensity in Romania, by low energy prices and substitution possibilities between energy inputs. The formalisation of the permit market contributes to this result too, since it integrates optimal economic criteria derived from perfect competition conditions that avoid both speculative actions and the increase in consumer price with the allowance cost. All simulations show that the macroeconomic costs are not significant in terms of absolute variation (below 0.9% of GDP). The shock absorption at macro level can partly be explained by the initial structural conditions set on the perfect mobility of factors and substitution possibilities. These conditions are related to the database of the reference year 2003 that implies a transition period with deep structural changes in terms of economic system and institutional transformations. Simulations done with the GREEN model (Pesic, 2003) applied to Eastern European countries show that even if rigidities are considered, aggregate cost estimates remain modest (0.3% of GDP).
Regarding the quota allocation rule, the least cost approach reveals the lowest abatement cost under the grandfathering distribution principle, while auctioning creates the harmful carbon price-signal, since it most affects welfare, economic growth, employment and energy dependency. However, effects can be improved if allowances income is recycled within the economy, by reduced payroll taxes. Among all policies, this option is the only one that creates conditions for obtaining the so-called double dividend effect, by reducing carbon emissions and improving individual welfare or economic growth.
Sectors are differently impacted, depending on their energy intermediate consumption and their output carbon content, and also on the number of allowances and their distribution regime. Consequently, the electricity sector records an increase in its output considering the low emission coefficients, while the glass, cement and paper producers act as net seller in the permit market in all scenarios except for the auctioning case. Refineries, metallurgy, chemistry and transport are the most affected sectors, because of their energy intensive intermediate consumption, while the coal production strongly diminishes with the demand for
its products. Light industries are less affected in terms of output but still record an increase in their energy input prices; their emissions are consequently reduced.
4. Conclusions and policy recommendations
The definition of the permit distribution scheme is typically a very delicate issue with regard to the constraining level and the selection of participant activities, as it affects the efficiency of trade, social welfare, the non-eligible sectors and economic growth. Making effective allocation rules implies to balance the theoretical outcome with political considerations on what is practically feasible. Four main conclusions can be derived from our numerical results.
• Concerning the abatement cost, lessons derived from simulations indicate that any carbon market price set above our estimated value provide benefits to the Romanian economy through national cheap mitigation possibilities. Participation to the EU-ETS could further reduce this cost, since other flexible mechanisms will be in place, such as the joint implementation projects. However, these area limited to 10% of the total allocated volume (RME, 2006). The decision to contract JI projects should take into account the low estimated cost of abatement due to national efforts while trading off between selling quotas on the market or through JIP.
• The selection of the European Directive concerning the eligible sectors (HA) is justified in the Romanian case, because the trade participants (except for refineries and metallurgy) present the lowest abatement costs in the economy. Among grandfathering scenarios, the recommended policy relates to the least cost abatement case (LCA) since quotas distribution is done according to each sector abatement cost.
• Two main lessons were found for the third phase of the EU ETS, with regard to market enlargement to other sectors and to quotas auctioning. Firstly, the integration of all sectors into ETS renders the permit market more flexible, even if the policy could be more expensive than our estimations, as monitoring costs were not included in our calculations. On the other hand, long term benefits could offset the short-term administrative costs (EC, 2008). Secondly, auctioning has a harmful effect on sectors and households, while compensation of producers by tax deduction indicates positive benefits and the highest outcome among all policies here discussed, from both economic and environmental perspectives. The recommended policy is thus the quotas auctioning with complementary measures, such as income recycling through reduced payroll taxes.
• The question of compatibility of economic growth and environmental concern is a major issue for the enforcement of constraining policy. General findings from our simulations, which could be extended to similar transition countries, show that economic and environmental objectives are not incompatible. The strong double dividend, in the form of improved environmental quality together with negative social costs, indicates the great economic potential for increasing the energy efficiency. Other allocation rules of the scarcity rent revenue, as reduced taxes on value added or on capital, would need for more economic research.
Theoretical outcomes have to be considered as a starting point rather than an outcome, and should be better integrated into the political decision while designing the National Allocation
Plan, independently of industry pressures that could be exerted. The evaluation of economic implications for sectors and firms should be set on main arguments of the climate change objectives, such as the right carbon signal sent to polluters and the incentive to innovate. Even if Romania’s commitment to the Kyoto Protocol is already established, mitigating rapidly-growing fossil needs beyond 2012 will be a challenging task for the sustainable development and implementation of environmental regulations. The potential of Romania to reduce carbon intensity with low-cost measures must be quantified and exploited consequently, so its economic and social development may enjoy sustainable benefits.
Acknowledgements
I am very grateful to the Executive Editor of Climate Policy and the anonymous referees who provided numerous constructive comments and critical feedback which led to a significant improvement of the paper. Responsibility for ideas expressed and any remaining errors are my own.
Notes
1
Capital-labor-energy-materials.
2
The electricity sector aggregates both electricity production and distribution, and also the gas distribution network. Thus a quantity of CO2 emissions is associated with the use of the output of this sector.
3
Saving is set at a fixed proportion of the income, so saving and income trajectories are superposed.
4
Variations of net exports are insignificant, thus not represented on this graph.
References
Beaumais, O., 1995, ‘Une réinterprétation des politiques de l’environnement par les modèles’, Université de Paris I Panthéon – Sorbonne, PhD thesis.
Böhringer, C., Rutherford, T.F., 2000, Decomposing the Cost of Kyoto: A Global CGE Analysis of Multilateral Policy Impact, Document de travail ZEW/00-11, Centre for European Economic Research, (ZEW), Mannheim.
Brooke, A., Kendrick, D., Meeraus, A. and Raman, R., 1998, GAMS : a user’s guide, GAMS Development Corporation, Washington.
Burniaux, J.M., Troung, T. P., 2002, ‘GTAP-E: An energy-environmental version of the GTAP model’, GTAP Technical Paper No. 16.
Cass, D., 1965, ‘Optimum growth in an aggregative model of capital accumulation’, Review of Economic Studies, 32, 233-240.
CAN-E, Climate Action Network Europe, 2006, National Allocation Plans 2005-7: Do they deliver? Key lessons to Member States for 2008-12, available via http://www.climnet.org/EUenergy/NAPs.htm.
European Commission, 2003a, Directive 2003/87/EC of the European Parliament and the Council of 13 October 2003 establishing a scheme for greenhouse gas emission allowance trading within the Community and amending Council Directive 96/61EC. European Commission, 2003b, ‘The EU Emissions Trading Scheme: How to develop a
National Allocation Plan. Non-Paper 2nd meeting of Working Group 3’, Monitoring Mechanism Committee, Directorate General Environment, 1st April, 2003.
European Commission, 2007, ‘Emissions trading: Commission approves Romania’s national allocation plans for 2007 and 2008-2012’, IP/07/1612, Brussels.
European Commission, 2008, ‘Proposal for a Directive of the European Parliament and of the Council amending Directive 2003/87/EC so as to improve and extend the greenhouse gas emissions allowance trading system of the Community’, COM(2008) 16 final 2008/0013 (COD), Brussels.
Klepper, G., Peterson S., 2004, ‘The EU Emissions Trading Scheme: Allowance Prices, Trade Flows, Competitiveness Effects’, European Environment 14.
Kolshus, H.H., Torvanger A., 2005. ‘Analysis of EU member states’ national allocation plans’, Working Paper, CICERO.
Koopmans, T.C., 1965, ‘On the concept of optimal economic growth’, in The Econometric Approach to Development Planning, Amsterdam.
Lee, H., Oliveira-Martins, J., van der Mensbrugghe, D. (1994). ‘The OECD GREEN model: an updated overview’, Working Paper No. 97, OECD Development Centre.
McKibbin, W.J., Wilcoxen, P.J., 1995, ‘The Theoretical and Empirical Structure of the G-Cubed Model’, Discussion Papers 118, Brookings Institution International Economics. NIS, National Institute of Statistics, 2006, Conturi Nationale 2002-2003, Bucarest.
Nordhaus, W.D., 1992, ‘An optimal transition path for controlling greenhouse gases’, Science 258, 1315-1319.
Pesic, R., 2003, ‘Flexible mechanisms under the Kyoto Protocol in Central and Eastern Europe’, International Fellowship Project, available via http://www.policy.hu/pesic/. Ramsey, Y.F., 1928, ‘A Mathematical Theory of Saving’, Economic Journal 38, 543-559. RME, Romanian Ministry of Environment and Water Management, 2005a, ‘National Strategy on Climate Change of Romania 2005-2007’, Bucharest.
RME, Romanian Ministry of Environment and Water Management, 2005b, ‘Romania’s third national communication on climate change under the United Nations Framework Convention on Climate Change’, Bucharest.
RME, Romanian Ministry of Environment and Water Management, 2006, ‘Romanian National Allocation Plan for the periods 2007 and 2008-2012’, Bucarest.
Stanculescu, S.M., Berevoescu, I., 2004, ‘Households, work and flexibility. Critical review of literature’, Edited by Claire Wallace, Report 2000-2003.