HAL Id: hal-02516839
https://hal.archives-ouvertes.fr/hal-02516839
Submitted on 24 Mar 2020
HAL is a multi-disciplinary open access
archive for the deposit and dissemination of
sci-entific research documents, whether they are
pub-lished or not. The documents may come from
teaching and research institutions in France or
abroad, or from public or private research centers.
L’archive ouverte pluridisciplinaire HAL, est
destinée au dépôt et à la diffusion de documents
scientifiques de niveau recherche, publiés ou non,
émanant des établissements d’enseignement et de
recherche français ou étrangers, des laboratoires
publics ou privés.
socioeconomic complexity in Rio de Janeiro
metropolitan area
Maxime Lenormand, Horacio Samaniego, Julio Chaves, Vinicius Vieira,
Moacyr da Silva, Alexandre Evsukoff
To cite this version:
Maxime Lenormand, Horacio Samaniego, Julio Chaves, Vinicius Vieira, Moacyr da Silva, et al..
En-tropy as a measure of attractiveness and socioeconomic complexity in Rio de Janeiro metropolitan
area. Entropy, MDPI, 2020, 22, pp.368. �10.3390/e22030368�. �hal-02516839�
Entropy as a measure of attractiveness and socioeconomic complexity
in Rio de Janeiro metropolitan area
Maxime Lenormand,1,∗ Horacio Samaniego,2, 3, 4,∗ Julio C. Chaves,5 Vinicius
F. Vieira,6 Moacyr A. H. B. da Silva,5 and Alexandre G. Evsukoff7,†
1
TETIS, Univ Montpellier, AgroParisTech, Cirad, CNRS, INRAE, Montpellier, France
2
Laboratorio de Ecoinform´atica, Universidad Austral de Chile, Instituto de Conservacin, Biodiersidad y Territorio, Campus Isla Teja s/n, Valdivia, Chile
3Instituto de Ecolog´ıa y Biodiversidad, Facultad de Ciencias,
Universidad de Chile, Las Palmeras, ˜Nu˜noa, Santiago, Chile
4
Instituto de Sistemas Complejos de Valpara´ıso, Subida Artiller´ıa 470, Valpara´ıso, Chile
5Getulio Vargas Foundation, Praia de Botafogo 190, Botafogo, Rio de Janeiro, Brazil 6
Federal University of S˜ao Joao Del Rey
7
Coppe/Federal University of Rio de Janeiro P.O. Box 68506, Rio de Janeiro, Brazil Defining and measuring spatial inequalities across the urban environment remains a complex and elusive task that has been facilitated by the increasing availability of large geolocated databases. In this study, we rely on a mobile phone dataset and an entropy-based metric to measure the attractiveness of a location in the Rio de Janeiro Metropolitan Area (Brazil) as the diversity of visitors’ location of residence. The results show that the attractiveness of a given location measured by entropy is an important descriptor of the socioeconomic status of the location, and can thus be used as a proxy for complex socioeconomic indicators.
INTRODUCTION
While cities have long been recognized as the cra-dle of modern civilization by providing a safe place for cultural development, the inequality distribution of wealth and services remain the main pressing issue threatening the sustainability of modern societies. De-spite the large technological advances making our life apparently easier, economic inequality has been on the rise worldwide since 1980. This has become such an issue that most recent datasets show that the top 1% of the wealthy population capture twice as much of the global income growth as the bottom 50% [1]. While such distribution disparity among urbanites and social stratification is currently under deep scrutiny among economists, including the spatial components to such descriptions, it imposes additional methodological dif-ficulties given the vagility of human nature and the heterogeneity of the spatial distribution of resources.
While different views exist regarding the origins of socio-spatial inequalities across cities [2], the conse-quences of poorly integrated societies deeply affect opportunities in key realms of social life that ham-per social cohesion at a local and societal levels [3–
5]. While some discuss causal factors behind socio-spatial inequalities, evidence coming from natural ex-periments have shown direct impacts on particularly vulnerable groups [6]. Such evidence, among others, has tied inequalities to societal imbalances leading to critical states in terms of security, health, and wealth distribution [2,6–9] dreading social cohesion and pre-cluding possibilities of enriching the social capital at particular locations [10–13]. Defining and measuring spatial inequalities remains a complex and elusive task
∗These authors contributed equally to this work. †Corresponding authors: alexandre.evsukoff@coc.ufrj.br.
for which scientists have recognized several dimensions that are, so far, poorly integrated with a general con-ceptual framework [4, 14, 15]. For instance, its pre-cise understanding is often linked to the study objects at hand and the particular methodology employed to study them. Dimensions of inequalities often include the localized concentration of particular groups within cities, the spatial homogeneity of social groups, their accessibility, or more particularly, their distance to downtown [16]. Hence, devising appropriate tools to characterize the spatial distribution of complex socioe-conomic factors may contribute to the urgently needed development of integrative urban planning.
The explosive use of Information and Communica-tion Technologies (ICT), such as cellphones and large databases of user spending behavior, has made huge volumes of non-conventional data available for urban research purposes [17–21]. Knowing the cellphone tower to which we connect permits the reconstruc-tion of our daily trajectories, providing a surprisingly high spatio-temporal resolution of our social interac-tions [22,23]. This approach has been widely used re-cently to assess a variety of topics going from individ-ual mobility patterns [24] and land use patterns [25], to the detection of relevant places of high social activ-ity within the cactiv-ity [26], thereby unveiling the structure and function of cities [25, 27, 28]. Devising an effi-cient mobility infrastructure has long been known as a means for city integration and the increasing availabil-ity of ICT data allows for a new understanding of spa-tial integration patterns and its relationship to mobil-ity, socioeconomic and ethnic stratification [29]. Such highly resolved datasets provide a contextual under-standing of land use that is readily available to derive new measures of social integration in its spatial con-text, thereby contributing to accurate, and near-real-time, descriptions of urban dynamics [30–35]. Many of these studies are based on the concept of activity
space [31,36,37], defined as the set of locations visited by a traveler throughout their daily activities. Differ-ent measures describing the activity space have been studied to understand daily mobility patterns [21,38]. Among these metrics, metrics based on the Shannon entropy are particularly interesting to study human mobility patterns. Indeed, the concept of “Mobility Entropy” indicators has been widely used to measure the diversity of users’ movement pattern [39–42]. It can be used at different scales to evaluate the diversity of trips made by an individual [40,43], the diversity of locations visited by an individual [39, 42] or a group of individuals [29,44].
In this work, we rely on the concept of “Mobility Entropy” from the point of view of visiting locations in order to deepen our understanding of human mo-bility in the context of urban computing by focusing on the concept of attractiveness. We particularly look into mapping the entropy of urban structure using in-creasingly available mobile phone datasets as a tool to provide highly resolved descriptions of the relation-ship between attractiveness and several key aspects of the urban environment such as productivity, educa-tion and ethnic origin in the Rio de Janeiro Metropoli-tan Area of Brazil. We focus here on the diversity of visitors’ residence to measure the attractiveness of a location and then compare our results to economic and social indicators to assess how entropy effectively relates to socioeconomic indicators. We show that entropy is an important descriptor of socioeconomic complexity across this vastly populated area.
MATERIALS AND METHODS The study area and dataset
The study area is the Rio de Janeiro Metropoli-tan Area (RJMA), the second largest urban area in Brazil with 12,145,734 inhabitants. Administratively, the RJMA is a part of the Rio de Janeiro State, of which Rio de Janeiro city (Rio for short) is the state Capital and the largest municipality with 6,320,446 inhabitants and 1,200,177 km2.
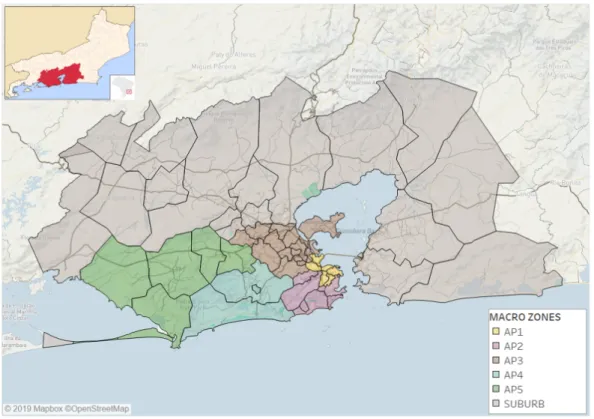
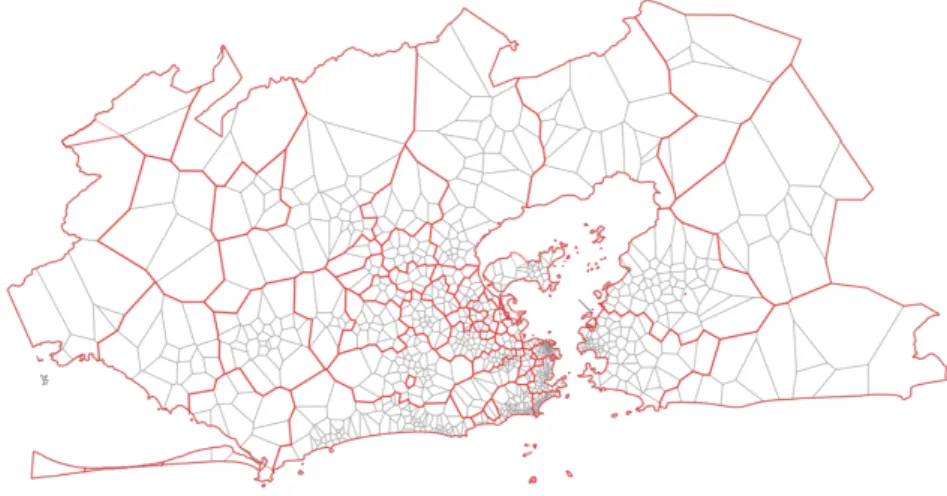
The organization responsible for the demographic census in Brazil is the Institute of Geography and Statistics (IBGE) who follows global standards to ag-gregate census tracts in sub-district, district, city, state, and country levels such that this partitioning can be used for most regions in the world and at different scales. This study relies on such partition-ing, dividing the study area in 49 locations (Figure
1) where the city of Rio is divided in 33 sub-districts aggregated into 5 districts as shown in Figure1. Dis-tricts are called Planning Areas (AP) and represent macro zones of the city with AP1 the center; AP2, the southern zone; AP3, the northern zone; AP4 Barra-Jacarepagu´a; and AP5 depicts the western zone.
Our analysis is based on mobile phone data pro-vided by a Brazilian telecommunication operator. The dataset was collected during 363 days between
Jan-uary and December 2014 across the phone area code 21. We use 2.1× 10⁹ call records originated from 2.9 × 10⁶ anonymized subscribers. Only outgoing voice
call data were made available for this work. We first focused on the identification of user’s residence. The algorithm to detect places of residence is based on the analysis of the most frequently visited locations on evenings and weekends (see the Appendix for more details). This step allows us to discard users not liv-ing in the RJMA and remove users with no significant activity for the analysis. 350, 685 residences were iden-tified.
We then aggregate the data in space and time. Ag-gregated records represent the number of users vij(t)
living in the location i∈ ∣[1, N]∣ and visiting the loca-tion j∈ ∣[1, N]∣ at time t. We spatially aggregate the antennas’ Voronoi polygons in order to obtain N= 49 locations matching the 49 locations composing the RJMA shown in Figure 1. We also divide each day in four 6-hours shifts (Morning, Work, Afternoon and Night) and label each time period t∈ ∣[1, 1452]∣ as ei-ther weekday or weekend, including holidays. More details regarding the data preprocessing are available in Appendix.
Entropy as a measure of attractiveness For each time interval t, there is a probability that a user living in i, will visit location j described by:
pi→j(t) =
vij(t)
∑N
k=1vik(t)
(1) This probability describes the production of visi-tors and is normalized by the total number of users living in location i. In this study, we are interested in the diversity of visitors’ location of residence as a measure of the attractiveness of the destination. We therefore need to compute the probability pj←i that
a user visiting location j lives in location i. To do so, we combine the probability pi→j with census data
to estimate Vij(t), the number of users living at
loca-tion i and visiting the localoca-tion j at time t using the following equation.
Vij(t) = Oipi→j(t), (2)
Oi is the population of location i according to the
2010 IBGE census. We can now compute the prob-ability pj←i(t) for an individual visiting j at time t
that lives in i (Equation3).
pj←i(t) =
Vij(t)
∑N
k=1Vkj(t)
(3) This second probability is thus related to the attrac-tion of visitors, normalized at destinaattrac-tion, and allows us to compute the normalized Shannon entropy as fol-lows,
3
Figure 1. Rio de Janeiro Metropolitan Area (RJMA). The RJMA is composed of 49 locations, 16 municipalities outside the Capital represented in grey and 33 sub-districts inside the Capital, grouped into 5 districts.
Sj(t) = − 1 log(N) N ∑ k=1 pj←k(t)log(pj←k(t)) (4)
Large entropy values (Sj(t) ≈ 1) mean that
peo-ple visiting location j at time t are evenly distributed among all 49 locations, whereas a smaller values of entropy means that people visiting location j at time t tend to be mostly concentrated among few residence locations. The entropy has been widely used to ana-lyze and model human mobility patterns. It can be used in spatial analysis to describe the diversity of individual movement patterns [41] or in spatial inter-action modeling to estimate trip distributions by en-tropy maximization [45] to name a few. It is worth noting that we focus in this work on the analysis of entropy as a measure of attractiveness that can be used as a proxy for complex socioeconomic indicators. It is important to keep in mind that a given entropy value can cover a large variety of situations regarding the distance traveled by visitors. Here, we charac-terize the relationship between traveled distance and entropy by computing the radius of attraction of a location j as the average distance traveled by people visiting j at time t: Rj(t) = N ∑ k=1 pj←k(t)dkj, (5)
where dkj is the distance from location k to j along
the road network between the locations’ centroids
computed using the Google Maps API [46]. This cal-culation is particularly important in the case of Rio due to the presence of mountains, lakes and the Gua-nabara Bay, which makes road distances between cer-tain locations very different from the Euclidean dis-tances.
Finally, we also consider the ratio between the num-ber of visitors divided by the population as a comple-mentary measure of attractiveness.
δj(t) = ∑ N
k=1Vkj(t)
Oj
(6)
Entropy, economic and sociodemographic indicators
Because our entropy index represents a synoptic representation of mobility across the RJMA, we finally seek to describe its impact in terms of well known eco-nomic, social and demographic indicators as collected by the IBGE. We therefore evaluated how the diver-sity of visitors relates to the economic performance of the city by plotting the number of jobs and in-come levels against our entropy estimation. Sociode-mography, in turn, was assessed by establishing the relationship between education levels in primary and secondary (high school) education among the popu-lation resident in each partitioned area. Finally, two developmental indices were chosen to evaluate entropy performance across the RJMA.
0.0 0.2 0.4 0.6 0.8 1.0 0 5 10 15 Entropy Attr activ eness (a) 0.0 0.2 0.4 0.6 0.8 1.0 0 5 10 15 20 25 Entropy Radius of attr action (km) (b) Cluster C1 C2 C3 C4 0.0 0.2 0.4 0.6 0.8 0.6 0.8 1.0 1.2 1.4 1.6 1.8
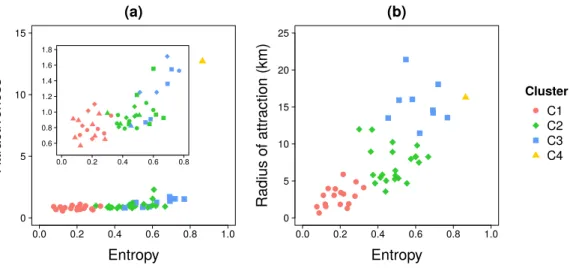
Figure 2. Results of the clustering analysis. Log-log scatter plot of (a) the attractiveness and (b) the radius of attraction in terms of the entropy index. The inset in (a) shows the relationship after removing one outlier (cluster C4). Each dot represents a location within the study area. Indicators have been averaged over the work shift time period during weekdays.
RESULTS
Classification of locations according to their attractiveness
We start our analysis by performing a clustering analysis to group together locations exhibiting simi-lar features regarding their attractiveness. As a first step, we focus on two features across the urban land-scape, the diversity at the origin location and the at-tractiveness at work locations. This led us to average the three indicators for each location (Equations 4,
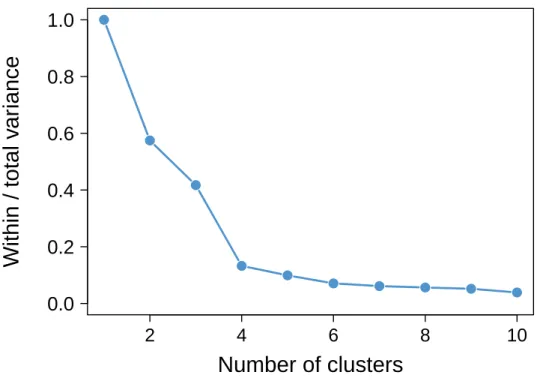
5 and 6) over the work shifts time periods on week-days. Locations are clustered using the k-means algo-rithm based on the three standardized averaged met-rics. The number of clusters were chosen based on the ratio between within-group variance and the to-tal variance (see the Appendix for more details). We obtained four clusters. Clustering results and the re-lationships between the different metrics are shown in Figure2. We observe a positive relationship between metrics, in which attractiveness and radius of attrac-tion tend to increase with the entropy. There is nev-ertheless a strong dispersion around these tendencies with an attractiveness and radius of attraction values that can double for a given entropy value.
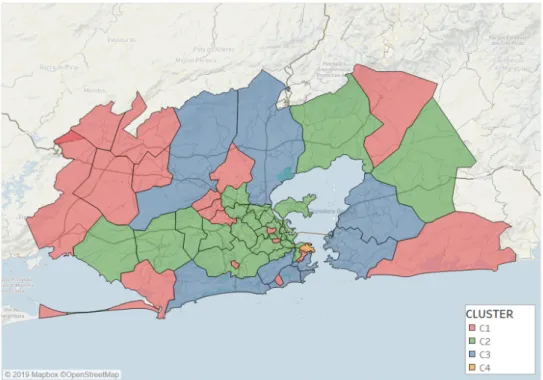
Figure 3 shows the spatial distribution of the four resulting clusters across the whole studied area. Clus-ters are determined by a certain level of attractiveness and can be described as follows:
• C1 (red) represents a low attractive cluster composed of 17 locations. It is characterized by a low entropy, an attractiveness ratio lower than one and a low radius of attraction. Locations in C1 are far from the Rio city center or segregated areas inside the Capital;
• C2 (green) is a cluster of 22 locations, mostly located inside the city. This cluster is
character-ized by medium values of entropy of visitors and radius of attraction, while having an attractive-ness ratio close to one;
• C3 (blue) is an attractive group with 8 loca-tions mostly near to the sea inside Capital. This cluster shares high entropy values, attractive-ness ratio between 1 and 2 and a large radius of attraction;
• C4 (orange) is composed of only one loca-tion that can be considered as an outlier due to its very high attractiveness. The remain-ing three clusters do not change if this outlier is removed before clustering. This location is the business center (Centro) of the city, and is a very attractive cluster with a very large en-tropy (SC4 ≈ 0.9), attractiveness ratio and
ra-dius of attraction (δC4≈ 12). This location
con-centrates most of jobs and visitors from all the RJMA.
Our methodology allows us to detect segregated ar-eas with a very low diversity of visitors and attractive-ness. Figure4shows the comparison of the clustering results with two social development indexes. We focus the discussion in five locations shown in Figure4a: (1) Complexo do Alemo, (2) Jacarezinho (3) Rocinha (4) Complexo da Mar´e and (5) Cidade de Deus. The first four locations are classified by Rio City Hall as favela sub-districts[47] and are shown in purple in Figure4a. The term “favela” is used here in the sense of subnor-mal agglomerate as defined by IBGE [48]: “a form of irregular occupation of land usually characterized by an irregular urban pattern, with scarce essential public services and located in areas not proper or al-lowed for housing use”. In a broad sense, favela also includes urbanized areas, areas that were once subnor-mal agglomerates but have been urbanised, and also housing estates. The favela sub-districts assigned in purple in Figure4a are defined according to Rio City
5
Figure 3. Map of the RJMA that display the spatial distribution of four clusters.
Figure 4. Zoom on Rio de Janeiro city. (a) Favela sub-districts (in purple) and business center (in orange) locations. We focus the discussion in five locations (1) Complexo do Alemo, (2) Jacarezinho, (3) Rocinha, (4) Complexo da Mar, and (5) Cidade de Deus. (b) Clusters spatial distribution. (c) Municipal Human Development Index (MHDI) from 2013. (d) Social Progress Index (IPS) from 2016.
Hall, as the locations with more that 50% of popula-tion living in subnormal agglomerates. In Cidade de Deus, only 13% of the population is living in subnor-mal agglomerates as it is mostly composed by housing
estates building, while its socioeconomic indexes are similar to the favela sub-districts.
Figure 4b shows a zoom in the clustering results. The main favela sub-districts were classified in low
0.0 0.2 0.4 0.6 0.8 1.0 101 103 105 Entropy #Jobs (a) 0.0 0.2 0.4 0.6 0.8 1.0 0.5 1.0 2.0 5.0 10.0 Entropy Income (x 10 3 ) (b) Cluster C1 C2 C3 C4
Figure 5. Economic analysis. Number of jobs (a) and income (in Brazilian Reals) (b) as a function of the entropy index. The entropy have been averaged over the work shift time periods on weekdays.
attractive cluster (C1) as did Cidade de Deus. Com-plexo da Mar´e has also many housing estates building and 54% of its population living in subnormal agglom-erate. It was classified in the medium attractive clus-ter (C2), maybe because it is crossed by two of the main expressways that lead to the exit of the city. In the dataset used in this work, a visitor is detected in a given location by a call recorded within the location, such that some detected visitors may be passing-by the location to reach another destination.
Figure 4c and 4d show two social development in-dexes. In Figure 4c the Municipal Human Develop-ment Index (MHDI), which is an adaptation of the Human Development Index (HDI) for municipalities. The MHDI data were obtained from the Atlas of Hu-man Development in Brazil [49], where the MHDI computed in 2013 is available at the census track level, as so as aggregated values for all municipalities and for district level in metropolitan areas. In Rio, the MHDI is available for the macro zones shown in Figure1and the value for the five locations of interest in Figure4a were obtained from the census track level. The classes and colours used in Figure4c were suggested by the Atlas. All five locations assigned in Figure 4a were classified as medium MHDI and many locations clas-sified in the high attractive cluster (C3) have very high MHDI.
The MHDI is a global index intended to compare the social development in the whole country. The Rio City Hall has adopted the Social Progress Index (IPS), which is more focused on the city characteristics and is based in 32 indicators in three dimensions. The data used in this work were computed in 2016 and obtained from the open data portal of Rio City Hall [50]. The colours and levels presented in Figure 4d are the ones used by the Rio City Hall. It can be seen from Figure4d that all four locations assigned in low attractive cluster (C1) have low IPS (IPS≤ 50). The Complexo da Mar´e sub-district has medium IPS (50≤ IPS≤ 60) and was assigned to the medium attractive cluster (C2). Moreover, most locations assigned to high attractive cluster (C3) have a very high IPS (IPS
≥ 70). There is a very good agreement between the clusters computed from mobility and IPS, as cluster C1 correspond to IPS≤ 50, cluster C2 corresponds to 50≤ IPS ≤ 70 and cluster C3 corresponds to IPS ≥ 70. In the next section, we discuss the relationship be-tween the mobility indicators and the economic and social indicators selected for this study.
Economic activity and sociodemographic factors While transportation mobility has largely been rec-ognized as a major player in the urban economy [51], the recent scrutiny of Call Detail Records (CDR) have expanded our understand of how mobility relates to economic activity across cities [42,52]. We here eval-uated how entropy relates to officially reported job numbers and income levels (Figure5). In spite of the large informal job market known to occur in RJMA, our analysis shows a positive and exponential rela-tionship between formal jobs and entropy (Figure5a). Similar patterns emerge when relating income level with entropy (Figure 5b) as well as with Gross Do-mestic Product (GDP) (see Appendix).
Interestingly, opposite trends emerge when entropy is plotted against demographic indices such as the per-centage of the population having completed primary education and high school degrees. In Figure6, “pri-mary school” refers to the percentage of individuals having primary school or lower education level and “high school” refers to individuals having high school or higher education level. School degrees are posi-tively correlated with income, meaning that higher income locations tend to have higher education levels. In the same way race is negatively correlated with in-come, there is indeed a prevalence of white skin indi-viduals in higher income locations and the prevalence of black skin individuals in lower income locations. As entropy is related to income (Figure5), locations hav-ing a large fraction of its population with a completed primary school diploma or lower exhibit lower entropy values (Figure 6a), while locations with a large
pro-7 0.0 0.2 0.4 0.6 0.8 1.0 30 40 50 60 70 80 90 Entropy % Pr imar y school (a) 0.0 0.2 0.4 0.6 0.8 1.0 20 30 40 50 60 70 Entropy % High school (b) Cluster C1 C2 C3 C4 0.0 0.2 0.4 0.6 0.8 1.0 5 10 20 Entropy % Black (c) 0.0 0.2 0.4 0.6 0.8 1.0 30 40 50 60 70 80 90 Entropy % White (d)
Figure 6. Sociodemographic analysis. Percentage of primary school level education (a), high school level education (b), black people (c), and white people (d) as a function of the entropy index. The entropy have been averaged over the work shift time periods on weekdays.
0.0 0.2 0.4 0.6 0.8 1.0 0.60 0.65 0.70 0.75 0.80 0.85 0.90 0.95 Entropy MHDI (a) 0.0 0.2 0.4 0.6 0.8 1.0 40 50 60 70 80 90 Entropy IPS (b) Cluster C1 C2 C3 C4
Figure 7. Social development indexes. MHDI (a) and IPS (b) as a function of the entropy index. The entropy have been averaged over the work shift time periods on weekdays.
portion with high school or higher education level is positively associated to entropy (Figure 6b). This is strikingly similar to the pattern exhibited by ethnic origin. Black skin population, as well as the percent-age of primary school, also shows a negative relation to entropy (Figure6c), while areas with a larger per-centage of white skin population tend to exhibit higher entropy values (Figure6d).
The entropy of visitors, computed from CDR, re-flects the complexity of indicators usually computed using classical approaches. In fact, entropy seems to be positively associated with socioeconomic indicators such as MHDI and IPS (Figure7), as shown in Figures
5and 6.
Temporal evolution of the attractiveness
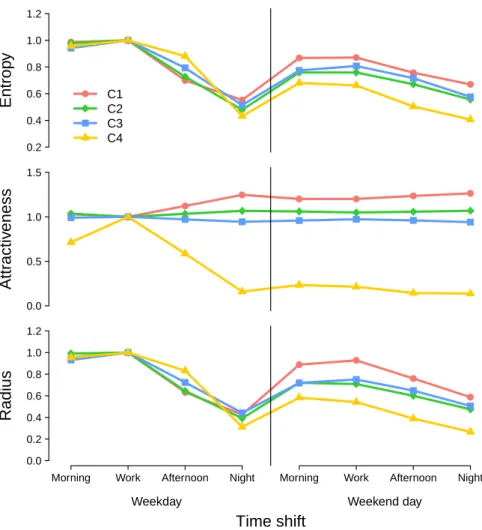
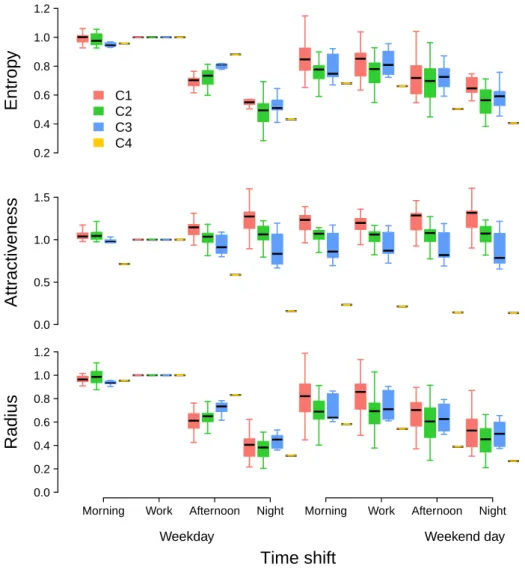
To study the temporal evolution of entropy, attrac-tiveness and radius of attraction, we plot the normal-ized average metric values for each cluster across time shifts (Figure 8). Normalizations are performed us-ing the reference values obtained for the work shift time period on weekdays. We decided here to consider relative, instead of absolute, values in order to make average attractiveness of clusters of locations compa-rable over time. Entropy tends to globally decrease along the day on both weekdays and weekends for ev-ery location whatever the cluster it belongs to. It is, however, interesting to note that the entropy is rela-tively higher during weekday night and weekends for locations classified as low attractive during weekday
0.2 0.4 0.6 0.8 1.0 1.2
Entrop
y
C1 C2 C3 C4 0.0 0.5 1.0 1.5Attr
activ
eness
0.0 0.2 0.4 0.6 0.8 1.0 1.2Radius
Morning Work Afternoon Night Morning Work Afternoon Night
Weekday Weekend day
Time shift
Figure 8. Temporal evolution of the three metrics. From the top to the bottom, entropy, attractiveness and radius of attraction as a function of time by cluster. The values are averaged by cluster and normalized by the value obtained for the work shift during weekdays. A similar plot displaying boxplots instead of average values is available in Appendix.
work shifts compared to highly attractive locations. Indeed, while locations of cluster C4 exhibits an en-tropy index 50% lower than the reference value, it actually represents 80% for cluster C2/C3, and more than 90% for locations belonging to cluster C1. A sim-ilar behavior is observed for the radius of attraction. The situation is slightly different, however, for the at-tractiveness with an increase of the metrics during af-ternoons and night shifts on weekdays for the low at-tractive cluster C1. It further reaches a plateau during the weekend days. The location of cluster C4 shows an opposite behavior with a decreasing attractiveness along the day to reach a plateau during weekend days. The attractiveness remains more or less constant for locations belonging to cluster C2 and C3.
DISCUSSION
The impact of socio-spatial inequalities on urban systems has largely been treated in the urban eco-nomics and sociological literature, but the increas-ing availability of large mobile phone databases has open the possibility to provide a clearer picture of
how different aspects of urban life impact economic and sociodemographic aspects of cities [19]. Going into this direction, this work presents the results of the processing of 2.1 Billion records collected from 2 million users in the Rio de Janeiro Metropolitan Area, Brazil, during the whole year of 2014, plac-ing this research among the largest analysis, to our knowledge, used to relate mobility and its link to so-cioeconomic complexity in Brazil. We hereby illus-trate the potential of combining mobile phone data with entropy-based metrics to measure the attractive-ness of a location. This may prove useful to urban planners and managers when it comes to describe and plan for complex socioeconomic indicators. While it is known that mobility is in fact related to economic ac-tivity, this work presents an effective and simple way to measure such relationships from increasingly avail-able ICT data such as mobile phone datasets.
While most capital cities in South America suffer from a disproportionate growth compared to other ur-ban settlements [53], common patterns of spatial in-equalities show that underprivileged populations es-tablish themselves away from highly productive cen-tral zones [30,54], with often clear differences among
9 the usage of urban infrastructure [55]. In this sense,
the particular and complex topography of Rio de Janeiro would suggest the existence of shared usage patterns of the city among urbanites coming from dif-ferent social contexts. The spatial partitioning em-ployed in our study closely matches IBGE delineation, we are therefore able to compare official statistics with measures derived from CDR data and offer specific in-sights regarding the usage of ICT as proxies for the spatial distribution of complex socioeconomic indica-tors derived from mobile phone datasets. Our analysis shows that the attractiveness of a district measured with the diversity of visitors’ place of residence is cor-related with the income and the number of jobs in spite of the large informal job market of Rio [32].
We also show that the attractiveness is lower in areas hosting a large percentage of the population with African descent and/or locations where primary school training is prevalent (Figure6a,c). While this points to previous descriptions showing how available schooling options closely reproduce residential pat-terns of socio-spatial segregation [56,57], the spatial mismatch and highly productive Centro area, where work opportunities are concentrated in the RJMA, leads us to think that residential segregation of the poorest is reinforced by new inequalities when taking into account daily mobility opportunities. Unfortu-nately, and in spite of using state-of-the-art descrip-tors of urban diversity, we are able to corroborate a well-known trend in which areas with large African de-scendant populations are still syndicated as an indica-tor of social inequality. This poses important planning challenges to historical areas such as the RJMA, where
almost one million enslaved Africans were estimated to arrive in the XVIIth century [58].
The observed results concur on recent developments in the scientific literature that show how mobile phone information can be used to evaluate the socioeconomic state of spatially heterogeneous regions [43,59,60], es-pecially in developing countries. Moreover, the RJMA is a very particular case study where socioeconomic isolated districts are placed in-between richer areas, as well as in the periphery, which is more common in greater cities of developing countries. This particular characteristic of the city allows to validate the results, as the clusters accurately identified favelas and other socioeconomic isolated districts, as shown in Fig. 4.
In summary, this manuscript serves to illustrate the potential of mobile phone data combined with entropy-based metrics for measuring the attractive-ness of a location that can be used as a proxy for complex socioeconomic indicators. Even if the spa-tial partitioning used in this study tends to reduce the level of spatial uncertainty inherent in this type of data sources [61], it would be interesting to repro-duce the results with different datasets coming form different sources of mobility information.
ACKNOWLEDGEMENTS
JCC, VFV, MAHBS and AGE acknowledge the funding granted by The Rio de Janeiro State Research Agency (FAPERJ) and by the Getulio Vargas Foun-dation. The work of ML was funded by the French National Research Agency (grant number ANR-17-CE03-0003). HS was funded by FONDECYT-CONICYT Chile (grant no. 1161280).
[1] F. Alvaredo, L. Chancel, T. Piketty, E. Saez, and G. Zucman. World inequality report 2018. Belknap Press, 2018.
[2] J. Ruiz-Tagle. A theory of socio-spatial integration: Problems, policies and concepts from a us perspective. International Journal of Urban and regional research, 37(2):388–408, 2013.
[3] P. A. Jargowsky. Poverty and place: Ghettos, bar-rios, and the American city. Russell Sage Foundation, 1997.
[4] D. S. Massey. American apartheid: Segregation and the making of the underclass. American journal of sociology, 96(2):329–357, 1990.
[5] W. J. Wilson. The truly disadvantaged: The inner city, the underclass, and public policy. University of Chicago Press, 2012.
[6] D. Cutler and E. Glaeser. Are ghettos good or bad? The Quarterly Journal of Economics, 112(3):827–872, 1997.
[7] M. Garreton and R. S´anchez. Identifying an optimal analysis level in multiscalar regionalization: A study case of social distress in greater santiago. Computers, Environment and Urban Systems, 56:14–24, 2016. [8] N. Krieger. Embodying inequality: a review of
cepts, measures, and methods for studying health
con-sequences of discrimination. International journal of health services, 29(2):295–352, 1999.
[9] D. S. Massey and N. A. Denton. The dimensions of residential segregation. Social forces, 67(2):281–315, 1988.
[10] G. Bolt, J. Burgers, and R. Van Kempen. On the so-cial significance of spatial location; spatial segregation and social inclusion. Netherlands Journal of Housing and the built Environment, 13(1):83, 1998.
[11] S. Farber, M. O’Kelly, H. Miller, and T. Neutens. Measuring segregation using patterns of daily travel behavior: A social interaction based model of expo-sure. Journal of Transport Geography, 49:26–38, 2015. [12] S. Farber, T. Neutens, H. Miller, and X. Li. The social interaction potential of metropolitan regions: A time-geographic measurement approach using joint accessibility. Annals of the Association of American Geographers, 103(3):483–504, 2013.
[13] R. Forrest and A. Kearns. Social cohesion, so-cial capital and the neighbourhood. Urban studies, 38(12):2125–2143, 2001.
[14] R. Louf and M. Barthelemy. Patterns of residential segregation. PloS one, 11(6):e0157476, 2016.
[15] V. Netto, E. Brigatti, J. Meirelles, F. Ribeiro, B. Pace, C. Cacholas, and P. Sanches. Cities, from
information to interaction. Entropy, 20(11):834, 2018. [16] T. Caldeira. Fortified enclaves: The new urban segre-gation. In The urban sociology reader, pages 419–427. Routledge, 2012.
[17] M. Batty. Big data, smart cities and city planning. Dialogues in Human Geography, 3(3):274–279, 2013. [18] L. Bettencourt, H. Samaniego, and H. Youn.
Profes-sional diversity and the productivity of cities. Scien-tific Reports, 4:5393, 2014.
[19] V. D. Blondel, A. Decuyper, and G. Krings. A survey of results on mobile phone datasets analysis. EPJ data science, 4(1):10, 2015.
[20] T. Louail, M. Lenormand, J. M. Arias, and J. J. Ra-masco. Crowdsourcing the robin hood effect in cities. Applied network science, 2(1):11, 2017.
[21] H. Barbosa, M. Barthelemy, G. Ghoshal, C. R. James, M. Lenormand, T. Louail, R. Menezes, J. J. Ramasco, F. Simini, and M. Tomasini. Human mobility: Models and applications. Physics Reports, 734:1–74, 2018. [22] J.-P. Onnela, J. Saram¨aki, J. Hyv¨onen, G. Szab´o,
D. Lazer, K. Kaski, J. Kert´esz, and A.-L. Barab´asi. Structure and tie strengths in mobile communication networks. Proceedings of the national academy of sci-ences, 104(18):7332–7336, 2007.
[23] C. Panigutti, M. Tizzoni, P. Bajardi, Z. Smoreda, and V. Colizza. Assessing the use of mobile phone data to describe recurrent mobility patterns in spa-tial epidemic models. Royal Society open science, 4(5):160950, 2017.
[24] M. C. Gonzalez, C. A. Hidalgo, and A.-L. Barab´asi. Understanding individual human mobility patterns. Nature, 453(7196):779, 2008.
[25] M. Lenormand, M. Picornell, O. G. Cant´u-Ros, T. Louail, R. Herranz, M. Barthelemy, E. Fr´ıas-Mart´ınez, M. San Miguel, and J. J. Ramasco. Com-paring and modelling land use organization in cities. Royal Society open science, 2(12):150449, 2015. [26] M. G. Beir´o, L. Bravo, D. Caro, C. Cattuto, L.
Fer-res, and E. Graells-Garrido. Shopping mall attraction and social mixing at a city scale. EPJ Data Science, 7(1):28, 2018.
[27] T. Louail, M. Lenormand, O. G. Cant´u-Ros, M. Pi-cornell, R. Herranz, E. Frias-Martinez, J. J. Ramasco, and M. Barthelemy. From mobile phone data to the spatial structure of cities. Scientific reports, 4:5276, 2014.
[28] B. Sotomayor-G´omez and H. Samaniego. City limits in the age of smartphones and urban scaling. Com-puters, Environment and Urban Systems, 79:101423, 2020.
[29] F. Lamanna, M. Lenormand, M. H. Salas-Olmedo, G. Romanillos, B. Gon¸calves, and J. J. Ramasco. Im-migrant community integration in world cities. PLOS ONE, 13(3):e0191612, 2018.
[30] T. Dannemann, B. Sotomayor-G´omez, and H. Samaniego. The time geography of segrega-tion during working hours. Royal Society open science, 5(10):180749, 2018.
[31] S. Jiang, J. Ferreira, and M. C. Gonzalez. Activity-based human mobility patterns inferred from mobile phone data: A case study of singapore. IEEE Trans-actions on Big Data, 3(2):208–219, 2017.
[32] B. Motte, A. Aguilera, O. Bonin, and C. D. Nassi. Commuting patterns in the metropolitan region of rio de janeiro. what differences between formal and infor-mal jobs? Journal of Transport Geography, 51:59–69,
2016.
[33] B. Rubim and S. Leit˜ao. O plano de mobilidade urbana e o futuro das cidades. Estudos avan¸cados, 27(79):55–66, 2013.
[34] J. L. Toole, S. Colak, B. Sturt, L. P Alexander, A. Ev-sukoff, and M. C. Gonz´alez. The path most traveled: Travel demand estimation using big data resources. Transportation Research Part C: Emerging Technolo-gies, 58:162–177, 2015.
[35] C. Song, Z. Qu, N. Blumm, and A.-L. Barab´asi. Limits of predictability in human mobility. Science, 327(5968):1018–1021, 2010.
[36] T. H¨agerstrand. What about people in regional sci-ence? Papers in regional science, 24(1):6–21, 1970. [37] S. Sch¨onfelder and K. W. Axhausen. Activity spaces:
measures of social exclusion? Transport policy, 10(4):273–286, 2003.
[38] S. Phithakkitnukoon, Z. Smoreda, and P. Olivier. Socio-geography of human mobility: A study us-ing longitudinal mobile phone data. PloS one, 7(6):e39253, 2012.
[39] M. Lin, W.-J. Hsu, and Z. Q. Lee. Predictability of individuals’ mobility with high-resolution positioning data. In Proceedings of the 2012 ACM Conference on Ubiquitous Computing, UbiComp ’12, pages 381– 390, Pittsburgh, Pennsylvania, 2012. Association for Computing Machinery.
[40] L. Pappalardo, M. Vanhoof, L. Gabrielli, Z. Smoreda, D. Pedreschi, and F. Giannotti. An analytical frame-work to nowcast well-being using mobile phone data. International Journal of Data Science and Analytics, 2(1):75–92, 2016.
[41] M. Vanhoof, W. Schoors, A. V. Rompaey, T. Ploetz, and Z. Smoreda. Comparing regional patterns of in-dividual movement using corrected mobility entropy. Journal of Urban Technology, 25(2):27–61, 2018. [42] C. Cottineau and M. Vanhoof. Mobile Phone
Indi-cators and Their Relation to the Socioeconomic Or-ganisation of Cities. ISPRS International Journal of Geo-Information, 8(1):19, 2019.
[43] L. Pappalardo, D. Pedreschi, Z. Smoreda, and F. Gi-annotti. Using big data to study the link between human mobility and socio-economic development. In 2015 IEEE International Conference on Big Data (Big Data), pages 871–878, 2015.
[44] M. Lenormand, S. Luque, J. Langemeyer, P. Tenerelli, G. Zulian, I. Aalders, S. Chivulescu, P. Clemente, J. Dick, J. van Dijk, M. van Eupen, R. C. Giuca, L. Kopperoinen, E. Lellei-Kov´acs, M. Leone, J. Lieskovsk´y, U. Schirpke, A. C. Smith, U. Tappeiner, and H. Woods. Multiscale socio-ecological networks in the age of information. PLOS ONE, 13(11):1–16, 2018.
[45] A. G. Wilson. The use of entropy maximising models, in the theory of trip distribution, mode split and route split. Journal of Transport Economics and Policy, 3(1):108–126, 1969.
[46]https://developers.google.com/maps/ documentation/distance-matrix/. [47]http://bit.ly/2O9SEdA(in portuguese). [48]http://bit.ly/337gQlb.
[49]www.atlasbrasil.org.br. [50]www.data.rio.
[51] G. Duranton and D. Puga. Micro-foundations of ur-ban agglomeration economies. In Handbook of Re-gional and Urban Economics, volume 4, pages 2063–
11 2117. Elsevier, 2004.
[52] Y. Xu, A. Belyi, I. Bojic, and C. Ratti. Human mo-bility and socioeconomic status: Analysis of singapore and boston. Computers, Environment and Urban Sys-tems, 72:51–67, 2018.
[53] J. V. Henderson. Urban development: Theory, fact, and illusion. Oxford University Press, 1991.
[54] F. Sabatini. The Social Spatial Segregation in the Cities of Latin America. Technical report, Inter-American Development Bank, 2006.
[55] L. Lotero, R. G. Hurtado, L. M. Flor´ıa, and J. G´omez-Garde˜nes. Rich do not rise early: spatio-temporal patterns in the mobility networks of differ-ent socio-economic classes. Royal Society open sci-ence, 3(10):150654, 2016.
[56] C. A. Flores. Residential segregation and the geogra-phy of opportunites: a spatial analysis of heterogeneity
and spillovers in education. PhD thesis, LBJ School of Public Affairs, University of Texas, 2008.
[57] H. Li, H. Campbell, and S. Fernandez. Resi-dential segregation, spatial mismatch and economic growth across us metropolitan areas. Urban Studies, 50(13):2642–2660, 2013.
[58] M. C. Karasch. Slave life in Rio de Janeiro, 1808-1850. Princeton University Press, 1987.
[59] N. Eagle, M. Macy, and R. Claxton. Network diversity and economic development. Science, 328(2010):1029– 1031, 2010.
[60] J. Blumenstock, G. Cadamuro, and R. On. Predict-ing poverty and wealth from mobile phone metadata. Science, 350(6264):1073–1076, 2015.
[61] M. Lenormand, T. Louail, M. Barthelemy, and J. J. Ramasco. Is spatial information in ICT data reliable? In proceedings of the 2016 Spatial Accuracy Confer-ence, 9-17, Montpellier, France., 2016.
APPENDIX
Data preprocessing
Spatial aggregation
In this work, in order to link mobility results directly to socioeconomic data, each geographic unit is the union of Voronoi polygons of antennas (Figure A1) matching the geographic limits of the 49 locations (Figure S1). This makes the set of regions outlined here directly related to the respective locations and, consequently, to the census data and many other sources.
Figure S1. Spatial distribution of antennas with their respective Voronoi polygons.
Figure S2. Spatial overlap between the aggregation of Voronoi cells and the districts’ spatial polygons.
Temporal aggregation
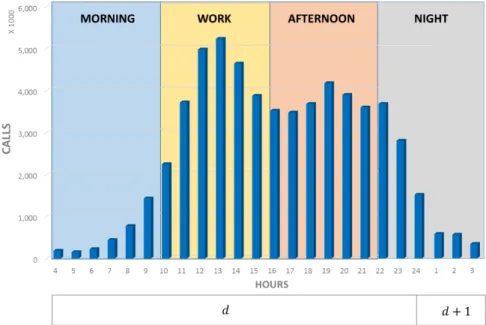
In addition to the spatial partitioning, the results were aggregated for each day in the data set. The four shifts considered the distribution of activities throughout one day. The time shift with the smallest number of records was 04:00 AM, as shown in Figure S3.
13
Figure S3. Number of calls per hour and the partition of time shifts. Total number of calls made in the RJMA in 2014 (including weekdays and weekends).
Identification of the users place of residence
The presumed residence of each user was computed as the most visited Voronoi cell between 08:00PM and 06:00AM during workdays and the entire day on Sundays and holidays. We additionally required that the user to be regularly detected in this cell (at least five times) and that the number of visits at the most frequented cell is always greater than the number of visits at the second most frequented cell. The final dataset containing only users with an identified residence ended up to be 350, 685 mobile phone users. As mentioned above, the data were aggregated spatially by assigning each Voronoi cell to one of the 49 districts. The identification of the users place of residence was then evaluated using data from the IBGE 2010 census. As it can be observed in Figure S4we obtained a good match between the census data and the residence identified with mobile phone data with a Pearson correlation coefficient equal to 0.9.
0 10 20 30 40 50 0 200 400 600 800 1000
Number of mobile phone users (x 103)
Number of inhabitants (x
10
3 )
R
2=
0.81
Figure S4. Number of mobile phone users with an identified residence in the RJMA as a function of the number of inhabitants in the 49 locations.
Clustering analysis
2
4
6
8
10
0.0
0.2
0.4
0.6
0.8
1.0
Number of clusters
Within / total v
ar
iance
Figure S5. Ratio between the within-group variance and the total variance as a function of the number of clusters.
Economic activity
0.0
0.2
0.4
0.6
0.8
1.0
10
310
510
7Entropy
GDP
Cluster
C1
C2
C3
C4
Figure S6. Global Domestic Product (GDP) as a function of the entropy index. The entropy have been averaged over the work shift time periods on weekdays.
15 Temporal evolution 0.2 0.4 0.6 0.8 1.0 1.2
Entrop
y
C1 C2 C3 C4 0.0 0.5 1.0 1.5Attr
activ
eness
0.0 0.2 0.4 0.6 0.8 1.0 1.2Radius
Morning Work Afternoon Night Morning Work Afternoon Night
Weekday Weekend day
Time shift
Figure S7. Temporal evolution of the three metrics. From the top to the bottom, Tukey boxplots of the entropy, attractiveness and radius of attraction as a function of time by cluster. The values are normalized by the value obtained for the work shift during weekdays.