HAL Id: hal-03138295
https://hal.inrae.fr/hal-03138295
Submitted on 11 Feb 2021HAL is a multi-disciplinary open access archive for the deposit and dissemination of sci-entific research documents, whether they are pub-lished or not. The documents may come from teaching and research institutions in France or abroad, or from public or private research centers.
L’archive ouverte pluridisciplinaire HAL, est destinée au dépôt et à la diffusion de documents scientifiques de niveau recherche, publiés ou non, émanant des établissements d’enseignement et de recherche français ou étrangers, des laboratoires publics ou privés.
Claire Bourlieu, Nathalie Barouh, Jeanne Kergomard, Olivia Ménard, Didier
Dupont, Pierre Villeneuve, V. Vié, Marie-Caroline Michalski
To cite this version:
Claire Bourlieu, Nathalie Barouh, Jeanne Kergomard, Olivia Ménard, Didier Dupont, et al.. Polar Lipids. Handbook of Dairy Foods Analysis, CRC Press, 2021, 978-0367343132. �hal-03138295�
9
Polar Lipids
Claire Bourlieu, Nathalie Barouh, Jeanne Kergomard,
Olivia Ménard, Didier Dupont, Pierre Villeneuve,
Véronique Vié, and Marie-Caroline Michalski
Agropolymer Research and Emerging Technologies9.1 INTRODUCTION
9.1.1 Definition of Milk Polar liPiDs
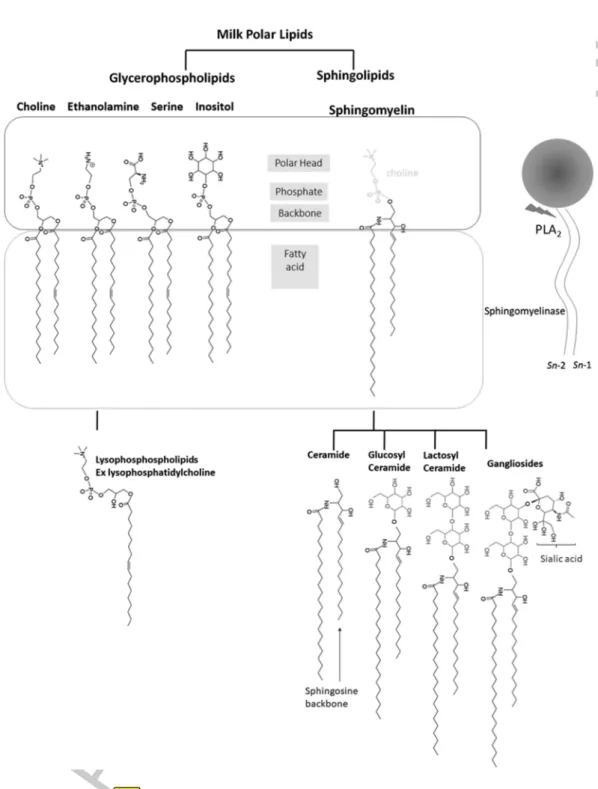
Milk polar lipids (MPL) are a minor (0.2%–1% w/w) but a very bioactive fraction of cow’s milk, otherwise mainly based on triacylglycerols (TG) (97%–98% w/w, Table 9.1). MPL include two main types of compounds, glycerophospholipids and sphingolipids (Figure 9.1). MPL is a more generic and more appropriate term than phospholipids as it also covers other lipids having an important polar part but no phosphate moieties such as ceramides or glycosylated ceramides. The two main types of MPL constitute, associated with proteins, cholesterol and other minor compounds, the trilayered membrane that surrounds and stabilizes the milk fat globules in all mammalian milks, the so-called milk fat globule membrane (MFGM).
CONTENTS
9.1 Introduction ... 195
9.1.1 Definition of Milk Polar Lipids ... 195
9.1.2 Global Concentration and Composition in Various Dairy Products ... 198
9.1.3 Interesting Nutritional and Functional Properties of Dairy Polar Lipids ... 199
9.2 Extraction, Fractionation, and Special Attention to Be Paid Prior to Dairy Polar Lipids Analysis ...202
9.2.1 Special Attention to Be Paid ...202
9.2.2 Extraction and Fractionation Procedures ...202
9.3 Chemical Analyses of Dairy Polar Lipids ...207
9.3.1 Assessing Global Content in Polar Lipids ...207
9.3.2 Fatty Acid Analysis of the Different Phospholipid Species ...207
9.3.3 Determination of Dairy Phospholipid and Sphingolipid Main Classes and Their Quantification ...209
9.3.3.1 Thin-Layer Chromatography (TLC) ...209
9.3.3.2 High-Pressure Liquid Chromatography (HPLC) ...209
9.3.4 Determination of Dairy Phospholipid and Sphingolipid Structure by Mass Spectrometry (MS) ... 215
9.3.4.1 MS/MS Applied to SM and Ceramides ... 222
9.3.4.2 Isolation of Gangliosides Fraction Prior to MS/MS Analysis ... 222
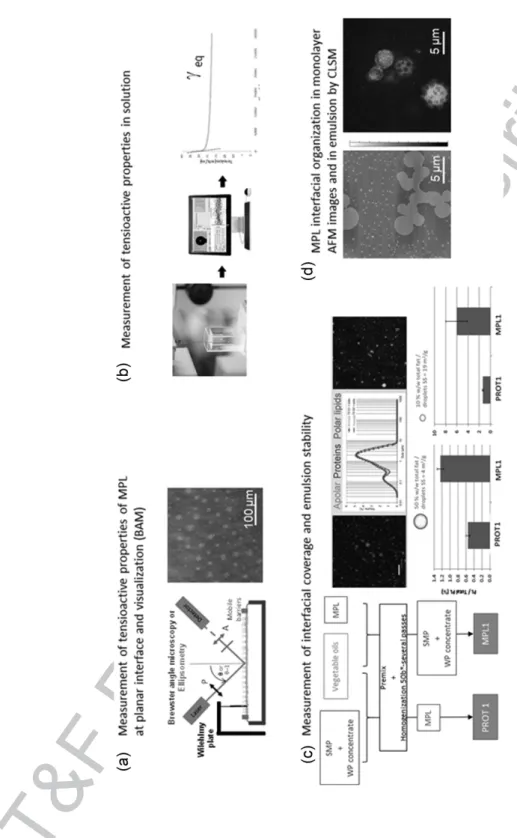
9.4 Physical Properties of Dairy Polar Lipids ... 223
9.4.1 Tensioactive Behavior Characterization ... 223
9.4.2 Emulsifying and Foaming Properties Evaluation ... 223
9.5 Other Analytical Cutting-Edges Technologies ...225
Abbreviations ...225
The MFGM presents a complex organization and composition which reflects the secretory past of the milk fat globule: it is based on a complex mixture of proteins, polar and apolar lipids which make up to 90% of its dry weight. The most numerous polar lipids (PL) in the MFGM are glycero-phospholipids, based on a glycerol backbone esterified in sn-1 and sn-2 position with acyl chains and in sn-3 position bound to a polar head via a phosphoester link. Irrespective of the mammalian milk considered, the major classes of glycerophospholipids present are phosphatidylcholine (PC), phosphatidylethanolamine (PE), phosphatidylinositol (PI), and phosphatidylserine (PS).
Other important class of MPL are sphingolipids, among which sphingomyelin (SM) is the most abundant. Sphingolipids contain a long-chain base, the so-called sphingoid base (i.e., a 2-aminoalk[ane or ene]1,3-diol with 2S, 3R stereochemistry). Sphingoid bases can differ by chain length, number of double bonds, and hydroxyl moieties, varying significantly among liv-ing organisms [9]. However, little difference in sphliv-ingoid base occurs within a given specie; for instance, sphingosine (d18:1) is the principal sphingoid base in human and bovine milks, but other species including unsaturations or other chain lengths can be found in other mammalian species. Sphingosine forms a ceramide when its amino group is linked via an amide bond with a fatty acid (FA), which is generally saturated. Ceramide (CER) further constitutes the molecular backbone for the synthesis of other sphingolipids, including SM. SM is a dominant PL class in mammalian milk sphingolipids and it is composed of a phosphorylcholine head group linked to the ceramide; thereby, unlike other sphingolipids, SM is also a phospholipid (Figure 9.1). Three other minor classes of MPL also frequently detected in bovine milk are displayed in Figure 9.1, lysophophatidylcholine (LPC), glucosylceramide (GluCer), and lactosylceramide (LacCer). GluCer is one of the monogly-cosylceramides, which are also called cerebrosides. When one or more sialic group(s) are added to oligoglycosylceramides, the obtained molecules belongs to the gangliosides class [10–12].
MPL are asymmetrically distributed among the MFGM layers. The choline-containing PL, PC and SM, and the glycolipids (cerebrosides and gangliosides) are largely located on the outside of the membrane, with SM being colocalized with cholesterol in the condensed microdomains, the
TABLE 9.1
Main Classes of Lipids Present in Cow’s Milk Lipids
Class Wt (%) References
Triacylglycerol 97–98 [3]
1,2-Diacylglycerol 0.3–0.6 [4]
Free fatty acid 0.1–0.4 [4]
Monoacylglycerol 0.2–0.4 [4] Sterol Cholesterol 0.4–0.5 0.4–0.5 [5,6]
Sterol ester ~ 10% of sterol [3]
Hydrocarbon Traces [3] Polar lipids (% of total PL) Phosphatidylserine (PS) Phosphatidylinositol (PI) Sphingomyelin (SM) Phosphatidylcholine (PC) Phosphatidylethanolamine (PE) Ceramide (CER) Cerebroside Ganglioside 0.2–1.0 2.3–9.1 2.0–10.3 19.9–35.3 26.8–33.6 22.3–36.4 Traces 0.1 0.01 [7] [8]
so-called lipid rafts [13,14]. In turn, PE, PS, and PI are mainly concentrated in the inner surface of the membrane, originally derived from the endoplasmic reticulum of the lactating cell [15].
A large amount of data has been produced on cow’s MPL, paradoxically more than on human milk. Yet, the problem of producing more biomimetic infant formulas to complement breastfeeding [16,17] has boosted research on human MPL, including the colostrum [18,19]. Recent and com-prehensive reviews on the nutritional properties and analysis MPL have been reported [20–22]. FIGURE 9.1 Typical molecules present in milk polar lipids. Legend: sphingosine backbone (d18:1) in blue, glycosylation in pink, sialic acid moiety in purple. Abbreviation: sn stands for stereonumbering.
Recent analyses have reported the composition of MPL in various other mammalian milks, including ewe, goat, buffalo, or cow’s dairy milks (Table 9.2).
The objective of the present chapter is to be more focused on MPL analyses. For the sake of simplicity, most of the chapter will focus on cow’s PL, which is also the most produced and con-sumed worldwide, but several concepts can be extrapolated to other dairy sources. Cutting-edge analytical technologies applied to other MPL sources, for instance, human MPL, will also be presented when they are of interest to the readers.
9.1.2 Global ConCentration anD CoMPosition in Various Dairy ProDuCts
MPL are found under their native form around milk fat globule in raw milk at a concentration of 480–530 mg/L and get either concentrated or segregated during milk processing (Figure 9.2). A typical composition of MPL for bovine MFGM would correspond to 35% PC, 30% PE, 25% SM, 5% PI, and 3% PS [3,15].
Variations of MPL total content in raw milk can be explained by agricultural practices, for exam-ple, genetics/breed, stage of lactation, diet, environmental, and seasonal factors [33]. Because diet can be easily modified, its influence on milk MPL has been analyzed by several authors [34–36]. Supplementing cow’s diet with unsaturated lipids generally results in more unsaturated lipids in total lipids but also in smaller milk fat globules, and thus an increase in MPL [32,37–39]. A concomitant TABLE 9.2
Recent Articles Reporting the MPL Composition of Nonbovine Nor Human Milks
Milk Source MPL Classes (%)
Range of
Concentration Main Comments Refs. Buffalo PE (31), SM (31),
PC(30), PI (4), PS (4)
3.2 mg/g fat SC, high amount of palmitic, 61% SFA, Main PL = SM/PE/PC
[23] Camel PE (36), SM (28), PC
(26), PI (6), PS (5), PA, EPLAS, aaPC
257.0–660.3 mg/L, 4.7 mg/g fat
Very rich in PL, no SC, high amount of oleic acid in PL, high amount of ω3, 45% SFA, main PL = PE [23,24] Dromedary PC (41), PE (23), PS (21), PI (15) 60–66 mg/L No SM reported in study [25] Donkey SM (36), PE (31), PC (25), PI (4), PS (4), LPC 2.9–38.9 mg/L, 4.0 mg/g fat
SC starting at C8:0, high amount palmitic and oleic, SFA = 50%, source of ω3, main PL = SM [23,36,27] Goat PE (29), PC (26), SM (23), PS (8), LaCcer (8), PI (6), LPC 195.5–281.6 mg/L, 50–80 mg/g fat
More PL than bovine but ~ human milk;
longer and less saturated fatty acids [28–30,26,31,32] Mare SM (29), PC (17), PE
(15), PI (9), PS (9), LPC, aaPC, LPA, LPE, PA, EPLAS
52.6–87.9 mg/L, 10.8 mg/g fat
Lower amount of PL than human milk, main PL = SM, interesting source of ω3
[24] Sheep PE (32–36), PC (27–30), SM (26–28), LaCcer (5), PS (3–5), PI (3–4), LPC 308.1 mg/L, 4.3 mg/g fat
More PL than bovine but less than human milk; shorter and more saturated fatty acids (SFA = 47%), SC and MC, high amount of oleic acid, source of ω3, main PL = PE
[23,28,29,30,31]
Abbreviations: aaPC, alkyl-acyl phosphatidylcholine; CL, cardiolipin; EPLAS, phosphatidylethanolamine plasmalogen (alkenyl-acyl chains); LaCcer, lactosylceramide; LPA, lysophosphatidic acid; LPC, lysophosphatidylcholine; LPE, lyso-phosphatidylethanolamine; LPS, lysophosphatidylserine; PA, phosphatidic acid; PC, phosphatidylcholine; PE, phospha-tidylethanolamine; PG, phosphatidylglycerol; PI, phosphatidylinositol; PL, polar lipids; PS, phosphatidylserine; SC, short chain; SFA, saturated fatty acids; SM, sphingomyelin
increase in SM was described, for instance, by Lopez et al. [34]. Ferreiro et al. [40] compared conven-tional milk with organic or conjugated linoleic enriched milks. They evidenced a higher PL content in organic milk (335 mg/kg milk) compared to conventional production (310 mg/kg milk).
In several dairy products, milk fat is not found under its native form, and the various processes applied to stabilize and standardize the product modify the fat ultrastructure [41–43]. Indeed, these processes imply shearing forces or heat treatments that can lead to a specific partition or reorga-nization of fat in the product. Most mechanical processes (agitation, homogereorga-nization, aeration, or churning) lead to the release in the MPL and MFGM components into the aqueous phase. More specifically, concentration of fat to make butter is done by phase inversion, resulting in the concen-tration of MFGM components in two milk co-products: buttermilk and butterserum. Buttermilk (BM) refers to the liquid phase released during churning (destabilization) of cream in the butter making process [44,45], while butterserum (BS) is the liquid phase obtained when the butter is fur-ther transformed by centrifugation into anhydrous milk fat [46]. Progressive concentration can be followed expressing PL/fat ratios, which is around 0.9% in raw milk, and reaches 22% in buttermilk and 44% in butterserum (Figure 9.2).
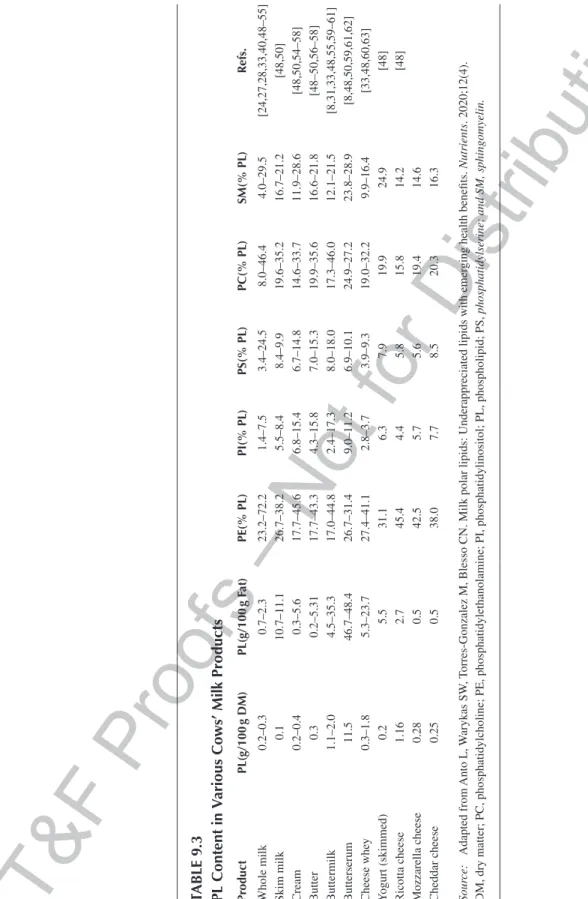
The typical content and MPL classes encountered in various dairy products was recently summarized by Anto et al. [22] and is displayed in Table 9.3.
9.1.3 interestinG nutritionalanD funCtional ProPertiesof Dairy Polar liPiDs
Several recent publications and reviews have underlined the nutritional interest of MPL for general or specific populations (seniors, infants, athletes, etc.). The range of bioactivities of MPL compo-nents is large with proven hypocholesterolemic effect of PC [64,65] and SM [66,67], antiviral and microbiota regulation of gangliosides, positive effect on cognitive function of phosphatidylserine [68,69], preventive effect against weight gain during high fat diet, and favorable modulation of gut microbiota of MPL total extracts [70]. Sphingolipids are known to be highly bioactive molecules of nutritional interest [71], and the effect of milk sphingomyelin on dysfunctional lipid metabolism, gut dysbiosis, and inflammation has been reviewed recently [72]. A recent study in overweight postmenopausal women has demonstrated [73] that MPL could reduce cardiovascular risk factors. A summary of the multiple bioactivities of MPL demonstrated among humans or for which human trials are still ongoing is proposed in Figure 9.3.
Milk Skimming 3.6-5.2 % fat PL=0.04-0.05 % 20-40 % fat PL=0.2 % PL/fat=0.5-0.8 % 82 % fat PL=0.2 % PL/fat=0.5 % > 98 % fat PL=0.01 % 2.1 % fat PL=0.9 % PL/fat=44 % 0.6 % fat PL=0.13-0.2 % PL/fat=22 % 0.06 % fat PL=0.015 % PL/fat=25 % PL/fat=0.9 % Physical maturation physique/churning Clarification
Cream Butter Anhydrous milk fat
Butterserum Buttermilk
Skimmed-milk
FIGURE 9.2 Ranges and specific concentrations of various dairy products in polar lipids (PL). (Based on Rombaut R, et al. Phospho, and sphingolipid distribution during processing of milk, butter and whey.
TA B LE 9 .3 PL C on te nt i n V ar io us C ows ’ M ilk P ro du ct s Pr oduct PL(g/100 g DM) PL(g/100 g Fat) PE(% PL) PI(% PL) PS(% PL) PC(% PL) SM(% PL) Refs. Whole milk 0.2–0.3 0.7–2.3 23.2–72.2 1.4–7.5 3.4–24.5 8.0–46.4 4.0–29.5 [24,27,28,33,40,48–55] Skim milk 0.1 10.7–11.1 26.7–38.2 5.5–8.4 8.4–9.9 19.6–35.2 16.7–21.2 [48,50] Cream 0.2–0.4 0.3–5.6 17.7–45.6 6.8–15.4 6.7–14.8 14.6–33.7 11.9–28.6 [48,50,54–58] Butter 0.3 0.2–5.31 17.7–43.3 4.3–15.8 7.0–15.3 19.9–35.6 16.6–21.8 [48–50,56–58] Buttermilk 1.1–2.0 4.5–35.3 17.0–44.8 2.4–17.3 8.0–18.0 17.3–46.0 12.1–21.5 [8,31,33,48,55,59–61] Butterserum 11.5 46.7–48.4 26.7–31.4 9.0–11.2 6.9–10.1 24.9–27.2 23.8–28.9 [8,48,50,59,61,62] Cheese whe y 0.3–1.8 5.3–23.7 27.4–41.1 2.8–3.7 3.9–9.3 19.0–32.2 9.9–16.4 [33,48,60,63] Y ogurt (skimmed) 0.2 5.5 31.1 6.3 7.9 19.9 24.9 [48] Ricotta cheese 1.16 2.7 45.4 4.4 5.8 15.8 14.2 [48] Mozzarella cheese 0.28 0.5 42.5 5.7 5.6 19.4 14.6 Cheddar cheese 0.25 0.5 38.0 7.7 8.5 20.3 16.3 Sour ce: Adapted from Anto L, W arykas SW , T
orres-Gonzalez M, Blesso CN. Milk polar lipids: Underappreciated lipids with emer
ging health benefits.
Nutrients
. 2020;12(4).
DM, dry matter; PC, phosphatidylcholine; PE, phosphatidylethanolamine; PI, phosphatidylinositol; PL, phospholipid; PS,
FIG UR E 9 .3 M ul ti pl e b io ac tiv it ie s o f M PL . L eg en d: b io ac tiv it ie s i n g re en r ef er t o a d em on st ra ti on o f t hi s a ct iv it y i n h um an s, g ra y t o on go in g t ri al s a nd b la ck t o a n ac tiv it y d em on st ra te d in v it ro o r in vi vo in a ni m al m od el s bu t f or w hi ch h um an r es ul ts h av e n ot y et b ee n p ro duc ed . R ef s. [73 –8 0].
MPL bioactivities have been presented in detail in several reviews [22,81,82] or book sections [1] and are far beyond the subject of the present chapter.
A specific target has been the development of biomimetic infant formulas including instead of nondairy emulsifier MPL fraction. It has led to some publications detailing the interest of MPL for this application [16,17,83–86]. This topic has also fostered research to determine, on one hand, precisely the composition of bovine MPL and, on the other hand, the MPL content of human milk. Recently, for instance, Claumarchirant et al. [18] compared PL composition and evolution in human milk over lactation (up to 6 months) versus in human milk possibly supplemented with MFGM. Only infant formulas supplemented with MFGM could supply the total PL content delivered by human milk over the lactation period but were less rich in SM: total PL in supplemented infant formulas was 55–59 mg/100 mL compared to 48 mg/100 mL in transitional milk and 29 mg/mL in mature 6-month human milk.
To properly assess the properties of MPL, these compounds must be isolated from milk prod-uct and analyzed. For this, several steps in MPL analyses are needed and will be the subject of the present chapter: fat extraction from milk and dairy products, isolation of PL fraction from the other lipid classes, and eventually separation of the different phospholipid classes prior to physi-cochemical analyses. Due to their amphiphilic structure, PL are also interesting emulsifiers or foaming agents, and these properties must be assessed by laboratory tests, which will be detailed in Section 9.4.
9.2 EXTRACTION, FRACTIONATION, AND SPECIAL ATTENTION
TO BE PAID PRIOR TO DAIRY POLAR LIPIDS ANALYSIS 9.2.1 sPeCial attentionto be PaiD
As many other lipids, MPL can be subjected to two main types of degradation: oxidation and enzy-matic hydrolysis. In terms of oxidation, although MPL are always slightly more unsaturated than their TG counterpart, they are also rich in very long saturated acyl chains which make them not very sensitive to oxidation in cow’s milk. Zhu et al. [63] evidenced this fair stability by measuring the
rate and extent of hexanal production over 35 days storage at 45°C. Thereby, bovine MPL
concen-trate does not require specific attention, but classical care including nitrogen streaming prior to fat storage has to be generalized. Enzymatic hydrolysis, on the other hand, is a concern. Indeed, milk’s natural flora contains several bacteria having phospholipase activities [87,88]. These enzymes can degrade glycerophospholipids, and their action can occur at freezing/thawing stages of product
stor-age. Special attention must be given if the MPL product has to be stored frozen at –20°C for several
months and then thawed; thawing conditions will then have to be optimized so that lipolysis does not occur during and post thawing. Lyophilization is a good way of preserving MPL in a concen-trated form and limit degradation which has been used by several authors [61,62,89]. Taking a sup-posed constant sample as an external standard throughout the project and checking MPL stability of components is a good idea to get rid of the enzymatic hydrolysis bias.
9.2.2 extraCtionanD fraCtionation ProCeDures
Extraction of MPL cannot be done in one step as it can be done for neutral lipids using nonpolar solvents. This extraction is quite challenging as PL in milk strongly interacts with membrane pro-teins and in other dairy products rich in dairy propro-teins can interact with the latter and stabilize transient emulsion, which needs to be broken during extraction [49]. MPL are generally extracted using neutral lipids under the form of total fat using liquid–liquid extraction methods. For such extraction, several blends of polar and nonpolar solvents have been proposed, but the most fre-quently used extraction methods are the Folch method [90] and the Bligh and Dyer method [91,92]. Then, the MPL can be concentrated using acetone precipitation.
The principle of the Folch method is to solubilize all lipids using initially a blend of monopha-sic chloroform/methanol (2:1 v/v) or the so-called Folch solvent. This monophamonopha-sic solvent is then broken by the addition of a saline solution (NaCl 0.58% w/v most of the time) to reach the final concentration of 8:4:3 v/v/v chloroform/methanol/water in the sample and the lower chloroformic phase is collected. As a rule of a thumb, the fat/solvent ratio must be superior to 1:20 v/v to achieve an efficient extraction. Avalli et al. [57] undertook Folch extraction (four replicates) followed by high-pressure liquid chromatography (HPLC) quantification of PL on milk and reported a repeat-ability (under the form of relative standard deviation RSD %) ranging between 1.1 and 8.1, in line with literature data.
A quite straightforward Folch procedure is indicated by Rodríguez-Alcalá [28] on buttermilk powder for instance and does not use saline solution: 4 g of powder is first rehydrated with 10 mL distilled water. Then, 75 mL of Folch solvent chloroform/methanol (2:1) is added. The blend is
vor-texed for 2 min, further kept agitating for 1 h at 4°C and then centrifugated (for 5 min at 5,000 rpm).
The lower chloroformic phase is collected, and the process of extraction is repeated by adding 50 mL of chloroform to the upper (methanol/water) phase. The chloroform phases are then pooled
and evaporated using a rotary vacuum evaporator (water bath set at 45°C). Separated lipids are then
transferred to amber vials, stabilized by a stream of N2, and frozen at –20°C until analysis. These
authors applied the same procedure on 3 mL of whole untreated milks. To ensure good repeatability of the procedure, extractions are performed six times.
A variant procedure has been proposed on bovine cream sample by Lopez [34], which is closer to the original Folch method as it includes the addition of saline solution: 2 f of cream is blended with 50 mL Folch solvent chloroform/methanol (2:1 v/v) using an ultraturrax (IKA, Fisher Bioblock). The extract is shaken, let equilibrated, and then 12 mL of a saline solution (NaCl 0.73%, w/v) is added. The chloroformic phase is collected. The upper phase is then washed three more times with 40 mL of chloroform/methanol (2:1, v/v) and shake with 10 mL of NaCl 0.58% (w/w). The corresponding
chloroformic phases are collected and filtered (Whatman filter paper, 2.5 µm) through a pinch of
anhydrous sodium sulfate and evaporated under vacuum. These authors mention that the extraction
of total lipids was performed either in duplicate or triplicate to obtain a coefficient of variation <5%.
The Bligh and Dyer method has been developed to save solvent (chloroform/methanol) and work on hydrated sample directly. It includes extracting total lipids by adding still chloroform/methanol (2:1 v/v) but to reach a final extracting concentration of 2:2:1.8 v/v/v methanol/chloroform/water [91].
The Bligh and Dyer method has been used a lot on milk sample; for instance, recently on micro samples of human milk by Lindahl et al. (2019): milk samples are thawed on ice, vortex 40 s.
Then, 70 µL of sample is blended with 1 mL of ice-cold chloroform/methanol/water (1:2:0.8 v/v/v),
vortexed for 20 s, and centrifugated (20,000 g, 10 min, 4°C). The lower chloroformic phase is
trans-ferred into a new centrifuge tube, evaporated at 30°C, added with 1 mL ice-cold ethanol, incubated
at –20° for 30 min to precipitate residual proteins, and recentrifugated. The supernatant is then
transferred to a new centrifuge tube and stored at –80°C until further analysis. Bligh and Dyer
method is less adapted to samples concentrated in proteins such as BM and BS or whey [49]. Classical normalized methods of milk fat extraction in dairy products using a mixture of solvent mixtures (diethyl ether, petroleum ether, ethanol, hexane) but also acid-base to disrupt protein-fat bonds (ammonia in Rose–Gottlieb and Mojonnier methods; ISO 1211; hydrochloric acid in SBR method, ISO 5543 and Weibull-Berntrop method, ISO 8261) cannot be employed to extract MPL as they can induce PL hydrolysis or show selectivity in MPL extraction. Among them, however, the Rose–Gottlieb method has been employed by few authors to extract MPL [55,57].
Avalli et al. [57] compared Folch and Rose–Gottlieb (RG) procedures on bovine milk and evi-denced that negative glycerophospholipids (PI and PS) and a fraction of SM were lost using the RG method (Figure 9.4). They set the hypothesis that the ammonia used in the RG procedure to dissoci-ate MFGM induce the wdissoci-ater solubilization of the acidic PI and PS.
Barry et al. [50] also opposed RG and two modalities of Folch method (one with CaCl2 addition
without CaCl2 ensured recovering 1.8 and 2.5 more PL than the RG and the Folch method with
CaCl2, respectively.
More recent articles tend to limit the use of chloroform and substitute it with less toxic sol-vents such as dichloromethane. The quest for faster methods than classical liquid–liquid extraction is also ongoing. A study [31] proposed and optimized a pressurized liquid extraction method to extract milk fat from raw whole milks (cows, ewes, and goats). The method was almost as efficient as Folch method and faster. Supercritical fluid extraction was also efficiently applied to eliminate
neutral lipids [93–95]. Another study [94] combining ultrafiltration (10×)/diafiltration (5×) and CO2
FIGURE 9.4 HPLC/ELSD profiles of milk fat extracted by either the Rose–Gottlieb (RG) method or the Folch method indicating loss of PI and PS using the RG method. (Reproduced with authorization from Avalli A, Contarini G. Determination of phospholipids in dairy products by SPE/HPLC/ELSD. Journal of
supercritical fluid extraction (350 bar, 50°C) obtained a final powder containing 21% lipids, of which 61% were phospholipids.
After total lipid isolation, concentration methods must be applied to purify MPL components and remove other lipids. This approach generally relies on playing on the differential solubil-ity of the different types of lipid in organic solvents. Most MPL components (glycero, sphingo, and some glycolipids) are insoluble in acetone and can be concentrated using the acetone pre-cipitation method [96]. Neutral or nonpolar lipids will conversely get eliminated in the acetone soluble fraction. It could be of interest to use this acetone extract to analyze acylglycerol esters, sterols, sterol esters, carotenoids, and lipid-soluble vitamins. Regarding glycolipids, a partition occurs: monoglycosyl diacylglycerols and sterol glycosides generally appear in the acetone solu-ble fraction, whereas di or polyglycosyl diacylglycerols, cerebrosides, and sulfatides appear in the acetone-insoluble fraction.
Examples of application of such a method is given in [97] who obtained an extract purified at 70% in MPL. For instance, on buttermilk powder containing initially around 12% MPL, a Folch extraction is first undertaken. The Folch total fat extract is then solubilized in 20 times its volume of cold acetone in a closed glass bottle. The mixture is kept under agitation (250 rpm) in a cold room for 12 h. The agitation is stopped, pellets are precipitated under gravity, and all the supernatant (containing neutral lipid) is discarded. The pellets are redispersed in a new similar volume of cold acetone and the procedure is repeated twice. Finally, the acetone and pellets are transferred in a
centrifuge tube and centrifugated (5,000 g, 10 min 4°C). The pellets are redispersed in chloroform/
methanol 2:1, transferred into a weighting flask, and evaporated using a rotary vacuum evaporator
(water bath set at 45°C). Then, purified dry MPL are stored flushed with nitrogen and stored frozen
at –20°C. The application of this procedure resulted in a purified MPL fraction composed of 31.4%
TG, 69.4% PL; relative polar lipids composition (% mol/mol) was as follows PC = 37.0, SM = 33.3,
PE = 21.0, PI = 6.1, PS = 4.1; sterols still represented 7.6 ± 3.4 mg/g total fat.
Very detailed procedure is also described in reference [96]: for a total of 100 mg total lipid, 5 mL of cold acetone plus 0.1 ml of 10% MgCl in methanol is mixed and stored on ice for 1 h. The blend is then centrifugated at 2,500 rpm for 3–5 min, and acetone supernatant is removed using a Pasteur pipet. The precipitate is then washed twice with 1 ml of cold acetone, cooled on ice for 1 h, and centrifugated as above. Excess solvent is eliminated in a stream of nitrogen, and dried in vacuo in a desiccator over KOH.
It is also indicated that acetone-insoluble fraction contains ~95% or more of phospholipids and
only traces of neutral lipid compounds.
Other fractionation procedures to separate MPL constituents from nonpolar lipids are conducted by preparative chromatography methods. In all cases, these methods rely on the principle of a difference of affinity between a solid phase (most of the time silica that can be further chemi-cally grafted) and an eluant phase or mobile phase. Phospholipids are held by the solid phase by hydrogen and ionic bonds and released by eluting the column with solvents of increasing polarity. To fractionate MPL, either column separation, thin-layer chromatography (TLC), solid-phase extraction (SPE) systems, or preparative liquid chromatography (LC) can be used. Column chroma-tography separation with home-made silica or alumina packed glass column is probably the oldest method [98] that has been applied for MPL fractionation and is still an interesting method when a large amount (mg to g) of MPL must be prepared. However, it has the drawback of low resolution. TLC was developed to get faster results and use less sample compared to column chromatography. It has better resolution than column chromatography and can be applied in preparative mode to purify
10–100 µg MPL. SPE was probably the most widely used prefractionation method being a good
intermediate in terms of resolution and amount of purified lipid.
In column chromatography, silica gel G 230–400 mesh size can be used and the degree of hydration of the silica must be constant to obtain repeatable separation. Height-to-diameter ratio will affect the separation and must be around 20. The load in lipid is of approximately 30 mg lipids/g of dry silica gel. Typical procedure can be found in reference [99].
SPE is based on the same principle than column chromatography but is conducted on prepacked columns in series (12 columns on a support in average) and under partial vacuum to speed eluant recovery and separation. Therefore, it is much more practical than glass column chromatography but also quite expensive due to the cost of a prepacked column per extraction. Three SPE procedures have been proposed to purify MPL and remove nonpolar components. These methods have been compared by Gallier et al. [55] on Mojonnier extracts obtained from buttermilk powder. The three procedures were the Bitman method [100], the Avalli method [57], and the Vaghela method [101] with minor modifications. The Avalli method [57] displayed in Figure 9.5 has been the most used in the literature.
Gallier et al. [55] used silica gel-based SPE cartridges (bed weight 2 g, volume 12 mL Supelco
Discovery® DSC, i.e., twice the volume of cartridge used by Avalli et al. [57]) and loaded them with
200 mg fat. Briefly, the Bitman method involved conditioning the SPE silica gel cartridge with chlo-roform and a first elution of the neutral lipids with 40 mL of hexane/ethyl ether (1:1 v/v), and, then, the elution of the phospholipids with 20 mL of methanol followed by 20 mL of chloroform/methanol/ water (3:5:2 v/v/v). The Avalli method utilized hexane to condition the cartridge, 6 mL of hexane/ diethyl ether (8:2 v/v) and 6 mL of hexane/diethyl ether (1:1 v/v) to elute the neutral lipids, and, then, 8 mL of methanol and 4 mL of methanol plus 4 mL of chloroform/methanol/water (3:5:2 v/v/v). In the Vaghela method [101], the method was adapted: as the initially proposed aminopropyl cartridge could lead to the loss of acidic phospholipids, they were substituted by silica cartridge. Cartridge was again conditioned with hexane. The neutral lipids were eluted with 18 mL of chloroform/isopropyl alcohol (2:1 v/v), then FAs with 18 mL of 2% (v/v) acetic acid in diethyl ether, and finally, the phospholipids with 18 mL of methanol. After each SPE, the solvents were evaporated and the phospholipid extracts were dissolved in chloroform to a concentration of 10 mg/mL, and stored in amber glass vials at −20°C until further analysis. Purity of the SPE extract was checked by analytical TLC. Globally, the Bitman method gave higher yield in PC and SM but lower yields in PE, PI, and PS compared to the Avalli and Vaghela methods. However, the application of this SPE screening on Mojonnier extract was very questionable as it induced degradation by oxidation and hydrolysis of a big amount of MPL.
These authors selected the Folch extraction/Bitman SPE procedure to efficiently isolate MPL from dairy product without losing SM. Several other authors, however, combined Folch extraction and Avalli SPE method and reported SM content in their extract in line with the literature [27,34].
TLC fractionation is also an effective way of separating PL from neutral lipids. Several blends of solvents used as mobile phase have been described and can be interchanged unless prefractioning is also used to get an indication of neutral lipid composition. To this aim, classical mobile phase would be composed on hexane/diethylether/acetic acid (70:30:1 v/v/v). Hexane can also be substituted by another nonpolar solvent such as petroleum ether. Such substitution and an higher amount of nonpo-lar solvent (petroleum ether/ethyl ether/acetic acid (85:15:2 v/v/v) was used on total milk fat extracts by some groups [29,93] to remove neutral lipids or to analyze neutral lipid in a MPL extract, the so-called dairy lecithin [63]. In all these cases, PL stays at origin and can get scrapped off and then desorbed from silica using chloroform/methanol (2:1 v/v).
9.3 CHEMICAL ANALYSES OF DAIRY POLAR LIPIDS 9.3.1 assessinG Global Content in Polar liPiDs
The global methods of quantification of MPL are not that numerous. Folch extraction followed by gravimetric determination is possible but quite exigent as specific care must be taken to avoid any loss of material during extraction, by limiting as much as possible, the transfer of extracts. In addition, the Folch extract must be perfectly evaporated to avoid imprecise weighting and over-estimation of fat content. The addition of a few microliters of acetone to form an azeotrope with chloroform followed by storage over a desiccant at 4°C can help in the process. A fraction of the Folch extract can be diluted in chloroform/methanol, and then the PL content is quantified by HPLC using an external calibration curve for each sample. Such a procedure was used in several publica-tions [8,61,62]. Such methods, however, lack internal standards. Phosphatidylglycerol was proposed as an internal standard by Giuffrida et al. [102].
Phosphorus content in the sample can also be determined to get an insight into its phospholipids content. Phosphorus is transformed into inorganic form typically by ashing the extract at 550°C or
by acid hydrolysis using HClO4 [29,103], the phosphorus content is then estimated photometrically
using the molybdate method [104]. The total PL content is calculated by multiplying the phospho-rus content by a factor of 25.44 [105]. The application of such method requires corrections with extraction on blanks (containing possibly traces of inorganic phosphate coming from milk micellar fraction) to take into account milk inorganic phosphate.
The protein content in MPL enriched extracts is typically determined using the Kjeldahl nitrogen determination method [104] and a protein conversion factor of 6.38.
Determination of total sialic acids (Figure 9.1) can also be conducted after acid hydrolysis (0.05 M
H2SO4, 80°C 1 h) followed by purification by ion-exchange chromatography and quantification by
resorcinol colorimetric method, as described by Martin et al. [89]. 9.3.2 fatty aCiD analysis of the Different PhosPholiPiD sPeCies
MPL generally contain more polyunsaturated fatty acids (PUFA) as well as longer-chain fatty acids (FA) (specifically C22:0 to C23:0) than their neutral lipids counterpart. Moreover, the individual FA profile of each class of milk PL is specific (Table 9.7): SM is characterized by high amounts of long-chain FA (C22:0 to C24:0), PC is dominated by C16 and C18:1 cis 9, PE by C18:1 whereas C18:0 and C18:1 cis 9 are major FA in PI and PS [6,106]. Sánchez-Juanes et al. [107] compared the total FA profiles of PL from MFGM and whole milk. Despite similar PL species, the PL FA profile differed. MFGM PL showed a lower C18:0 content in parallel whole milk PL had higher contents in C18:1, C18:2, and very long-chain FA (more than C20). Most variations were due to difference in FA esterified in PE, PI, and PS but not in SM nor PC.
The PL FA profiles are also plastic and influenced by external factors, although to a less extent than TG fraction. Thus, the manipulation of cow’s diet to enrich milk fat in PUFA modifies the FA profile of milk PL [35–37,40]. Lopez et al. [108] demonstrated that the supplementation of maize silage diet with extruded linseed decreased significantly saturated FA in MFGM while increas-ing unsaturated FA. This supplementation increased significantly monounsaturated FA includincreas-ing vaccenic acid (C18:1 trans-11) and polyunsaturated acids. [1]
FA analysis of MPL is generally done after MPL FA derivatization into methyl esters and sub-sequent injection in gas chromatography. Several methanolysis methods for phospholipids can be employed but should result in a complete conversion of phospholipid-bound FAs into FA methyl esters. Taking into consideration the results of Eder et al. [109] is important. Indeed, these authors compared several methanolysis procedures: boron trifluoride-methanol, methanolic sodium methoxide (at ambient temperature and with heating), methanolic sulfuric acid, saponification with methanolic sodium hydroxide, and subsequent esterification with boron trifluoride-methanol. Only the sodium methoxide-catalyzed method at ambient temperature gave complete methanolysis of phosphoacylglycerols. Moreover, SM is extremely resistant to alkali treatment because FAs exist as amides rather than as esters. Therefore, methanolic inorganic acids such as hydrochloric and sulfuric acid as well as boron trifluoride-methanol have been frequently used for the methanolysis of SM. Using methanolic sulfuric acid and boron trifluoride-methanol, complete methanolysis was
achieved only after heating at 90°C for 15 h.
To derivatize MPL FAs, most articles employ boron trifluoride methanolysis or a two steps pro-cedure with first saponification with methanolic sodium hydroxide and subsequent esterification with boron trifluoride-methanol. Internal uneven chain length standard can be added (typically hep-tadecanoylphosphatidylcholine or glyceryl triheptadecanoate) before methanolysis for more
accu-rate quantification. Methods generally suppose transmethanolysis of 15–20 µL of phospholipids
in a small volume of organic solvent (petroleum ether, dichloromethane) with 1 mL BF3-methanol
reagent (14% BF3 in methanol) for 45–90 min at 90°C–100°C. A practical one step procedure was
detailed by Benoit et al. [110] on human milk, however, it did not contain a long step of
meth-anolysis of SM: 100 μL of milk was added with 500 μg of glyceryl triheptadecanoate (internal
standard) and 1 mL of toluene:methanol (2:1 v/v) in a screw-capped tube and vortexed. 1 ml of BF3
-methanol (14%) was then added and the tube was maintained at 100°C for 90 min. After cooling on
ice, reaction was stopped with 1 mL of K2CO3 (10%). Two milliliters of isooctane were added and
after centrifuging for 10 min at 1,500 rpm, the upper phase was collected. The methyl ester extract
was diluted (∼1/6) with isooctane prior to injection into the Hewlett Packard gas chromatograph
(HP6890, Agilent Technologies). The gas chromatograph was equipped with a flame ionization detector, a programmed temperature injector, and a fused silica capillary column coated with
stabi-lized poly-90% bis-cyanopropyl/10% cyanopropylphenyl siloxane (60 m × 0.25 mm; film thickness
0.25 μm, Supelco 24111-SP 2380, Supelco Inc., Bellefonte, USA). The initial temperature of the
1 μL-splitless injection was 230°C. The oven temperature was 57°C for 2 min, increased from 57°C
to 130°C at 20°C min−1 and retained for 5 min, then increased to 210°C at 1.5°C min−1, and finally
to 250°C at 10°C min−1. The detector temperature was 270°C, under hydrogen flux (30 ml min−1);
the carrier gas was helium (160 kPa).
Transesterification on silica after preparative TLC was proposed by Astaire et al. [93]: after preparative TLC, each individual lipid class was scraped from the plate and transesterified in 3 N
methanolic-HCl in a sealed vial under a nitrogen atmosphere at 100°C for 45 min. The resulting FA
methyl esters were extracted from the mixture with hexane containing 0.05% butylated hydroxy-toluene as antioxidant and prepared for gas chromatography by sealing the hexane extracts under nitrogen. Sánchez-Juanes [107] proposed the classical transmethanolysis of glycerophospholipids
scrapped off spot: silica containing max 10–15 μg of phospholipids was put in 1 mL of petroleum
ether and was transmethylated using 750 μL of BF3-methanol reagent (14% BF3 in methanol) for
45 min at 100°C. Whereas SM spot was desorbed from silica, evaporated to dryness under a
for 20 h at 80°C. The FAME were then extracted twice with 1.5 mL of hexane, and the mixture was evaporated to dryness under a nitrogen stream.
Following methanolysis, authors analyzed FAME from PLs either on classical GC-FID or on GC-MS. Sánchez-Juanes [107], for instance, analyzed PL FAMES on Shimadzu GC 17A coupled to a Shimadzu MS QP 5,000 mass spectrometer. Analysis was performed in the electron-impact
mode (ionization energy 70 eV; source temperature 150°C). The carrier gas was helium. A
calibra-tion curve was obtained with a standard FAME mixture, Supelco 37, to correct the differences in the detector response.
9.3.3 DeterMination of Dairy PhosPholiPiD anD sPhinGoliPiD Main Classes anD their QuantifiCation
Phospholipids are divided into different classes, according to the nature of their polar head group and such composition can be determined by two main types of chromatographic methods either by TLC or by HPLC.
9.3.3.1 Thin-Layer Chromatography (TLC)
This method is quite old but highly sensitive, inexpensive, and versatile, and can be used in ana-lytic mode or preparative modes. High-resolution plates have improved the possibility of studying several sample (up to 36 roughly) on a plate and made it more robust for routine analysis but it is still quite time consuming. In addition, co-elution of MPL having close polarity (PC and SM) or PI and PS is frequent. Resolution can be improved by double development and the use of elution in bidimensional mode [111] (Figure 9.6a and b). Bidimensional mode has however the drawback of being run on one sample at a time only. Lipid class standard compounds are generally spotted on the two outside lanes of the TLC plate to enable localization of the sample lipid classes. Revelation is also versatile as it can be done using universal (primuline, iodine vapors) or specific dyes that help determine the nature of the compound (specific spray of Dittmer and Lester, ninhydrin reagent 0.2% in ethanol for amino-group-containing compounds). Revelation can also be destructive (including a charring step for instance) or reversible (short iodine vapor exposition), or at least compatible with subsequent analyses (primuline spraying). The number of TLC procedures applied to quantify MPL classes are not that numerous and have been grouped in Table 9.4 below.
Efficient separation of MPL having close physicochemical properties (such as PS and PI or SM and PC in a less extend) in monodimensional mode is, however, difficult. In addition, the repeat-ability of elution with “polar mobile phase” is dependent on elution chamber saturation, humid-ity, and temperature. Examples of bi or monodimensional TLC analysis of MPL is displayed in Figure 9.6.
9.3.3.2 High-Pressure Liquid Chromatography (HPLC)
HPLC methods have been the most employed chromatographic methods to analyze MPL classes. The initial and the most used methods have been developed on polar silica columns and have evolved toward hydrophilic interaction liquid chromatography (HILIC) columns recently (see Table 9.5). These last columns used with organic solvent phases are more compatible with subsequent mass spectrometry (MS) detection. Evaporative light-scattering detectors (ELSD), although they have the drawback of being destructive, have been used much more than other type of detectors (UV, refractive index, charged aerosol detector (CAD)). Indeed, ELSD detectors have the advantages of being sensitive, compatible with most solvent, and gradients, influenced by the mass of the analyte but quite universal. They offer a non-linear response to the analyte concentration that can be fitted
by a power law. External calibration curves have thus been constructed by injecting 10 µL of serial
dilutions 2–50 µg/mL of each standard of MPL. More recent methods have proposed the use of
CAD detectors. LC coupled to MS with targeted MPL lipidomics has developed significantly over the last recent years.
Early HPLC separations have been proposed using chloroform/methanol/ammonium hydroxide mobile phase and binary to ternary gradients. Kiełbowicz et al. [53] proposed a very good over-view of the development of these ammonium hydroxide mobile phases and of their limit, which is the degradation of silica phase by alkaline pH. Morin et al. [94] applied such alkaline linear
binary phase to MPL using a Zorbax Sil 5 μm column (4.6 i.d. × 150 mm, Agilent Technology).
Mobile phases used were (A) chloroform/methanol/ammonium hydroxide (80:19.5:0.5 v/v/v/v) and TABLE 9.4
TLC Analytical Methods Reported in the Literature for the Analysis of MPL Classes
Plate and Other
Characteristics Eluant Mobile Phase(s) Revelation Refs. Thick layer silica coated plate
(0.4 mm) – two-dimensional analysis, 200–800 µg samples deposited on plate
First dimension: chloroform/ methanol/water/28% aqueous ammonia 130:70:8:0.5 v/v/v/v; second dimension chloroform/ acetone/methanol/acetic acid/water 100:40:40:20:20:10 v/v/v/v/v
Universal revelators (iodine for unsaturated lipids, chromosulfuric acid for organic compounds), specific ones (specific spray of Dittmer and Lester, nihydrin reagent 0.2% in ethanol for amino-group-containing compounds)
[111]
HPLTC silica coated plates, two-dimensional TLC developed by Rouser 1970 on human brain and beef kidney membrane lipids, 8–10 µg phospholipids deposited, identification by co-migration with standards
First dimension: chloroform/ methanol/28% aqueous ammonia/ water, 60:36:3.7:3.7 v/v/v/v; second dimension: chloroform/methanol/ acetic acid/water, 45:20:6:1 v/v/v/v/v
Spraying with Phospray (for PLs), anisaldehyde (for glycolipids, glycerophospholipids and sphingomyelin), and orcinol (for glycolipids).
Quantification by scrapping off spot and determining its phosphorous content after hydrolysis
[103,107,29]
To solve PS/PI co-elution in previous two-dimensional separation, one-dimensional TLC is run chloroform/methanol/ acetic acid-water, 50: 37.5: 3.5: 2, v/v/v/v [29]
Silica plates 60 (Merck)/ samples: Folch total lipids from human milk
Preparative TLC: separation of PL at baseline from neutral lipids migration using (hexane/ether/acetic acid 80:20:1 v/v/v/v). MPL scrapped off and separation of PL species using chloroform/methanol/ methylamine 65:24:3 v/v/v (2 h migration)
primuline spraying and UV observation, spots scraped off and MPL desorbed using 3 mL chloroform/methanol/water 5:5:1 v/v/v, followed by centrifugation at 2000 rpm for 5 min
[110]
Silica plates chloroform/methanol/water 65:25:4, v/v/v was carried out to qualitatively identify the phospholipids present in each extract and check the presence of any residual traces of neutral lipids. Samples (20 μL) were spotted on the plates with a Hamilton gastight syringe (Fisher Scientific)
Iodine vapor applied overnight for the revelation of spots
[55,58,93]
Separation of human milk MPL into 6 subclasses (LPC, PE, PI, PS, PC and SM), two-dimensional separation
First dimension: chloroform/ methanol/7 N ammoniumhydroxide 65:30:4 v/v/v, second dimension: chloroform/methanol/acetic acid/ water 170:25:25:6 v/v/v/v
Spraying with Dittmer reagent for phospholipids visualization followed by exposure to iodine vapor
(B) chloroform/methanol/water/ammonium hydroxide (60:34:5.5:0.5 v/v/v/v). With the following gradient 100% Solvent A at time 0 decreasing to 0% linearly at time 14 min and staying constant until 28 min, from 28 to 32 min solvent A increasing linearly from 0% to 100% and staying con-stant until 41 min (end of run). Typical profiles of separation on fresh BM is displayed in Figure 9.7. Rombaut et al. [60] then proposed to replace ammonia hydroxide by was an acidic buffer which allowed long silica column shelf-life (more than 1,500 runs), better resolution in the separation of FIGURE 9.6 Typical MPL TLC separations reported in literature. Original figure drawn taking in consider-ation MPL retention factors. Legend: (a) Parsons and Patton (1967): Two-dimensional TLC of bovine polar lip-ids. The TLC were developed (1) from right to left with CHCl3/MeOH/H2O/28% aqueous ammonia (130:70:8:0.5
v/v/v/v) and (2) in the vertical direction CHCl3/Acetone/MeOH/AA/H2O (100:40:20:20:10 v/v/v/v/v). O: origin;
S: carbohydrate (lactose) and protein; SM: sphingomyelin; PC: phosphatidylcholine; PS: phosphatidylserine; PI: phosphatidyl inositol; PE: phosphatidylethanolamine; CDH: cerebroside dihexoside; CMH: cerebroside mono-hexoside; FA: free fatty acids; NL: neutral lipid; and unknown substances listed as X1 and X2; (b) Rouser et al, (1970): Two-dimensional TLC of normal human whole brain lipids. The TLC were developed (1) in the vertical direction with CHCl3/MeOH/NH3 (65:25:5 v/v/v) and (2) from right to left with CHCl3/Acetone/MeOH/AA/H2O
(3:4:1:1:0.5 v/v/v/v), LPL: less polar lipid (cholesterol, triacylglycerol, etc.); CN and CH: cerebroside with normal and hydroxy fatty acids, SN and SH: sulfatide with normal and hydroxy fatty acids; PA: phosphatidic acid, LPE: lysophosphatidyl ethanolamine, DPG: diphosphatidyl glycerol; For (c), (d), (e) and (f), the TLC were developed with CHCl3/MeOH/H2O 65:25:4 v/v/v; (c) Astaire et al, (2013): Part of TLC of polar lipids profiles from three
SFE. 1: buttermilk; 2: microfiltration-enriched powder after supercritical fluid extraction. Sh: sphingosine; (d) Gallier et al. (2010): TLC of the phospholipids of buttermilk powder; (e) Gallier et al. (2010): TLC of the phos-pholipids of raw milk (RM), raw cream (RC), buttermilk powder (BP), buttermilk powder, and processed milk (PM); (f) Bourlieu (results not published): TLC of the phospholipids of buttermilk. Revelation/visualization: primuline at 365 nm; BM: Buttermilk fat; PLA2 4 h: hydrolyzed BM with phospholipase A2 for 4 h.
TABLE 9.5
Overview of HPLC Methods Proposed in the Literature to Determine MPL Classes
Sample Phospholipid Identified Extraction Method Determination
Method Column/Details Ref. Bovine buttermilk PE, PI, PC, SM Mojonnier extraction method HPLC-ELSD Zorbax
Sil 5 μm (4.6 i.d × 150 mm, Agilent
[94] Bovine milk and buttermilk, goat milk, ewe milk GluCcer, LaCcer, PE, PI, PS, PC, SM
Folch method HPLC-ELSD 250 mm × 4.5 mm, 5-μm particle Zorvax Rx-SIL column, complex quaternary mobile phase described in the chapter
[28] Bovine buttermilk PI, PS, PE, PC, SM Mojonnier ether extraction method TLC and HPLC-ELSD based on [94]
Similar to Morin et al.[94] [58]
Human milk PI, PS, PE, PC, SM
Folch method HPLC-ELSD Based on [60]
Cf [116] [116]
Bovine milk PI, PS, PE, PC, SM
Folch method HPLC-ELSD Micro-Pak Si-5 column elution with the acid system described by [117] [38] Bovine buttermilk powder GluCer, LacCer, PI, PE, PS, PC, SM
Folch method HPLC-ELSD Method based on [60] but using dichloromethane instead of chloroform
[49] Human colostrum, human milk PI, PS, PE, PC, SM
Folch method HPLC-ELSD Method based on [60] with minor modifications, silica column (4.6 mm × 250 mm, 5 μm particle size), ternary gradient of choloroform/ methanol/triethylamine buffer (pH 3, 1 M formic acid)
[19]
Human milk PI, PS, PE, PC, SM
Folch method HPLC-ELSD normal-phase using 2
Nucleosil 50-5, 250 × 3 mm, 5 µm (Macherey– Nagel) equipped with pre-column Nucleosil 50-5, 8 × 3 mm, 5 µm. Solvent A: ammonium formate 3 g/L; solvent B of acetonitrile/ methanol (100/
3 vol/vol). Gradient conditions: time = 0 min 1% solvent A; time = 19 min 30% solvent A; time = 21 min 30% solvent A;
time = 24 min 1% solvent A; flow rate 1 mL/min.
[102]
Bovine milk PI, PS, PE, PC, SM
Folch method and SPE purification
HPLC-charged aerosol detector (CAD)
Betasil DIOL 5 µm (150 × 4.6 mm) column [53]
Bovine milk, buffalo milk, sheep milk, donkey milk, camel milk PI, PS, PE, PC, SM
Folch method HPLC-ELSD Method based on [60] with minor modifications, silica column (4.6 mm × 250 mm, 5 μm particle size), ternary gradient of choloroform/ methanol/triethylamine buffer (pH 3, 1 M formic acid) [23] Bovine colostrum PI, PS, PE, PC, SM
Folch method HPLC-ELSD Cf [57] [118] (Continued)
TABLE 9.5 (Continued)
Overview of HPLC Methods Proposed in the Literature to Determine MPL Classes
Sample Phospholipid Identified Extraction Method Determination
Method Column/Details Ref. Bovine milk PI, PS, PE,
PC, SM
Folch method HPLC-ELSD Cf [119] [38] Bovine milk PI, PS, PE,
PC, SM
Folch method HPLC-UV silica column (Zorbax RX-SIL, solvent based on [117] 4.6 × 250 mm, detection at 205 nm, collection of fractions
[37]
Bovine milk PI, PS, PE, PC, SM
Folch method HPLC-ELSD Based on [60] [120] Bovine milk, goat milk, sheep milk PA, PI, PS, PE, PC, SM Dichloromethane-methanol solution (2/1, v/v)/PLE
HPLC-ELSD 2 Zorbax Rx-SIL columns measuring 250 mm × 4.5 mm and with a 5 µm particle size used in series, mobile phase similar to [28,31]
[31] Bovine colostrum, bovine milk PI, PS, PE, PC, SM
Folch method HPLC-ELSD Based on [60] [121]
Bovine milk PI, PS, PE, PC, SM
Folch method HPLC-ELSD Cf [119] [39] Bovine milk PI, PS, PE,
PC, SM Chloroform/ methanol/ distilled water (0.8% w/v NaCl) (8:4:3 v/v/v) HPLC-ELSD Based on [28] [51]
Bovine milk PI, PS, PE, PC, SM
Folch method HPLC-ELSD based on [60]
3 µm particle diameter Prevail Silica column, 150 × 3 mm; elution
chloroform:methanol:buffer (0.5% formic acid brought to pH 6 with ammonium hydroxide) in the proportions 80:19.5:0.5 for 17 min/60:33:7 for the next 3 min, followed by return to internal conditions until 15 min
[40] Bovine milk, bovine buttermilk, bovine butter serum PI, PS, PE, PC, SM Folch and Rose–Gottlieb method HPLC-charged aerosol detector (CAD)
Based on [49]; 3 µm particle diameter Prevail Silica column, 150 × 3 mm; linear gradient of two mobile phases; A: 100% dichloromethane, B: methanol/triethylamine/acetic acid buffer, pH 3.5 (500:21, v/v)
[50]
Goat milk PI, PS, PE, PC, SM Methanol- chloroform-water (1:2:0.6, v/v/v) and chloroform/ ethanol (3%, v/v)
HPLC-UV Cf [122] and [117]; Zorbax RX-SIL, 4.6 × 250 mm; detection at 205 nm [32] Human colostrum, human milk PI, PS, PE, PC, SM Dichloromethane-methanol solution (2/1, v/v)
HPLC-ELSD 2 Zorbax Rx-SIL columns
measuring 250 mm × 4.5 mm and with a 5 µm particle size used in series, mobile phase similar to [28,31]
PS/PI, and an increase in ELSD detector response. This method was with no doubt the most used method from 2005 up to now (Table 9.6). The separation was conducted on silica column (oven set at 40°C). The elution program consisted in a linear gradient with chloroform/methanol/buffer (1 M formic acid, neutralized to pH 3 with triethylamine) 87.5:12:0.5 v/v/v from t = 0 to 28:60:12 v/v/v at t = 16 min. The mobile phase was brought back to the initial conditions, that is, 87.5:12:0.5 v/v/v, at t = 17 min and let equilibrated until the next injection at t = 21 min (total run= 21 min). The flow rate was maintained at 0.5 mL/min. The procedure permitted separating main glycerophospholipids as well as lactosyl and glycosylceramides and some lysophospholipids. Similar procedure but with slower elution gradient was adopted by several authors [8,34,61,62] to improve the resolution and to stabilize the retention times (Table 9.6).
A more complex elution program was then proposed by Rodríguez-Alcalá et al. [28], still on HPLC-ELSD system, to allow the simultaneous quantification of neutral lipids (cholesterol esters, TG, cholesterol + diacylglycerol + free FA, monoacylglycerol) and of MPL classes (GluCer, LaCer, PA, PE, PI, PS, PC, and SM) on non-prefractionated dairy fat. This elution program is detailed in Table 9.4 below. The used column was still on silica but it was longer than in the
two previous HPLC-ELSD methods: 250 mm × 4.5 mm, 5-μm particle Zorvax Rx-SIL column
(Agilent Technologies, Palo Alto, CA, USA). Limits of detection ranging between 0.3 (PI-PS) and
0.8 (SM) µg were reported.
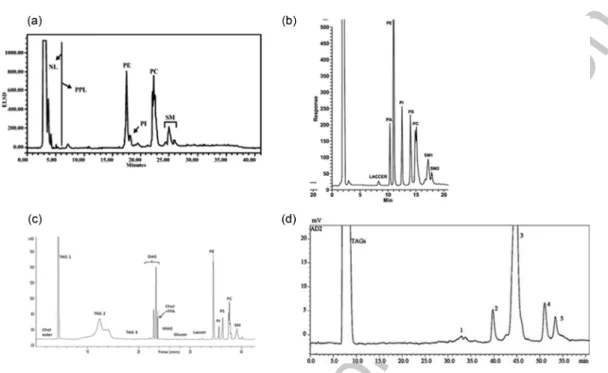
FIGURE 9.7 Typical MPL class separation obtained using main HPLC methods proposed in litera-ture. (a) Morin et al. (2004) chromatogram obtained on fresh buttermilk using HPLC-ELSD detector. (b) Rombaut et al. (2005) chromatogram obtained on whey using HPLC-ELSD detector. Abbreviations: HPLC– evaporative light-scattering detector. NL = neutral lipids, PPL = phospholipids, PE = phosphatidylethanol-amine, PI = phosphatidylinositol, PC = phosphatidylcholine, SM = sphingomyelin. (c) Rodríguez-Alcalá and Fontecha (2010) chromatogram obtained on buttermilk powder total fat sample by HPLC-ELSD using the methodology described in publication in our laboratory. Chol ester: cholesterol ester; TAG: triacylglycerides; DAG: diacylglycerides; Chol: cholesterol. FFA: free fatty acids; MAG: monoacylglycerides; Glucer: gluco-sylceramide; Laccer: lactogluco-sylceramide; PE: phosphatidylethanolamine; PI: phosphatidylinositol; PS: phos-phatidylserine; PC: phosphatidylcholine; SM: sphingomyelin. (c) Donato et al., (2011) HPLC(HILIC)-ELSD chromatogram of SPE-extracted PLs from a cow’s milk sample: 1. Phosphatidylinositol; 2. Phosphatidylserine; 3. Phosphatidylethanolamine; 4. Phosphatidylcholine; 5. Sphingomyelin.
Donato et al. [27] introduced a rupture by proposing a HPLC-ELSD method using a HILIC column. HILIC uses hydrophilic stationary phase through which a hydrophobic phase will elute compounds in order of increasing hydrophilicity (similar to reversed-phase LC mode). HILIC are interesting for coupling with MS as they avoid the use of water-rich or ion-paired mobile phases that could hinder ionization efficiency in MS [113]. The analytical column was an Ascentis Express
HILIC, 150 mm × 2.1 mm I.D. with partially porous (Fused-core) particles of 2.7 μm (Sigma–Aldrich/
Supelco). Mobile phases consisted of (A) acetonitrile and (B) acetonitrile–water (2:1, v/v). The elution gradient was binary and as follows: 0–10 min 0% B, 15 min 20% B, 35 min 45% B, 50 min 80% B,
70 min 100% B (hold for 30 min). A flow rate of 50 μL/min was used for LC-ELSD. The
correspond-ing chromatogram is displayed in Figure 9.6. Limit of detection in the range of 1.6 (PS)–4 (PI) µg/mL
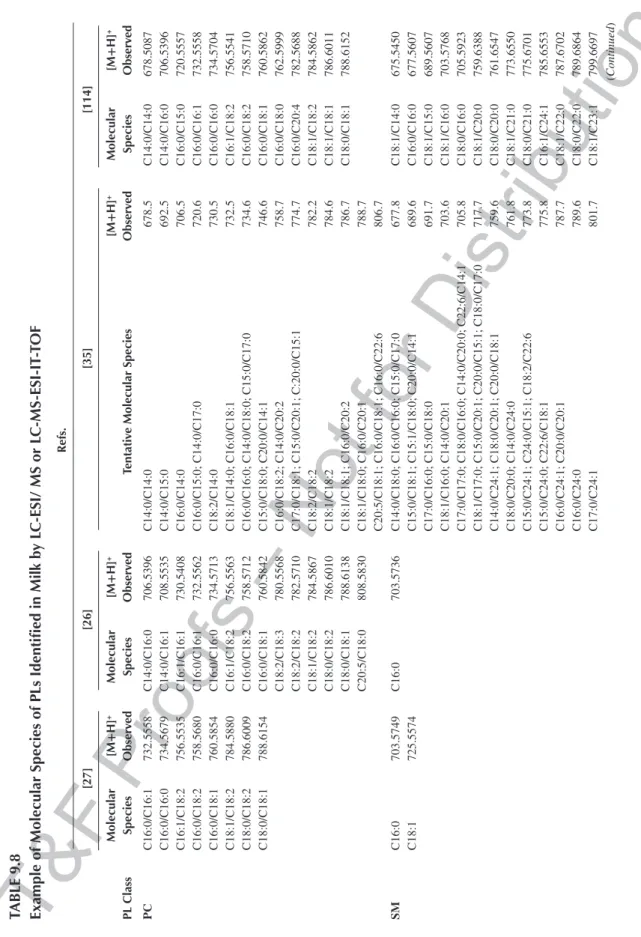
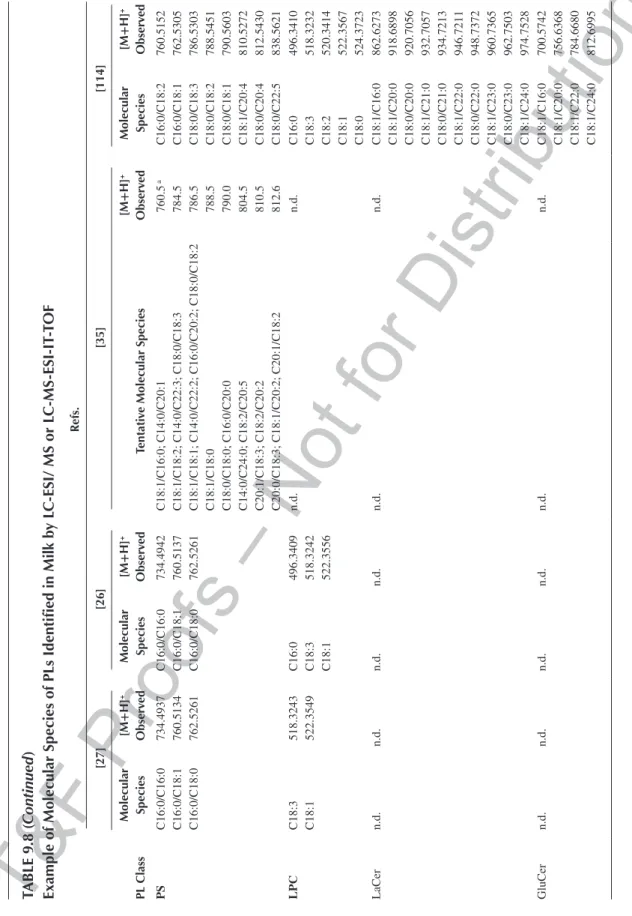
were obtained. In addition to MPL classes (PI, PS, PE, PC, and SM) quantification by ELSD, the species within each class of compound were identified from the molecular ions and fragmentation patterns generated from an ion trap-time-of-flight mass spectrometer (both in positive and negative ionization modes). Later, other authors proposed interesting LC-MS quantification of MPL using HILIC columns (Table 9.6). For instance, Liu et al. [114,115] proposed a mobile phase composed of binary gradient of 5 mM aqueous ammonium formate (A) and acetonitrile + 0.1% formic acid (B).
Kiełbowicz et al. [53] proposed the use of an alternative detector a CAD which is more sensitive, precise, and user-friendly (no optimization of parameters required) than ELSD. They developed and validated an HPLC-CAD method to quantify MPL using simple gradient elution and short run
times. Stationary phase was a Betasil DIOL 5 µm 150 × 4.6 mm column. The elution gradient used
was based on a ternary gradient of acetic acid, hexane, and isopropanol. 9.3.4 DeterMinationof Dairy PhosPholiPiDanD sPhinGoliPiD
struCtureby Mass sPeCtroMetry (Ms)
To go further than MPL classes description quantified by HPLC, the determination of MPL species within each class by MS gather certainly the most modern and cutting-edge methods of character-ization of MPL (see Table 9.7). Although they require MS equipment, they are far less laborious TABLE 9.6
Details of the Elution Program Proposed by Rodríguez-Alcalá et al. [28]
Time (Min) Percent Solvent Flow (mL/Min)
A B C D 0 0 0 100 0 1 3.5 0 0 100 0 1 19 100 0 0 0 1 21 100 0 0 0 1 41 0 100 0 0 1 42 100 0 0 0 1 42.01 100 0 0 0 1.5 47 100 0 0 0 1.5 47.01 0 0 0 100 1.5 48.99 0 0 0 100 1.5 49 0 0 100 0 1.5 54 0 0 100 0 1.5 59 0 0 100 0 1 59.01 0 0 100 0 0
With (A) Chloroform/methanol/water (1 M formic acid; TEA, pH 3). 87.5:12:0.5 (v/v/v). (B) Chloroform/methanol/ water (1 M formic acid; TEA, pH 3). 28:60:12 (v/v/v). (C) Isooctane/THF. 99:1 (v/v). (D) 2-Propanol.
than collecting MPL classes by preparative TLC or HPLC and further derivatization followed by GC-FID analysis. Quantification of subspecies by MS is quite challenging and relies on good HPLC separation, large range of detection linearity, and the use of internal standards. Isotopically labeled internal standards for each class of compounds is the best option [123].
Resolution of structure of dairy MPL is getting increasingly numerous and will continue to prosper with the democratization of LC-MS methods.
A glance to Table 9.7 indicates that a large variety of mass spectrometers with liquid (electrospray ionization, ESI) or solid ionization (matrix-assisted laser-desorption/ionization MALDI) coupled to various detectors (ion trap, time-of-flight, and tandem instruments) have been applied to MPL analysis. ESI-MS first and MALDI-TOF have been the most frequently used. In mild conditions, ESI gives rise to several charged ions from PI, PS, PE, and SM and can be easily fragmented via MS/MS experiments to provide structural information about the species (fatty acyl chains present). Information about fatty acid chain positional distribution can be inferred from the intensity ratio as the sn-2 position is preferentially fragmented.
Pioneer work was proposed by a simple infusion by Gallier et al. [55] on an SPE fraction-ated Folch extract of raw milk, raw cream, processed milk, and buttermilk. Quantification was possible owing to the use of several internal standards for each MPL class (di12:0- PC, di24:1-PC, 13:0-lysoPC, 19:0-lysoPC, di12:0-PE, di23:0-PE, 14:0-lysoPE, 18:0-lysoPE, 14:0-lysophosphatidyl-glycerol (lysoPG), 18:0-lysoPG, di14:0-phosphatidic acid (PA), di20:0(phytanoyl)-PA, di14:0-PS, di20:0 (phytanoyl)-PS, 16:0–18:0-PI, and di18:0-PI.). The ESI-MS/MS technique determined the FA profile of the MPL but did not differentiate the two FA. For SM, PE-ceramide and lysophospho-lipids the chain length of the only FA attached to the polar group was determined: in this case chain length varied between C16 and C24. For other classes, the summed chain length of the two FA was obtained in the range of 26–44.
Significant improvement of PL structure determination was obtained coupling HPLC-ELSD (fitted with HILIC columns) and ESI-MS. With such coupling applied to SPE purified Folch extract, Verardo et al. [56] could characterize the PL molecular species present in a cheese cream by-product. Guerra et al. [35] used the same methodology as Verardo et al. [56,128] to check the effect of cow’s diet supplementation (extruded linseed and fresh forage) on the quality of PL in the same cream by-product. Supplementation led to an increase in PL in cream which was quantified by HPLC-ELSD. LC-ESI-MS helped determining molecular species present in each class, which were otherwise quantified with GC-FID after derivatization into methyl esters. Supplementation led to a higher degree of unsaturation of phospholipids FA. Compared with the results of Verardo
et al. [56], several new molecular species were identified (for PI m/z = 833 with C16:0/C18:2 or
C16:1/C18:1; for PS m/z 790 and 804 corresponding to C18:0/C18:0 or C14:0/C22:0 or C16:0/ C20:0 and C14:0/C24:0 or C18:2/C20:5, respectively; for SM m/z 817, corresponding to C18:0/ C24:0 or C20:0/C22:0).
The use of hybrid ion trap/time-of-flight MS coupled with LC (LC-IT-TOF-MS) on MPL was proposed by Donato et al. [27] to benefit from the high mass accuracy and MS(n) capabilities of such system [131] (Table 9.8). After Folch extraction and SPE purification, these authors could resolve PL FA compositions in cow and donkey milks using HPLC (HILIC column)-IT-TOF/MS. Russo et al. [26] carried on the work of Donato et al. [27] by improving HPLC separation. Mobile phases
consisted of acetonitrile-ammonium formate (A; 9:1 v/v; pH = 5.5) and acetonitrile- methanol-
ammonium formate (B; 55:35:10 v/v/v; pH = 5.5).
The use of orbitrap analyzer in positive mode post HPLC-ELSD quantification and MS2 scan
helped determining PL species in milk samples [114]. Around 70 PL species were identified includ-ing LaCer and GluCer species. This approach was further applied to qualify seasonal variation of milk during milking season [115]. This study could demonstrate that: (i) most PL classes were positively correlated with the total fat content, and (ii) negatively correlated with fat globule size, MPL presented interindividual and seasonal variations, and (iii) MPL classes relative profile stayed constant over lactation.
TABLE 9.7
Overview of MS or HPLC-MS Methods Proposed in the Literature to Determine MPL Classes. Sample Phospholipid Identified Extraction Method Determination
Method Technical Details Refs. Bovine milk,
bovine buttermilk
LPC, PC, SM, ePC, LPE, PE-cer, ePE, PI, PS, PA Folch method and SPE purification Infusion in ESI-MS/MS
Use of a large panel of internal standard, good quantification despite low structural definition
[55] Bovine milk, Bovine buttermilk PG, PA, PI, PS, PE, PC, SM, LPC, LPE, PE-cer, ePC, ePE
[124,14]
Human milk PI, PA, gangliosides
Folch method ESI FT-ICRMS Infusion, Varian 920 TQ-FTMS Fourier transform ion cyclotron resonancemass spectrometer equipped
with a 9.4-T superconducting magnet; specific extraction and structure identification of gangliosides [119] Bovine milk, donkey milk PI, PS, PE, PC, SM, LPC Folch method and SPE purification (Avalli method) HPLC-ELSD HPLC-ESI-IT-TOF-MS
Ascentis Express HILIC,
150 mm × 2.1 mm I.D. with partially porous (Fused-core) particles of 2.7 µm, Mobile phases: (A) acetonitrile and (B) acetonitrile–water (2:1, v/v) [27] Human milk, donkey milk, bovine milk, goat milk PI, PS, PE, PC, SM, LPC
Folch method HPLC-ELSD HPLC-ESI-IT-TOF-MS
Ascentis Express HILIC, 150 × 4.6 mm I.D., 2.7 μm d.p. Mobile phases: acetonitrile-ammonium formate (A; 9:1, v/v; pH = 5.5); acetonitrile-methanol-ammonium formate (B; 55:35:10, v/v/v; pH = 5.5) [26] Bovine milk, goat milk, sheep milk PI, PE, PC, SM, LPC Bligh–Dyer method MALDI-TOF-MS Home-made α-cyano-4-chlorocinnamic acid (CClCA) matrix
[30]
Bovine milk PI, PS, PE, PC, SM, LPC
Folch method LC × LC-MS HILIC column in the first dimension (1D, octadecylsilica column in the second dimension (2D), run under stop-flow conditions [125] Milk from 124 cows submitted to diet experiment
PI, PE, PC, SM Folch method (modified) and SPE purification
HPLC-ESI-IT-MS
HILIC column, ion trap mass spectrometer in negative mode, full-scan MS3 [36] Bovine buttermilk PC, PE, PI, PS, SM
Folch method HPLC-ELSD HPLC-ESI-MS
silica column (150 × 3 mm, 3 μm particle diameter; Phenomenex), comparison of HPLC methods of [34,57]] [56] Heat-treated powder of Bovine milks Lactosylated-PE, PG, PI, PE, PS Bligh and Dyer or direct in matrix extraction (DIME) MALDI-TOF-MS
Test of tradition or direct in matrix extraction, Home-made α-cyano-4-chlorocinnamic acid (CClCA) matrix in positive mode,
1,8-bis(dimethylamino) naphthalene (DMAN) matrix for analysis in negative modes of PE and PS
[126]
The application of MS(n) sequential fragmentation procedures helped precising PL species, it was used combined to UHPLC by Craige et al. [36] to characterize MPL change in a diet test in Holstein-Friesian cows. The complex profile in PL could be resolved and result in the identification of 7 species of phosphatidylinositol (PI), 12 species of phosphatidylethanolamine (PE), 18 species of phosphatidylcholine (PC) and 13 species of sphingomyelin (SM). Some new species were iden-tified, such as PI 18:1/18:2, PE 14:0/18:2, PE 14:0/18:1, PC 16:0/14:0, PC 16:0/15:0, PC14:0/18:1 PC 15:0/18:1, PC 16:0/18:0, PC 17:0/18:1 and PC 18:1/18:1. They could qualitatively judge that the change in diet influenced a small number of species (PE 14:0/18:1, PE 18:0/18:1, PC 15:0/18:1, PC 18:0/18:1, SM d18:1/14:0, SM d18:1/15:0, SM d18:1/22:0 and SM d18:1/23:0).
In MALDI, the extract to be analyzed is mixed with a matrix and then ionized in solid phase by irradiation with laser (UV or Infrared). MALDI is less sensitive to the salinity of the sample than in ESI, is faster and more sensitive (a few nanograms of lipids needed). The ions gener-ated by MALDI bear a single charge, which makes interpretation faster and more sensitive than in ESI. Calvano et al. [30] proposed MALDI-TOF-MS to detect milk adulteration by analy-sis of milk MPL. After a Bligh and Dyer extraction on pure or commercial goats’ and cows’
milks or mixture of both, the lipid fraction was deposited on an α-cyano-4-chlorocinnamic
TABLE 9.7 (Continued)
Overview of MS or HPLC-MS Methods Proposed in the Literature to Determine MPL Classes. Sample Phospholipid Identified Extraction Method Determination
Method Technical Details Refs. Human milk, bovine milk PI, PS, PE, PC, SM Chloroform/ methanol/ isopropanol 1:2:4 v/v/v (7.5 mM ammonium formate)
TripleTOF-MS Infusion, internal MPL standard with one acyl chain in C17:0 allowed quantification, TriVersa NanoMate ion source in positive and negative modes, MS/MSALL analysis
[127]
32 milks GluCer, LacCer, PI, PE, PS, PC, SM Chloroform/ methanol 2/1 v/v HPLC-LTQ Orbitrap-MS
HILIC column, orbitrap mass analyzer in positive mode [114,115] Cream by-product of industrial Parmigiano Reggiano PI, PS, PE, PC, SM Folch method and SPE purification (Avalli method) HPLC-ELSD HPLC-ESI-MS
HPLC method of [128] using HILIC column, ESI in negative mode for PE, PI and PS; positive mode for PC and SM
[35]
Raw milk and powder milk PI, PS, PE, PC, SM, LPC Folch method, SPE purification followed by preparative HPLC HPLC-UV MALDI-TOF/ TOF-MS
Preparative LC using: Home-made phosphoester chemically bonded stationary phase containing diol,phosphate and octadecyl groups (Diol-P-C18)
Maldi-TOF/TOF-MS 5 bruker), DHB matrix, positive and negative modes
[129] Human milk (colostrum, transitional and mature from pre-term and term infants) PC, SM, PE and FA distribution in each class Modified Bligh and Dyer
HPLC-MS/MS HILIC column, Binary gradient ammonium formate/acetonitrile, ESI-triple quadrupole, dynamic multiple reaction monitoring (MRM)


![FIGURE 9.5 Efficient MPL purification by SPE described by Avalli et al. [57].](https://thumb-eu.123doks.com/thumbv2/123doknet/13829715.443208/13.832.82.722.600.1034/figure-efficient-mpl-purification-spe-described-avalli-et.webp)