HAL Id: hal-03164588
https://hal.uca.fr/hal-03164588
Submitted on 10 Mar 2021
HAL is a multi-disciplinary open access
archive for the deposit and dissemination of sci-entific research documents, whether they are pub-lished or not. The documents may come from teaching and research institutions in France or abroad, or from public or private research centers.
L’archive ouverte pluridisciplinaire HAL, est destinée au dépôt et à la diffusion de documents scientifiques de niveau recherche, publiés ou non, émanant des établissements d’enseignement et de recherche français ou étrangers, des laboratoires publics ou privés.
Sr of Individual Olivine-Hosted Melt Inclusions from
Hawai’i
Olivia Anderson, M. Jackson, Estelle Rose-Koga, J. Marske, M. Peterson, A.
Price, B. Byerly, A.A. Reinhard
To cite this version:
Olivia Anderson, M. Jackson, Estelle Rose-Koga, J. Marske, M. Peterson, et al.. Testing the Recycled Gabbro Hypothesis for the Origin of ”Ghost Plagioclase” Melt Signatures Using 87Sr/ 86 Sr of In-dividual Olivine-Hosted Melt Inclusions from Hawai’i. Geochemistry, Geophysics, Geosystems, AGU and the Geochemical Society, 2021, 22, �10.1029/2020GC009260�. �hal-03164588�
1
Testing the Recycled Gabbro Hypothesis for the Origin of "Ghost Plagioclase" Melt
1Signatures Using
87Sr/
86Sr of Individual Olivine-Hosted Melt Inclusions from Hawai'i
2O. E. Anderson1*, M. G. Jackson1, E. F. Rose-Koga2, J. P. Marske3, M. E. Peterson4, A. A.
3
Price1, B. L. Byerly1,5 , A.A. Reinhard6
4
1Isotope Geochemistry Facility – Center for Mantle Zoology, University of California Santa
5
Barbara, Department of Earth Science, Santa Barbara, CA, USA 2Université Clermont
6
Auvergne, CNRS, IRD Laboratoire Magmas et Volcans, OPGC, Clermont-Ferrand, France 7
3Department of Terrestrial Magnetism, Carnegie Institution of Washington, Washington, DC,
8
USA 4AAAS Science and Technology Policy, ORISE Fellow hosted by the DOE, Washington,
9
DC, USA 5Thermo Fisher Scientific, Waltham, Massachusetts, USA, 6 Los Alamos National
10
Laboratory, Nuclear and Radiochemistry Group, Los Alamos, NM, USA 11
*Corresponding author: Olivia E. Anderson (anderson03@ucsb.edu) 12
13
Key Points:
14
• Hawaiian melt inclusions are variable in 87Sr/86Sr, but are within the 87Sr/86Sr range of the
15
lavas from their host volcano. 16
• Mauna Loa melt inclusions with high (Sr/Ce)N (ghost plagioclase) signatures have the
17
same 87Sr/86Sr as inclusions with normal (Sr/Ce)N.
18
• Diffusive interaction between rising melt and Hawaiian gabbros can produce the ghost 19
plagioclase signature in Mauna Loa melt inclusions. 20
2
Abstract
22
Melt inclusions with large, positive Sr anomalies have been described in multiple tectonic 23
settings, and the origins of this unusual geochemical feature are debated. Three origins have been 24
proposed involving plagioclase as the source of the elevated Sr: (i) direct assimilation of 25
plagioclase-rich lithologies, (ii) recycled lower oceanic gabbro in the mantle source, and (iii) 26
shallow-level diffusive interaction between present day lower oceanic crust (i.e., plagioclase-27
bearing lithologies) and the percolating melt. A “ghost plagioclase” signature (i.e., a large, 28
positive Sr anomaly without associated high Al2O3) is present in melt inclusions from Mauna
29
Loa. We present new 87Sr/86Sr measurements of individual olivine-hosted melt inclusions from
30
three Hawaiian volcanoes, Mauna Loa, Loihi, and Koolau. The dataset includes a Mauna Loa 31
melt inclusion with the highest reported Sr anomaly (or highest (Sr/Ce)N, which is 7.2) for
32
Hawai'i. All melt inclusions have 87Sr/86Sr values within the range reported previously for the
33
lavas from each volcano. Critically, the 87Sr/86Sr of the high (Sr/Ce)N melt inclusion lies within
34
the narrow range of Mauna Loa melts that lack high (Sr/Ce)N signatures. To explain the high
35
(Sr/Ce)N ratio of the ghost plagioclase signature using an ancient recycled gabbro would
36
therefore require the gabbro-infused mantle source to evolve, by chance, to have the same 37
87Sr/86Sr as the source of the Mauna Loa melts that lack a recycled gabbro (ghost plagioclase)
38
signature. Alternatively, shallow-level diffusive interactions between Mauna Loa plagioclase-39
rich cumulates and a percolating mantle-derived melt provides a simpler explanation for the 40
presence of the high (Sr/Ce)N Mauna Loa melts.
41
1. Introduction
42
Melt inclusions, encapsulated within growing magmatic phenocrysts at depth, provide 43
“snapshots” of melt evolution that may not be preserved in whole rock compositions. One 44
geochemical signature found in melt inclusions is high Sr concentrations relative to trace 45
elements of similar incompatibility (such as Ce, Nd, and Sm). The magnitude of the Sr anomaly 46
can be quantified with the ratio (Sr/Ce)N (where N signifies normalization to primitive mantle;
47
McDonough & Sun, 1995). Melt inclusions with high (Sr/Ce)N ratios are significant because the
48
Sr anomaly found within these inclusions suggest plagioclase was involved in melt petrogenesis. 49
However, plagioclase accumulation, or assimilation, is not always obvious in the major element 50
chemistry of these melt inclusions (Danyushevsky et al., 2003, 2004; Gurenko & Chaussidon, 51
1995; Michael et al., 2002; Peterson et al., 2014; Saal et al., 2007; Slater et al., 2001; Sobolev et 52
al., 2000). 53
Melt inclusions with high (Sr/Ce)N have been described from samples taken from
mid-54
ocean ridges (MORs; e.g., Danyushevsky et al., 2003, 2004; Michael et al., 2002) and hotspot 55
lavas erupted at ocean islands such as Galapagos (Peterson et al., 2014), Hawai'i (Sobolev et al., 56
2000, 2011), and Iceland (e.g., Gurenko & Chaussidon, 1995; Maclennan, 2008; Slater et al., 57
2001). A common geologic material with high (Sr/Ce)N ratios is cumulate gabbro, which can be
58
a plagioclase-rich lithology. Its abundance in the deep oceanic crust represents the intrusive part 59
of the MOR sequence, and makes gabbro an obvious candidate for imparting large positive Sr 60
anomalies on percolating melts at MOR and ocean island settings (Peterson et al., 2014; Saal et 61
al., 2007; Sobolev et al., 2000; Yaxley & Sobolev, 2007). Plagioclase likely plays a central role 62
in generating large positive Sr anomalies because Sr is compatible in plagioclase compared to 63
elements of similar behavior (Sm, Nd) during peridotite melting and subsequent differentiation 64
in mafic magmatic systems. 65
3 Melts with large, positive Sr anomalies signal interaction with plagioclase-rich lithologies 66
like gabbro. Paradoxically, a subset of these high (Sr/Ce)N melt inclusions lack coexisting
67
enrichments in major elements associated with plagioclase (e.g., Al), giving rise to the concept of 68
“ghost plagioclase” signatures in rare melt inclusions trapped in magmatic phenocrysts (Sobolev 69
et al., 2000). Three hypotheses invoked to explain the rare occurrences of large, positive Sr 70
anomalies in melt inclusions include: (i) direct assimilation of gabbro by upwelling melts 71
(Danyushevsky et al., 2003), (ii) melts of recycled lower oceanic (gabbroic) crust in the mantle 72
source that are hybridized with peridotite and trapped as melt inclusions in growing magmatic 73
phenocrysts (Chauvel & Hémond, 2000; Hofmann & Jochum, 1996; Sobolev et al., 2000; 74
Yaxley & Sobolev, 2007), and (iii) diffusive interaction between percolating melt and a 75
plagioclase-rich crystal mush (Peterson et al., 2014; Saal et al., 2007). 76
Direct assimilation has been ruled out to explain Sr anomalies in many oceanic hotspot 77
melt inclusions from Hawai'i (Sobolev et al., 2000) and Galapagos (Peterson et al., 2014) 78
because the ghost plagioclase melt inclusions have large, positive Sr anomalies that do not have 79
corresponding elevated Al2O3, as would be expected for direct assimilation of Al-rich
80
plagioclase (e.g., Peterson et al., 2014; Sobolev et al., 2000). 81
Regarding the second hypothesis, melts of recycled gabbroic lower oceanic crust may 82
generate trace element chemistry similar to many high (Sr/Ce)N inclusions from ocean islands.
83
The recycled gabbro model suggests eclogite, metamorphosed gabbroic material, would partially 84
melt earlier (deeper) than surrounding peridotite in an upwelling mantle plume (Sobolev et al., 85
2000; Yaxley & Sobolev, 2007). The melt of the eclogite is silicic (e.g., dacitic) and thus would 86
react with surrounding peridotite, producing garnet-bearing pyroxenites (Yaxley & Green, 1998). 87
The large, positive Sr anomaly is transferred from the silicic melt to the reacted pyroxenite and 88
resides mainly within clinopyroxene. When the reacted pyroxenite partially melts during 89
continued plume upwelling, high-MgO liquids with elevated Sr are generated and mix with 90
normal melts formed by partial melting of peridotite. In the recycled gabbro melting model, the 91
Sr budget in a high (Sr/Ce)N melt will be dominated by Sr from the gabbro, because the
92
peridotite in the melt source of this model is not assumed to have a large, positive Sr anomaly. 93
As a result, this model predicts that Mauna Loa melt inclusions with large, positive Sr anomalies 94
will have essentially the same 87Sr/86Sr as the recycled gabbro.
95
The third hypothesis predicts that diffusive interaction between percolating melt and 96
plagioclase-rich mush will produce trace element patterns reflecting a gabbro contribution. Due 97
to the slow diffusive nature of major elements (e.g., Al2O3), the diffusion model will not generate
98
significant changes in the major element concentration of a melt. In addition, diffusive 99
interaction will cause the high (Sr/Ce)N melt inclusions to have the same Pb (Peterson et al.,
100
2014) and Sr (this study) isotopic composition as the gabbro through which they percolated 101
(because Sr and Pb have high diffusivities in plagioclase). If the melt percolated through and 102
interacted with the gabbro of the ~100 Ma (Müller et al., 2008) MOR crust beneath Hawai'i, melt 103
inclusions will adopt 87Sr/86Sr of the relatively modern MOR crust. Conversely, if the melt
104
inclusions with high (Sr/Ce)N result from interaction with gabbroic mush in a Mauna Loa magma
105
chamber, these inclusions will have 87Sr/86Sr that is indistinguishable from lavas erupted at
106
Mauna Loa. In both cases (i.e., MOR gabbro or Mauna Loa gabbro), the resulting 87Sr/86Sr ratio
107
of high (Sr/Ce)N melt inclusions is predicted to be indistinguishable from the 87Sr/86Sr of the
108
gabbro with which the percolating melt interacted. 109
4 This study presents strontium isotopes measured on melt inclusions with high (Sr/Ce)N to
110
distinguish between the two hypotheses—diffusive interaction between percolating melt and 111
modern plagioclase-rich mush versus melts of ancient recycled gabbro—for generating “ghost 112
plagioclase” signatures in melt inclusions. In addition, major, volatile (Cl and S), and trace 113
element concentrations are included for individual melt inclusions isolated from six different 114
lavas from three Hawaiian volcanoes: Mauna Loa, Loihi, and Koolau. One of the melt inclusions 115
from Mauna Loa reported here has the highest (Sr/Ce)N (7.2) ratio ever reported in a Hawaiian
116
lava or melt inclusion. 117
2. Methods
118
Olivine-hosted melt inclusions and glasses from six Hawaiian picrites from Mauna Loa 119
(samples Puu2, Puu7, and ML-2012-27), Loihi (samples 6K490-1 and 6K490-2), and Koolau 120
(sample K89-6; Figure 1) were analyzed. Melt inclusions in this study were not homogenized, as 121
most melt inclusions analyzed were naturally glassy, and characterized for 87Sr/86Sr and
122
elemental concentrations. However, five inclusions (Puu2-1-2, Puu7-2-15, Puu7-2-92b, K89-123
6_52, 6K490-1_51) were partially crystalline and were characterized only for 87Sr/86Sr, and not
124
for elemental concentrations. 125
The Supplement describes the samples selected, melt inclusion preparation methods, 126
including grinding the olivines into tiny (several hundred microns on a side) cubes to remove all 127
Figure 1. Map of the
Hawaiian Islands showing sample locations (red dots) for the six samples in this study: two from Loihi, three from Mauna Loa, and one from Koolau. The three Mauna Loa samples (red dot on Mauna Loa), and the two Loihi samples (red dot on Loihi) are located very close geographically and are represented by a single symbol. Black dots mark the volcanoes that are used for comparison in this study. Map was created using GeoMapApp (geomapapp.org).
5 accessory inclusions within an olivine grain (Figure 2), thereby isolating the melt inclusion of 128
interest. The Supplement also includes detailed major (electron microprobe), volatile (electron 129
microbrobe and ion probe), and trace (laser ablation ICP-MS) element analytical techniques of 130
melt inclusions, host olivines, and host pillow glass/tephra. Finally, the Supplement includes 131
details of Sr separation chemistry for melt inclusions, and 87Sr/86Sr analyses by thermal
132
ionization mass spectrometry (TIMS) at the University of California, Santa Barbara Isotope
133
Geochemistry Facility. 134
3. Results
135
The melt inclusions are hosted in olivine crystals ranging from Fo80.4 to Fo90.1 (Table S1).
136
Melt inclusions span a wide range of sizes, most having maximum major axis lengths between 137
120 and 630 µm (Figure S3). A high, positive Sr anomaly can be quantified using (Sr/Ce)N.
138
Below we group the melt inclusions from Mauna Loa (including this study) into two sets: High 139
(Sr/Ce)N inclusions (with (Sr/Ce)N > 2), and normal-type melt inclusions (with (Sr/Ce)N between
140
0.8 and 1.3, and excluding the ultra-calcic melt inclusion). Three Pu'u Wahi melt inclusions 141
(samples Puu7-2-15, Puu7-2-92b, and Puu2-1-2), and one melt inclusion each from Koolau 142
(sample K89-6_52) and Loihi (sample 6K490-1_51), are partially crystalline. Partially crystalline 143
inclusions are not included in major and trace element plots as crystallization can modify major 144
and trace element concentrations, but they are included within the 87Sr/86Sr dataset.
145
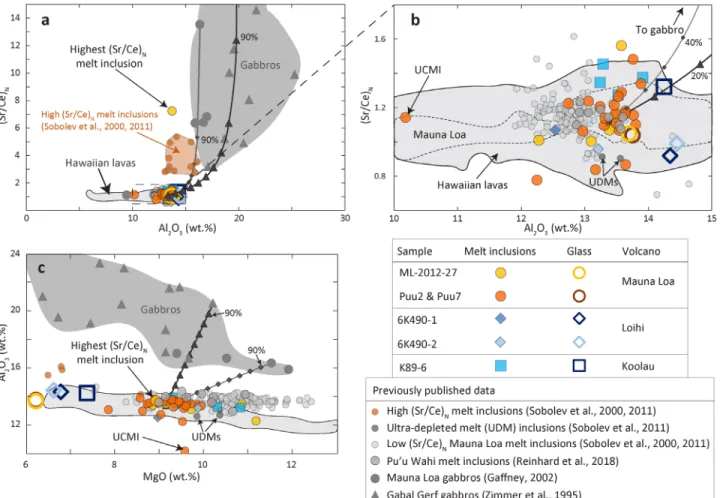
In a plot of Al2O3 versus MgO (Figure 3), the highest (Sr/Ce)N melt inclusion from
146
Mauna Loa is shown with new data on normal-type melt inclusions and previously published 147
Mauna Loa melt inclusions (Reinhard et al., 2018; Sobolev et al., 2000, 2011) and Hawaiian 148
whole rock and glass data (Frey et al., 2016; Garcia et al., 1993, 1995, 1998). Frey et al. (2016) 149
compiled a dataset of Hawaiian shield-stage lavas and provides a high-quality dataset of major 150
and trace elements and 87Sr/86Sr compositions for comparison to the lavas and melt inclusions in
151
this study. The melt inclusions presented here, including the highest (Sr/Ce)N melt inclusion,
152
have Al2O3 concentrations similar to the host glasses and plot on, or close to, the array formed by
153
Hawaiian lavas (the exception is a single ultra-calcic melt inclusion which has ~2 wt.% lower 154
concentration of Al2O3 than the Hawaiian array at the same MgO content). Gabbroic xenoliths
155
Figure 2. Method for isolating individual olivine-hosted melt inclusions. (a) Olivines often have multiple melt
inclusions and all except for the target melt inclusion must be removed prior to sample leaching and dissolution. First, the target inclusion is exposed, the host olivine is mounted in epoxy, and the melt inclusion is analyzed for major, trace, and volatile elements using in situ techniques. (b) After in situ analysis, accessory melt inclusions are removed by
mounting the olivine grain onto a glass slide using Crystalbond™. (c) The olivine is then ground on silicon carbide
grinding mats until the accessory melt inclusions on one side of the olivine grain are removed. (d) The olivine grain is
reoriented to optimally remove remaining accessory melt inclusions, and this process is repeated until only the target melt inclusion is left within a case of its olivine host (e). The “cubed” melt inclusion is then leached and cleaned in
6 from Mauna Loa (sampling the deep recesses of Mauna Loa volcano; Gaffney, 2002), and
156
gabbros from the Gabal Gerf ophiolite (Zimmer et al., 1995), plot above the array formed by 157
Hawaiian melt inclusions and whole rocks. Critically, the highest (Sr/Ce)N melt inclusion
(ML-158
2012-27_19b) is not shifted off of the Hawaiian array toward the gabbroic compositions. 159
Melt inclusions have major element characteristics consistent with Hawaiian whole rock 160
and glass data reported in the literature (Figure S4). In general, melt inclusions have lower FeOt
161
(total iron as FeO) compared to their host glass, which is similar to olivine-hosted melt 162
inclusions from other localities that have experienced post-entrapment Fe-Mg diffusive exchange 163
(Danyushevsky et al., 2000; Gaetani & Watson, 2000; Kent, 2008; Sobolev & Danyushevsky, 164
1994). Some of the Mauna Loa inclusions have high CaO relative to the Hawaiian lava array, 165
including a single ultra-calcic melt inclusion reported here (sample Puu2-1-39, seen most clearly 166
in the panel showing CaO/Al2O3 versus MgO in Figure S4f), consistent with previous findings of
167
high CaO melts at Hawai'i (Huang & Humayun, 2016; Kogiso & Hirschmann, 2001). While 168
some melt inclusions in this study have slightly different major element compositions that trend 169
outside of the field defined by Hawaiian lavas (Figure S4), below we show that none of the melt 170
inclusions have unusual 87Sr/86Sr that varies outside of the range found in whole rocks and
171
glasses at each respective volcano. 172
The Mauna Loa melt inclusions from Pu'u Wahi reported here have a range of (Sr/Ce)N
173
of 0.8–1.5, and the ML-2012-27 Mauna Loa melt inclusions reported here have a (Sr/Ce)N range
174
of 1.0–7.2 (Figures 3 and 4), where (Sr/Ce)N of 7.2 is the highest value reported for any Mauna
175
Loa melt inclusion. Sobolev et al. (2000, 2011) reported (Sr/Ce)N values up to 5.4, with 11
176
inclusions that have (Sr/Ce)N>2. In a plot of (Sr/Ce)N versus Al2O3 (Figure 3), the highest
7 (Sr/Ce)N inclusion in this study does not show an anomalous Al2O3 concentration relative to the
178
Figure 3. High (Sr/Ce)N Hawaiian melt inclusions and host pillow/tephra glasses compared to Hawaiian lavas,
and to Mauna Loa and Gabal Gerf gabbros. (a) In (Sr/Ce)N versus Al2O3 (wt.%) space, the melt inclusion data
do not show a positive correlation. A mixing model (line with filled diamonds) is shown between the average Pu'u Wahi melt inclusion composition from this study (Table S10) and the Mauna Loa gabbro with the highest (Sr/Ce)N (sample 98-65, with (Sr/Ce)N = 13.5) from Gaffney (2002), with 10% increments marked; a second
mixing model (line with filled triangles) is shown between the average Pu'u Wahi melt inclusion composition (Table S10) and the Gabal Gerf gabbro with the highest (Sr/Ce)N (sample GG36, with (Sr/Ce)N = 148) from
Zimmer et al. (1995). (b) The same plot as in (a) except expanded to highlight melt inclusions with (Sr/Ce)N < 2.
(c) In Al2O3 (wt.%) versus MgO (wt.%) space; the mixing model uses the same mixing endmembers as panels
(a) and (b). We use the comprehensive Hawaiian dataset (which includes both whole rock and glass analyses) from Frey et al. (2016) for comparison because it provides a compilation of the highest-quality major and trace element data from Hawai'i. The Frey et al. (2016) dataset has been filtered as described in Section S1.5 of the Supplementary Methods. Loa-trend volcanoes (Loihi, Mauna Loa, Koolau, Lanai, and Kahoolawe) and Kea-trend volcanoes (Mauna Kea and Kilauea) from the Frey et al. dataset are shown here. The tephra/pillow glass for each sample hosting melt inclusions is also shown for reference. The Pu'u Wahi tephra glass major and trace element concentrations are from Sobolev et al. (2011). Low (Sr/Ce)N Mauna Loa melt inclusions from Sobolev
et al. (2000, 2011) include inclusions with (Sr/Ce)N < 2. Concentrations shown in the figure have been corrected
for addition or subtraction of equilibrium olivine so that the melt inclusions are in equilibrium with the host olivine. Only data for glassy melt inclusions are shown. The two ultra-depleted melt (UDM) inclusions from Sobolev et al. (2011) are identified. An outlier with low Al2O3 content, which is an ultra-calcic melt inclusion
8 melt inclusions with lower (Sr/Ce)N.
179
In a plot of (Sr/Ce)N versus (La/Sm)N (Figure 4), the high (Sr/Ce)N inclusions, all of
180
which are from Mauna Loa, tend to have lower (La/Sm)N ratios than normal-type melt inclusions
181
and Hawaiian lavas, which is consistent with prior observations at Hawai'i (Sobolev et al., 2000) 182
and Galapagos (Peterson et al., 2014). Excluding the ultra-depleted melt (UDM) inclusions from 183
Sobolev et al. (2011), the melt inclusion with the highest (Sr/Ce)N has the lowest (La/Sm)N
184
observed in Hawaiian melts. Like other high (Sr/Ce)N inclusions from Hawai'i, the high (Sr/Ce)N
185
inclusion is depleted in light rare earth elements (REEs) relative to middle REEs, an observation 186
that has been made before at Hawai'i (e.g., Sobolev et al., 2000) and Galapagos (Peterson et al., 187
2014). Notably, all Hawaiian melt inclusions with high (Sr/Ce)N in this study are hosted in
188
Mauna Loa lavas; none of the Loihi or Koolau samples have large positive (Sr/Ce)N, but we note
189
that fewer Loihi and Koolau melt inclusions have been characterized. 190
Mauna Loa melt inclusions reported here have some variability in trace element ratios. 191
Primitive mantle (McDonough & Sun, 1995) normalized trace element patterns (spidergrams) of 192
all glassy melt inclusions reported in this study are shown together with spidergrams of the host 193
glass or tephra (Figure 5a–d). The highest (Sr/Ce)N inclusion exhibits the most significant
194
deviation in pattern shape (with overall depletion in incompatible trace element abundances 195
compared to the other Mauna Loa inclusions). For comparison, the Mauna Loa gabbro with the 196
highest (Sr/Ce)N (sample 98-65; Gaffney, 2002) is plotted against Mauna Loa sample
ML-2012-197
27 (Figure 5). The highest (Sr/Ce)N inclusion has a similar spidergram to high (Sr/Ce)N
198
inclusions from Sobolev et al. (2000, 2011), but different compared to the average normal Pu'u 199
Wahi melt inclusion (Figure S5). Pu'u Wahi melt inclusions from Mauna Loa reported in 200
Reinhard et al. (2018) are plotted alongside this study’s Pu'u Wahi inclusions, and they exhibit 201
less variability in spidergram patterns than the Mauna Loa ML-2012-27 inclusions. Similarly, the 202
Figure 4. (Sr/Ce)N versus (La/Sm)N plot shows the diffusive interaction model results (black crosses) for Mauna
Loa based on the Peterson et al. (2014) model, and the numbers next to the data points represent the number of years of diffusion. Mixing lines are shown between the ML-2012-27 host tephra composition (Table S8) and compositions generated at 1, 20, and 400 years of diffusive interaction. Average 2σ error bars are shown in the top right corner of plot.
9 spidergrams for the Loihi and Koolau inclusions show relatively little variability and are similar 203
to the host glass. 204
Figure 5 also shows that the Mauna Loa gabbros from Gaffney (2002) contain positive Pb 205
anomalies whereas the Mauna Loa melt inclusions have negative Pb anomalies. Sulfides are 206
observed in Hawaiian lavas (Stone & Fleet, 1991). If sulfides are responsible for the positive Pb 207
anomalies in Mauna Loa gabbros (which are cumulates of Mauna Loa melts), this can be taken 208
as evidence for sulfide fractionation from Hawaiian magmas at depth as being the mechanism 209
generating the negative Pb anomalies in high (Sr/Ce)N inclusions.
210
The 87Sr/86Sr of melt inclusions from the five lavas examined here (Table 1) are similar
211
to, or slightly larger, than the range observed for their respective host volcano. The 87Sr/86Sr
212
range for all of the Mauna Loa inclusions reported here is relatively small, ranging from 213
0.703700 to 0.703986 (87Sr/86Sr range of 406 ppm, Figure 5). The inclusions fall within the range
214
reported for Mauna Loa lavas (0.703599–0.703967; Hauri et al., 1996; Kurz et al., 1995). The 215
highest (Sr/Ce)N melt inclusion (ML-2012-27_19b) has an 87Sr/86Sr of 0.703828 ± 0.000045, and
216
this inclusion, which also has the lowest (La/Sm)N in this study, has indistinguishable 87Sr/86Sr
217
from the other Mauna Loa melt inclusions from the same lava (including Mauna Loa melt
218
inclusions with low (Sr/Ce)N (Figure 6)). The Loihi melt inclusions (from two different lavas)
219
have 87Sr/86Sr ratios ranging from 0.70328 to 0.70367 (87Sr/86Sr range of 555 ppm), which
220
extends the range of 87Sr/86Sr identified for Loihi lavas (0.70344 to 0.70378; Bennett et al., 1996;
221
Garcia et al., 1995) to slightly lower 87Sr/86Sr. The Koolau melt inclusions (all from a single lava
222
sample) exhibit the largest range of 87Sr/86Sr among melt inclusions in this
10 224
11 225
Figure 5. Primitive mantle normalized trace element patterns, or spidergrams, (left panels) and corresponding
87Sr/86Sr values (right panels) of all Hawaiian melt inclusions and host pillow/tephra glass in this study (note that 5
melt inclusions—Puu2-1-2, Puu7-2-15, Puu7-2-92b, K89-6_52, 6K490-1_51—are crystalline, so their spidergrams are not shown, but 87Sr/86Sr are). Concentrations shown in the figure have been corrected for addition or subtraction
of equilibrium olivine so that the melt inclusions are in equilibrium with the host olivine. (a–b) Spidergrams for
melt inclusions and host tephra from the three Mauna Loa samples—ML-2012-27 and the Pu'u Wahi samples (Puu2 and Puu7)—are shown together with a spidergram from a Mauna Loa gabbro with the highest (Sr/Ce)N (sample
98-65 from Gaffney (2002)); spidergrams for melt inclusions from Pu'u Wahi from Reinhard et al. (2018) are also shown. The Pu'u Wahi tephra trace element concentrations are from Sobolev et al. (2011). (c) Spidergrams of
Koolau melt inclusions from sample K89-6 with the host glass. (d) Spidergrams of Loihi melt inclusions from
samples 6K490-1 and 6K490-2 are shown with the two respective host glasses. (e–f) The 87Sr/86Sr of the host
pillow/tephra glass is shown as a straight line and dashed lines represent the 2σ (2SE) error bars. Panel (f) compares
the 87Sr/86Sr of melt inclusions from Mauna Loa samples “Puu2” and “Puu7” analyzed here (orange symbols) and
by Reinhard et al. (2018) (grey symbols). The 87Sr/86Sr results (generated in two different labs, UCSB and Vrije
University, respectively) are remarkably consistent (the 87Sr/86Sr of the host tephra glass is shown as a straight line
and was analyzed by Reinhard et al. (2018)). Partially crystalline inclusions are indicated in panels (f–h), and
spidergrams are not available for these inclusions. Note that the host pillow glass 87Sr/86Sr ratios for the two Loihi
12 226
Figure 6. Important trace element ratios versus 87Sr/86Sr. (a–b) (Sr/Ce)
N versus 87Sr/86Sr. (c) (La/Sm)N versus 87Sr/86Sr. (d) Cl/Nb versus 87Sr/86Sr. Note that melt inclusions in Sobolev et al. (2011) with 87Sr/86Sr are not shown
as described in Section 3, and melt inclusions from Sobolev et al. (2000), including high (Sr/Ce)N inclusions, do not
have 87Sr/86Sr. Fields for individual Hawaiian volcanoes are shown in (b) and (c) and the data are from Frey et al.
(2016), which were filtered to exclude altered and differentiated lavas, as described in the Supplementary Methods Section S1.5, and thus the full range of 87Sr/86Sr for the volcanoes is not necessarily represented in this figure. Each
plot on the left-hand side shows the diffusive interaction model results (black crosses) for Mauna Loa based on the Peterson et al. (2014) model and the numbers next to the crosses represent the number of years of diffusion. Mixing lines (grey lines with small grey diamonds representing increments of 10%) are shown between the ML-2012-27 host tephra composition and diffusion model results of 1 year and 20 years. For panel (d), note that samples
ML-2012-27 and K89-6 do not have published Cl concentrations and Cl was not analyzed in the glasses in this study. Pu'u Wahi glass Cl concentration is from Sobolev et al. (2011). Cl concentrations for Loihi samples 6K490-1 and 6K490-2 are from Pietruszka et al. (2011). All panels show average 2σ error bars in the bottom right corner of plots.
13 study (0.703654 ± 0.000079 to 0.704401 ± 0.000031, 1062 ppm total variability), which is 227
encompassed by the range of 87Sr/86Sr in Koolau lavas (0.703487 to 0.70451; Roden et al., 1994;
228
Tanaka et al., 2002). While there is 87Sr/86Sr heterogeneity in the Loihi and Koolau inclusions
229
examined here, the heterogeneity is not surprising given heterogeneity observed in olivine-hosted 230
melt inclusions at other OIB localities (Jackson & Hart, 2006; Harlou et al., 2009; Reinhard et 231
al., 2016, 2018). What is surprising is the remarkable 87Sr/86Sr homogeneity across the different
232
Mauna Loa melt inclusions examined here, in spite of extreme trace element variability (e.g., 233
(Sr/Ce)N). Below we focus the discussion on this unusual 87Sr/86Sr homogeneity.
234
Loihi melt inclusions have higher Cl contents (319 to 606 ppm) than the melt inclusions 235
from Mauna Loa (measured concentration of 10 to 183 ppm; see Table S1) or Koolau (20 to 45 236
ppm) (Figure 6e). Elevated Cl in Loihi melts was observed previously (Kent et al., 1999a, 1999b, 237
2002). Similarly, the three Loihi inclusions have the largest range in Cl/Nb (14 to 30), consistent 238
with the high Cl concentrations observed in Loihi glasses (Kent et al., 1999a, 1999b, 2002). In 239
comparison, Cl/Nb ratios tend to lower values in Koolau melt inclusions (5 to 7) and Mauna Loa 240
inclusions (4 to 14, excluding a single melt inclusion, sample Puu7-2-7a, with Cl/Nb = 21). 241
Critically, 87Sr/86Sr does not covary with Cl/Nb in the melt inclusion suite examined here,
242
suggesting seawater-derived materials are not responsible for generating the 87Sr/86Sr
243
heterogeneity (see Sections 4.1 and 4.3 for discussion on the interpretation). 244
Melt inclusions from Pu'u Wahi were previously analyzed for 87Sr/86Sr by Sobolev et al.
245
(2011) and Reinhard et al. (2018). Sobolev et al. (2011) analyzed a suite of 137 inclusions from 246
Pu'u Wahi using a laser ablation (LA) single-collector ICP-MS technique and reported an 247
extraordinary range in 87Sr/86Sr, from 0.7021 to 0.7081 (which is a range of ~8500 ppm, or
248
approximately ±3000 ppm 2σ relative standard deviation, or 2RSD; Figure 7). They showed that 249
the two UDMs identified in Pu'u Wahi inclusions yield the most extreme high 87Sr/86Sr values
250
(0.7081 ± 0.0004; two melt inclusions analyzed at least ten times each), and if these UDM 251
inclusions are excluded, the 87Sr/86Sr in their dataset has an average of 0.7039 ± 0.0019 (2SD)
252
(approximately ±2700 ppm 2RSD). In contrast, the 33 Pu'u Wahi melt inclusions analyzed for 253
87Sr/86Sr by TIMS in this study and the study of Reinhard et al. (2018) show very little variability
254
(i.e., 0.703700 to 0.703986, or approximately ±200 ppm 2RSD across both TIMS studies). Like 255
Reinhard et al. (2018), we did not identify UDM inclusions, which may partially explain the lack 256
of extreme 87Sr/86Sr in our study (but see below). However, even if the two UDM inclusions are
257
excluded from the Sobolev et al. (2011) dataset, the 2RSD in 87Sr/86Sr of the remaining 135
258
inclusions (i.e., approximately ±2700 ppm) is still ~13 times greater than the combined 2RSD in 259
87Sr/86Sr identified in this study and the study of Reinhard et al. (2018) (i.e., approximately ±200
260
ppm). 261
In summary, the TIMS 87Sr/86Sr results for Pu'u Wahi inclusions from two different
262
labs—Vrije University (N = 9 inclusions; Reinhard et al., 2018) and UCSB (N = 24 inclusions; 263
this study)—are in close agreement, but disagree substantially with the reported 87Sr/86Sr
264
variability in Pu'u Wahi inclusions from Sobolev et al. (2011) (Figure 7). One explanation is that 265
there is an inherent difference in precision between the two techniques. Rubidium (as well as 266
14 other isobaric interferences, e.g., 84Kr, 86Kr) limits the precision of 87Sr/86Sr analyses performed
267
by LA-ICP-MS, whereas chemical separation of Sr provides a means to minimize Rb prior to 268
analysis by TIMS, and TIMS does not suffer from the other isobaric interferences from the 269
carrier gas. We suggest that the difference in Pu'u Wahi melt inclusion 87Sr/86Sr variability
270
determined by LA single-collector ICP-MS (Sobolev et al., 2011) and TIMS (this study;
271
Reinhard et al., 2018) is the result of the former technique generating lower-precision analyses of
272
a relatively-homogeneous melt inclusion population (i.e., a population with 87Sr/86Sr variability
273
similar to that identified by TIMS). To test this hypothesis, we calculate the average 87Sr/86Sr and
274
2SD of the Pu'u Wahi melt inclusions analyzed by the LA-ICP-MS technique, and compare this
275
Figure 7. 87Sr/86Sr of Mauna Loa Pu'u Wahi melt inclusions by two different methods. (a) The 87Sr/86Sr of Pu'u
Wahi melt inclusions measured by LA-ICP-MS (Sobolev et al., 2011) and TIMS (Reinhard et al., 2018; this study) are compared to the 87Sr/86Sr range of Mauna Loa lavas (orange bar = 0.703599–0.703967; Hauri et al., 1996; Kurz et
al., 1995) and of the Pu'u Wahi glass (horizontal black line; Reinhard et al., 2018). The ultra-depleted melt (UDM) inclusions from Sobolev et al. (2011) are marked separately. Even when the UDM inclusions are excluded, the 2RSD in 87Sr/86Sr of the Pu'u Wahi melt inclusions determined by LA-ICP-MS greatly exceeds (by a factor of 13) the 2RSD
determined by TIMS. Panel (b) shows only the 87Sr/86Sr of Pu'u Wahi melt inclusions analyzed by TIMS compared to
the Pu'u Wahi matrix glass (horizontal black line with 2SE represented by the dashed lines) analyzed by Reinhard et al. (2018).
15
to the average 87Sr/86Sr and 2SD of the Pu'u Wahi melt inclusions analyzed by TIMS. The
276
average of Sobolev et al.’s (2011) 87Sr/86Sr measurements is 0.7040 ±0.0021 (2SD, N = 137)
277
(with the two UDM inclusions), or 0.7039 ±0.0019 (2SD, N = 135) (without the two UDM 278
inclusions). These average 87Sr/86Sr values are indistinguishable from the average 87Sr/86Sr
279
obtained on Pu'u Wahi melt inclusions at the Vrije University TIMS lab (0.703867 ±0.00013, 280
2SD, N = 9) and the average 87Sr/86Sr of melt inclusions from the UCSB TIMS lab reported here
281
(0.703873 ±0.000152, 2SD, N = 24), which are also indistinguishable from the Pu'u Wahi tephra 282
glass 87Sr/86Sr (0.703912±0.000008, 2SE) and the range in 87Sr/86Sr reported in Mauna Loa
283
whole rocks (0.70360 to 0.703967; Hauri et al., 1996; Kurz et al., 1995). This result is consistent 284
Figure 8. The red histogram displays the resulting model variability in 87Sr/86Sr if a relatively homogeneous
population (i.e., 87Sr/86Sr variability is approximately ±200 ppm, 2RSD) of melt inclusions, like that found
by the TIMS studies of Pu'u Wahi melt inclusions (Reinhard et al., 2018; this study), is modelled using a Monte Carlo method that assigns the melt inclusions larger uncertainties from the distribution of
measurement uncertainties associated with the Sobolev et al. (2011) ICP-MS analyses. The red histogram represents the 87Sr/86Sr of model melt inclusions resulting from 106 iterations of the Monte Carlo
simulation. The 87Sr/86Sr values of the Pu'u Wahi melt inclusions reported by Sobolev et al. (2011) are
shown as a blue histogram). In summary, larger measurement uncertainties associated with a relatively homogeneous population of melt inclusions can generate apparent heterogeneity that mimics the extreme
16 with the hypothesis that the disagreement between the TIMS 87Sr/86Sr analyses and the
LA-ICP-285
MS 87Sr/86Sr analyses are a result of the significantly larger errors associated with the Sobolev et
286
al. (2011) 87Sr/86Sr measurements.
287
In order to further test the influence of measurement reproducibility on the total observed
288
87Sr/86Sr variability in the Pu'u Wahi melt inclusion suite, we performed a Monte Carlo
289
simulation. This Monte Carlo simulation (Figure 8) evaluates the 87Sr/86Sr variability in Pu'u
290
Wahi melt inclusions that would result if a relatively homogeneous population of Pu'u Wahi 291
melt inclusions (like that found by the TIMS studies) is assigned the larger measurement 292
uncertainties associated with the Sobolev et al. (2011) single-collector ICP-MS method. In the 293
simulation, we first calculate an uncertainty equal to the average 2SD of the 135 Pu'u Wahi melt 294
inclusion measurements (i.e., including only the melt inclusions with at least one replicate 295
analysis) reported by Sobolev et al. (2011), which is ±2919 ppm. This is used to generate a 296
Gaussian distribution, which has a 2RSD of ±2919 ppm, and from this distribution values are 297
drawn randomly in each iteration of the model and then assigned as errors to each of the 33 Pu'u
298
Wahi melt inclusions analyzed by TIMS in this study and Reinhard et al. (2018). The range of
299
87Sr/86Sr in the 33 melt inclusions in the model is then calculated, and this process was then
300
repeated 106 times. This simulation yields a range in 87Sr/86Sr for each of a million different
301
model melt inclusion populations, giving a 95% confidence interval of ~8200 ppm for the ranges 302
in 87Sr/86Sr across all simulations. The 95% confidence interval in the range in 87Sr/86Sr for the
303
simulation approaches the ~8500 ppm range in 87Sr/86Sr reported in the suite of 135 melt
304
inclusions analyzed by Sobolev et al. (2011), and the comparison is shown in Figure 8. In 305
summary, if the larger measurement errors of Sobolev et al. (2011) data are applied to a 306
relatively homogeneous population of melt inclusions analyzed by TIMS, it is possible to 307
generate apparent 87Sr/86Sr variability that is comparable to the reported 87Sr/86Sr variability in
308
Sobolev et al. (2011). Thus, the large reported 87Sr/86Sr variability previously found in Pu'u Wahi
309
melt inclusions appears to be the result of larger uncertainties associated with the 87Sr/86Sr
310
analyses by ICP-MS. 311
We did not encounter any melt inclusions with the UDM trace element patterns identified 312
by Sobolev et al. (2011). Therefore, we acknowledge that these UDM melt inclusions could have 313
different 87Sr/86Sr compositions than the Pu'u Wahi inclusions that we examine here. However,
314
we note that the high 87Sr/86Sr values (~0.708) reported in the UDM inclusions are generated in
315
our Monte Carlo simulation, which can be seen in Figure 8 by the overlap of the model melt 316
inclusions in red with the Sobolev et al. (2011) melt inclusions in blue at ~0.708. Therefore, the 317
87Sr/86Sr data for Pu'u Wahi melt inclusions from Sobolev et al. (2011) are not included in Figure
318
6 or in the interpretation of Mauna Loa 87Sr/86Sr data, but we do show the Sobolev et al. (2011)
319
melt inclusions 87Sr/86Sr data in comparison to the TIMS data in Figure 7. Below we address
320
only the origin of the non-UDM inclusions with high (Sr/Ce)N identified by Sobolev et al. (2000,
321
2011), which were argued by Sobolev et al. (2000) to be sourced by ancient recycled gabbro. 322
4. Discussion
323
4.1 Processes that can influence melt inclusion compositions prior to, and following,
324
entrapment.
325
When working with melt inclusions, it is necessary to consider how the melts may have 326
been modified before and after entrapment. For example, following entrapment, melt inclusion 327
compositions can be affected by diffusive exchange, through the host crystal, with the 328
17 surrounding melt. Relative to Hawaiian lavas, and host glasses, the melt inclusions in this study 329
tend to have lower FeOt (Figure S4), which is indicative of diffusive Fe-Mg exchange between
330
the melt inclusion and the host melt. Fe-Mg diffusive exchange in melt inclusions is relatively 331
common, and has been attributed to slower cooling, as a longer residence time is required for Fe 332
to diffuse out of the host mineral (e.g., Danyushevsky et al., 2000; Gaetani & Watson, 2000; 333
Sobolev & Danyushevsky, 1994). However, Fe-Mg exchange does not influence trace element 334
ratios or the 87Sr/86Sr of the melt inclusion, therefore “Fe loss” does not affect the conclusions of
335
this study and we do not attempt to correct for it. 336
Additionally, melt inclusions experience post-entrapment crystallization during cooling, 337
and we correct for post-entrapment loss of olivine to the melt inclusion wall. All Hawaiian melt 338
inclusion major and trace element data shown in the figures have been fractionation corrected to 339
be in equilibrium with the forsterite (Fo) content of the host olivine by adding or subtracting 340
equilibrium olivine at 0.1% increments. For the calculation, we assume (i) an olivine-melt Fe-Mg 341
Kd of 0.30 (Ford et al., 1983; Kd = (Fe2+/Mg)olivine / (Fe2+/Mg)melt) and (ii) 10% of the total iron in
342
the melt is Fe3+ (following Hauri, 1996). Major, volatile, and trace element concentrations
343
corrected for olivine addition or subtraction are shown in Table S1, together with measured 344
concentrations. 345
Prior to entrapment, melts can assimilate altered oceanic crust. Chlorine is an indicator 346
for assimilation of seawater-derived materials, including altered oceanic crust. Thus, melts that 347
have assimilated seawater-derived materials can have elevated Cl, Cl/K2O, and Cl/Nb ratios
348
(Jambon et al., 1995; Kendrick et al., 2013a, 2015; Kent et al., 1999a, 1999b, 2002; Koleszar et 349
al., 2009; Lassiter et al., 2002; Michael & Cornell, 1998). Chlorine is fluid mobile (e.g., Debret 350
et al., 2014; John et al., 2011; Kendrick et al., 2013b; Rose-Koga et al., 2012; Straub & Layne, 351
2003), therefore recycled oceanic crust that has gone through a subduction filter is not predicted 352
to retain high Cl/K2O and Cl/Nb ratios (e.g., Kendrick et al., 2013a, 2015, 2017; Rowe &
353
Lassiter, 2009). Mantle-derived lavas have low Cl/Nb ratios relative to lavas influenced by 354
assimilation of altered oceanic crust (e.g., 5–17; Michael & Cornell, 1998; Rowe & Lassiter, 355
2009; Rowe et al., 2015; Saal et al., 2002; Stroncik & Haase, 2004). The Hawaiian melt 356
inclusions considered here generally have mantle-like Cl/Nb (ratios of 4 to 14, but inclusion 357
Puu7-2-7a has a higher ratio, 21), except for Loihi glasses (ratios of 34 to 65) and their melt 358
inclusions (ratios of 14 to 30), which confirms observations of elevated Cl and Cl/Nb in Loihi 359
glasses and melt inclusions (Kent et al., 1999a, 1999b). Critically for this study, the highest 360
(Sr/Ce)N melt inclusion has mantle-like Cl/Nb, so assimilation of shallow-level altered oceanic
361
crust is unlikely to be involved in its origin. However, the low Cl/Nb ratio of the high (Sr/Ce)N
362
inclusion does not exclude a contribution from the Cretaceous lower (gabbroic) oceanic crust 363
beneath Hawai'i (which may have mantle-like Cl/Nb, see Section 4.2), which is discussed below. 364
None of the high Cl/Nb inclusions (i.e., Loihi) have elevated (Sr/Ce)N.
365
4.2 Source of high (Sr/Ce)N “ghost plagioclase” in Mauna Loa melt inclusions: bulk
366
assimilation of gabbro?
367
This study presents the highest magmatic (Sr/Ce)N ratio in Hawaiian melts measured to
368
date, suggesting a role for a plagioclase-bearing lithology, such as cumulate gabbro, in the 369
petrogenesis of this, and similar, high (Sr/Ce)N inclusions from Hawai'i. However, the
370
mechanism for the incorporation of the high (Sr/Ce)N “ghost plagioclase” signature (i.e., elevated
371
(Sr/Ce)N without concomitant enrichment in Al2O3) remains controversial (Peterson et al., 2014;
372
Saal et al., 2007; Sobolev et al., 2000; Yaxley & Sobolev, 2007). 373
18 Gabbros from the deeper regions of Mauna Loa volcano may have mantle-like Cl/Nb, so 374
assimilation of such gabbros may not be detected with Cl/Nb. In order to test for direct gabbro 375
assimilation, we present a mixing model between the average “normal” Pu'u Wahi melt inclusion 376
composition (an average composition of Pu'u Wahi melt inclusions lacking anomalous major and 377
trace elements signatures, defined in Table S10) and the Mauna Loa gabbroic xenolith with the 378
highest (Sr/Ce)N—to minimize the quantity of gabbro needed to generate the elevated (Sr/Ce)N in
379
the melt inclusion—from Gaffney (2002; Figure 3). The highest (Sr/Ce)N melt inclusion (sample
380
ML-2012-27_19b) is offset from the normal melt inclusion-Mauna Loa gabbro mixing line to 381
lower Al2O3 at a given (Sr/Ce)N, and is therefore not well described by assimilation of this or any
382
other available Mauna Loa gabbro composition. Additionally, the mixing line in Figure 3a 383
informs the minimum amount of Mauna Loa gabbro assimilation (90%) required to generate the 384
high (Sr/Ce)N in this melt inclusion, given available gabbro compositions at Mauna Loa. This
385
high proportion of Mauna Loa gabbro is also inconsistent with the same mixing model in Al2O3
386
versus MgO space (Figure 3c): This is because 90% Mauna Loa gabbro assimilation by the 387
inclusion would cause it to plot off (toward higher Al2O3) of the array formed by Hawaiian lavas
388
in Al2O3 versus MgO space, but the high (Sr/Ce)N inclusion is not displaced from this array
389
(Figure 3c). 390
Assimilation of gabbro from the Cretaceous oceanic crust that underlies Hawai'i was also 391
tested using Gabal Gerf ophiolite gabbros (Zimmer et al., 1995), which serve as a proxy for 392
Cretaceous oceanic crust gabbro. However, there is no mixing model between normal-type Pu'u 393
Wahi melts and Gabal Gerf gabbros that can account for the ghost plagioclase inclusion (one 394
mixing line is shown, which trends to the highest (Sr/Ce)N Gabal Gerf composition, in Figure 3).
395
The mixing lines generate Al2O3 that is too high for the high (Sr/Ce)N inclusion in (Sr/Ce)N
396
versus Al2O3 and Al2O3 versus MgO space. Thus, we can exclude bulk assimilation of gabbro in
397
the genesis of the high (Sr/Ce)N melt inclusion. This observation is central to the paradox of the
398
“ghost plagioclase” signature, where trace element signatures (i.e, high (Sr/Ce)N) indicate
399
gabbroic influence, whereas major elements (i.e., Al2O3) are inconsistent with direct assimilation
400
of gabbro. While we can exclude direct assimilation of gabbro, these mixing models do not 401
address the two remaining hypotheses for the origin of high (Sr/Ce)N signatures at hotspots—
402
ancient recycled gabbro or diffusive interaction between Hawaiian melts and Mauna Loa 403
gabbros—which we test with Sr isotopes below. 404
405
4.3 Source of high (Sr/Ce)N “ghost plagioclase” in Mauna Loa melt inclusions: diffusive
406
exchange between upwelling melts and shallow gabbro?
407 408
Examining lavas and melt inclusions from the Galapagos that exhibit the trace element 409
signature commonly associated with plagioclase, Saal et al. (2007) and Peterson et al. (2014) 410
argue against the presence of ancient recycled oceanic gabbro in the mantle source. Instead, they 411
proposed that diffusive exchange between mantle-derived melts and gabbros in the deep volcanic 412
sections of Galapagos volcanoes generate the measured, plagioclase-related (i.e., high (Sr/Ce)N)
413
trace element signatures. In addition to melts with plagioclase-influenced compositions, 414
Galapagos olivine-hosted melt inclusions from Fernandina exhibit the ghost plagioclase 415
signature. Peterson et al. (2014) examined the range of trace element and Pb isotopic 416
compositions that could be generated from both melting an ancient recycled oceanic gabbro in 417
the deep mantle and from diffusive interaction in the shallow crust. Peterson et al. (2014) 418
demonstrated that the recycled oceanic gabbro model cannot reproduce the trace element 419
19 signature and the Pb isotope compositions of the ghost plagioclase inclusions simultaneously. 420
However, the diffusive exchange model generates both the trace element and Pb isotope 421
compositions of the high (Sr/Ce)N inclusions with the ghost plagioclase signature.
422
Therefore, instead of reflecting a source signature related to recycled gabbro 423
heterogeneities embedded in the plume, as advocated by Sobolev et al. (2000) for Hawai'i, the 424
model for the generation of ghost plagioclase signatures proposed by Saal et al. (2007) and 425
Peterson et al. (2014) suggests that it is a shallow process, where diffusive interaction between 426
plagioclase in lithospheric gabbros and upwelling hotspot melts results in the hotspot melts 427
inheriting high (Sr/Ce)N signatures. In this diffusive exchange model, Sr diffuses through the
428
crustal plagioclase toward the upwelling plume melt because it has a higher diffusivity in 429
plagioclase relative to other trace elements, such as La and Nd. In this way, a large positive Sr 430
anomaly can be inherited by the upwelling plume melt due to diffusive interaction with the 431
plagioclase, thereby generating the ghost plagioclase composition. 432
We apply the Peterson et al. (2014) “diffusive exchange” approach used in the Galapagos 433
to evaluate whether melt-gabbro diffusive interaction can generate the elevated (Sr/Ce)N
434
signatures in Mauna Loa inclusions. The model parameters follow Peterson et al. (2014), except 435
that a Mauna Loa lava (sample J2-15-13, with a relatively high Sr content of 689 ppm; Wanless 436
et al., 2006) is used instead of the high-Sr concentration Galapagos melt used in Peterson et al. 437
(2014), and we track the influence of the diffusive exchange model on 87Sr/86Sr instead of Pb
438
isotopes. (An incompatible element rich melt, like J2-15-13 used here, may have been more 439
common during the pre-shield alkali volcanism at Mauna Loa.) A plagioclase trace element 440
composition is calculated that is in equilibrium with Mauna Loa lava J2-15-13 using a 441
plagioclase An80 composition at 1200 °C and plagioclase-melt partition coefficients from Bédard
442
(2006). Hawaiian melt inclusions with ghost plagioclase signatures (similar to Galapagos melt 443
inclusions with ghost plagioclase signatures) are depleted in incompatible trace elements, except 444
those associated with plagioclase, which is reflected in the low (La/Sm)N of the ghost plagioclase
445
inclusions. Because of this depleted nature, we use a 12% aggregated fractional melt of 446
Workman and Hart’s (2005) depleted MORB mantle (DMM) as the percolating melt that 447
diffusively exchanges with the plagioclase-rich lithology. The average of East Pacific Rise ridge 448
segments from Gale et al. (2013) is used for the initial 87Sr/86Sr composition of the percolating
449
melt. This percolating melt undergoes diffusive exchange with a troctolite (for simplicity) 450
hosting 50% modal plagioclase with the modeled trace element composition, where diffusive 451
exchange uses published trace element diffusivities (Cherniak, 1995, 2002, 2003; Cherniak & 452
Watson, 1994; Giletti & Casserly, 1994; Giletti & Shanahan, 1997) at 1200°C (see Table 2 for 453
diffusivities used). Hawaiian lava temperatures approach 1200°C (Gansecki et al., 2019), making 454
this an appropriate temperature for model calculation. The duration of diffusive interaction varies 455
from 1 year to 400 years in our model, as plagioclase trace element signatures are inherited by 456
the percolating melt as a function of time (Table 2). Because Sr has a higher diffusivity than Ce 457
and Al in plagioclase, the percolating DMM melt can inherit high (Sr/Ce)N, but not elevated
458
Al2O3, thereby providing an explanation for the ghost plagioclase signature without invoking
459
direct gabbro assimilation (Danyushevsky et al., 2003) or ancient recycled gabbro (Sobolev et al. 460
2000). Depletion in light REEs relative to middle REEs is an outcome of the diffusive exchange 461
model, where lower (La/Sm)N are generated as higher (Sr/Ce)N are produced (Figure 4). Finally,
462
we mix the diffusively modified melts with the host glass associated with the highest (Sr/Ce)N
463
inclusion, sample ML-2012-27 (though mixing with average Pu'u Wahi normal-type melt 464
inclusions would not change the result), and then compare the mixtures to measured Hawaiian 465
20 melt inclusion compositions. Following 1 to 5 years of diffusive exchange (i.e., timescales that 466
are well within crystal residence times in Hawaiian magmas; e.g., Cooper et al., 2001; Vinet & 467
Higgins, 2010; Wieser et al., 2019), the (La/Sm)N, (Sr/Ce)N, and 87Sr/86Sr composition of the
468
highest Mauna Loa (Sr/Ce)N inclusion is matched in the diffusive exchange model.
469
This model requires the presence of Mauna Loa gabbros deep in the volcanic pile of the 470
volcano. Gaffney (2002) examined a suite of Mauna Loa gabbros (crystallized from Mauna Loa 471
magmas), which provide evidence of cumulus plagioclase in the deep stratigraphy of the 472
volcano. Although gabbroic xenoliths from Mauna Loa are uncommon, the lava pile is many 473
kilometers thick, and only a fraction of the lava pile has been sampled directly. Therefore, 474
gabbro could be more abundant in the deep shield than is suggested by the low abundance of 475
gabbroic xenoliths that have been transported to the surface. 476
The diffusive exchange model for the high (Sr/Ce)N melt inclusions relies on the fact that
477
the percolating melt is depleted, and this may seem unexpected for a hotspot volcano far from a 478
MOR. Nonetheless, depleted components have been suggested to exist in the Hawaiian plume 479
(e.g., Garcia et al., 2010; Harrison et al., 2020). Garcia et al. (2010) hypothesize that an ancient 480
depleted upper mantle component exists in the Hawaiian plume, that could potentially supply the 481
depleted percolating melt that interacts with the Mauna Loa gabbro in our model. Additionally, 482
Mukhopadhyay et al. (2003) state that they “favor an asthenospheric origin for the DM 483
component” in Hawai'i, and that “the DM component is most apparent in lavas from the Kauai 484
shield and is present in varying proportion in other Hawaiian shield volcanoes,” including Mauna 485
Loa (which has ~20% of the DM component in Figure 14 of Mukhopadhyay et al., 2003). As 486
21 such, evidence exists that supports the existence of a depleted component in the Hawaiian plume 487
that sources shield stage lavas, consistent with our model. While the precise origin of the 488
depleted component is unknown, we use the composition of the Workman and Hart (2005) 489
depleted mantle component to approximate its trace element composition. 490
The results of the melt-plagioclase diffusive exchange model are compared with the 491
Hawaiian melt inclusion data in Figures 4 and 6, and the model encompasses both the 87Sr/86Sr
492
composition and the unusual trace element composition—high (Sr/Ce)N and low (La/Sm)N—of
493
the Mauna Loa ghost plagioclase inclusion examined here. While diffusive exchange with a 494
Mauna Loa cumulate gabbro is consistent with the high (Sr/Ce)N inclusion data presented here,
495
the Mauna Loa-like 87Sr/86Sr in the high (Sr/Ce)N inclusion is inconsistent with diffusive
496
exchange between upwelling melts and MOR-basement gabbro. Diffusive exchange between 497
melts and MOR-basement gabbro in the Pacific lithosphere would predict low, MORB-like 498
87Sr/86Sr in the melt inclusion. This is because the model predicts that the percolating melt will
499
rapidly (>5 years; Figure 6) become dominated by the 87Sr/86Sr of the gabbro, and the average
500
xenoliths from Hualalai sampling MOR-basement gabbros indicate that the Cretaceous oceanic 501
crustal gabbros beneath Hawai'i have 87Sr/86Sr (0.702733 ± 0.000392 (2SD); Gao et al., 2016)
502
that is indistinguishable from East Pacific Rise MORB (0.70257 ± 0.00024; Gale et al., 2013) 503
due to relatively little modification by seawater. Furthermore, the low Cl/K (<0.01) in the highest 504
(Sr/Ce)N inclusion rules out interaction with seawater-altered MOR gabbro with higher
505
(secondary) 87Sr/86Sr, because such a model would predict a high Cl/K ratio in the melt
506
inclusion. Incidentally, Peterson et al. (2014) exclude diffusive melt exchange with MORB-507
related gabbros in the Galapagos because this would generate a negative Sr anomaly, due to 508
lower Sr concentrations in oceanic gabbros than melts from oceanic hotspot volcanoes, a result 509
that is directly applicable to the Hawaiian case examined here. Thus, we can rule out Cretaceous 510
oceanic crustal gabbro as the origin of the ghost plagioclase signature. 511
An important remaining question is to explore whether the 87Sr/86Sr we measured in the
512
Mauna Loa inclusion with the ghost plagioclase signature is consistent with the recycled gabbro 513
model proposed by Sobolev et al. (2000). We explore this question below. 514
4.4 Using Sr isotopes to test models for the origin of the ghost plagioclase signature in
515
Mauna Loa inclusions.
516
The primary result of this study is that the Mauna Loa melt inclusion with high (Sr/Ce)N
517
is indistinguishable in 87Sr/86Sr from other melt inclusions from the same lava (sample
ML-2012-518
27; Figure 6). This melt inclusion also has 87Sr/86Sr that falls within the range of 87Sr/86Sr
519
identified in Mauna Loa lavas. We explore the implications of this observation below. 520
While a recycled gabbro signature may be present in the mantle for most Loa-trend 521
volcanoes, including Mauna Loa (Frey et al., 2016), recycled gabbro is unlikely to have 522
contributed the high (Sr/Ce)N signature to the high (Sr/Ce)N Mauna Loa inclusion examined here.
523
If high (Sr/Ce)N is a measure of magnitude of the contribution of the recycled gabbro component,
524
as proposed by Sobolev et al. (2000), this raises the question as to why the highest (Sr/Ce)N melt
525
inclusion has the same 87Sr/86Sr as the Mauna Loa melt inclusions and lavas with normal
526
(Sr/Ce)N. In their model, the recycled gabbro contributes approximately 73 to 79% of the total Sr
527
budget in ghost plagioclase melts, which is much larger than gabbro contributions suggested for 528
Hawaiian lavas. Therefore, if an excess contribution from recycled gabbro were responsible for 529
the high (Sr/Ce)N signature in the unusual, high (Sr/Ce)N Mauna Loa melt inclusion examined
530
here, then the high (Sr/Ce)N melt inclusions should have 87Sr/86Sr that is shifted closer to the
22
87Sr/86Sr of the recycled gabbro compositions than the Mauna Loa melt inclusions with normal
532
(Sr/Ce)N. This is not observed: The high (Sr/Ce)N melt inclusion and inclusions with normal
533
(Sr/Ce)N have indistinguishable 87Sr/86Sr. If one appeals to coincidence, and assumes that the
534
recycled gabbro has evolved to have exactly the same 87Sr/86Sr composition as the other
535
component(s) sampled by the Mauna Loa inclusions with normal (Sr/Ce)N, then one can explain
536
why high (Sr/Ce)N and normal (Sr/Ce)N inclusions from Mauna Loa have the same 87Sr/86Sr.
537
However, we do not accept such a coincidence as plausible, for two reasons. First, possible 538
compositions of the ancient recycled gabbro protolith are highly variable—including, but not 539
limited to, gabbro from recycled seamounts, large igneous provinces, or oceanic lithosphere 540
(depleted-MORB, normal-MORB, or enriched-MORB)—and thus will run the gamut of Sr-541
isotopic compositions, making it unlikely that ancient recycled gabbro would coincidently evolve 542
to have 87Sr/86Sr like Mauna Loa lavas that lack the ghost plagioclase inclusions. Second,
543
variable dehydration and melting processes operating on heterogeneous protoliths at different 544
times in distinct subduction zones, followed by varying periods of storage in the mantle and 545
admixture with diverse reservoirs, are unlikely to generate different components—a high 546
(Sr/Ce)N recycled gabbro component and low (Sr/Ce)N components—in the plume with
547
indistinguishable 87Sr/86Sr. In short, an ancient recycled gabbro component is unlikely to be
548
responsible for the high (Sr/Ce)N “ghost plagioclase” melt inclusions.
549
A more straightforward explanation for the identical 87Sr/86Sr in the high (Sr/Ce)N melt
550
inclusions and “normal” (Sr/Ce)N inclusions in Mauna Loa is that the former inherited the high
551
(Sr/Ce)N signature by interacting with Mauna Loa gabbros. Gabbros related to construction of
552
the hotspot volcano will have 87Sr/86Sr ratios that are similar to Mauna Loa lavas, normal-type
553
inclusions, and the ghost plagioclase inclusion in this study. The diffusive exchange model 554
generates the high (Sr/Ce)N in ghost plagioclase melt inclusions—indicative of plagioclase-melt
555
interaction—and is also consistent with the relationships between (Sr/Ce)N and 87Sr/86Sr (Figures
556
4 and 6). This result, which employs Sr isotopic constraints on the origin of ghost plagioclase 557
melt inclusions, mirrors the findings of Peterson et al. (2014), who also showed that the Pb 558
isotopic compositions in Galapagos ghost plagioclase melt inclusions are inconsistent with an 559
ancient recycled oceanic gabbro origin. 560
5. Conclusion
561
This study uses Sr isotopic measurements in individual melt inclusions to evaluate the 562
origin of the ghost plagioclase signature—elevated (Sr/Ce)N, but similar Al2O3, as melt
563
inclusions with (Sr/Ce)N<2—in Mauna Loa melt inclusions. The 87Sr/86Sr of the highest (Sr/Ce)N
564
melt inclusion ((Sr/Ce)N =7.2) matches the 87Sr/86Sr in lower (Sr/Ce)N melt inclusions ((Sr/Ce)N
565
< 2) from the same lava, and is also indistinguishable from 87Sr/86Sr in Mauna Loa lavas.
566
Because the highest (Sr/Ce)N melt inclusion is isotopically indistinguishable from Mauna Loa
567
melts with small Sr anomalies, the source of the high (Sr/Ce)N melt inclusions should have the
568
same 87Sr/86Sr as the component that generates other Mauna Loa lavas with smaller (Sr/Ce) N
569
ratios. According to Sobolev et al. (2000), the 87Sr/86Sr of the recycled gabbro will dominate the
570
87Sr/86Sr signature in ghost plagioclase melt inclusions because the recycled gabbro contributes
571
to the majority of the total Sr budget in ghost plagioclase melts. While we cannot rule out 572
recycled gabbro as the source of the ghost plagioclase signature, it would be a great coincidence 573
that any recycled gabbro component in the Hawaiian mantle plume melting beneath Mauna Loa 574
would have the same 87Sr/86Sr as the source of other Mauna Loa lavas that lack a recycled
575
gabbro signature. Therefore, the observation that the 87Sr/86Sr of the highest (Sr/Ce)N inclusion