HAL Id: hal-01928118
https://hal.archives-ouvertes.fr/hal-01928118
Submitted on 22 Nov 2018HAL is a multi-disciplinary open access archive for the deposit and dissemination of sci-entific research documents, whether they are pub-lished or not. The documents may come from teaching and research institutions in France or abroad, or from public or private research centers.
L’archive ouverte pluridisciplinaire HAL, est destinée au dépôt et à la diffusion de documents scientifiques de niveau recherche, publiés ou non, émanant des établissements d’enseignement et de recherche français ou étrangers, des laboratoires publics ou privés.
Isolation drives taxonomic and functional nestedness in
tropical reef fish faunas
Mariana G. Bender, Fabien Leprieur, David Mouillot, Michel Kulbicki,
Valeriano Parravicini, Marcio R. Pie, Diego R. Barneche, Luiz Gustavo R.
Oliveira-Santos, Sergio R. Floeter
To cite this version:
Mariana G. Bender, Fabien Leprieur, David Mouillot, Michel Kulbicki, Valeriano Parravicini, et al.. Isolation drives taxonomic and functional nestedness in tropical reef fish faunas. Ecography, Wiley, 2017, 40 (3), pp.425–435. �10.1111/ecog.02293�. �hal-01928118�
preserving within the context of the escalating threats to global ecosystems (Naeem et al. 2012). Indeed, functional diversity (FD), i.e. the diversity of ecological functions within a species assemblage, sustains ecosystem processes such as productivity, nutrient cycling and response to distur-bances (Mouillot et al. 2011, Cardinale et al. 2012, Naeem et al. 2012). Functional redundancy, the number of species performing the same set of functions (Lawton and Brown 1994, Naeem 1998), is thus key to ensure long-term eco-system functioning as well as the resilience of ecological processes since it buffers the loss of functions against the loss of species (Hooper et al. 2002, Bellwood et al. 2004).
The level of functional redundancy has been investigated within reef fish assemblages (Guillemot et al. 2011, Mouillot et al. 2014, Parravicini et al. 2014) but the level of spatial insurance among assemblages, i.e. the extent to which differ-ent assemblages host species supporting the same functional roles, is still unknown at large scales and in the marine realm
Ecography 40: 425–435, 2017
doi: 10.1111/ecog.02293 © 2016 The Authors. Ecography © 2016 Nordic Society Oikos Subject Editor: Andres Baselga. Editor-in-Chief: Miguel Araújo. Accepted 8 February 2016
Under a nested pattern, species assemblages with lower spe-cies richness represent proper subsets of the spespe-cies com-position that occurs in richer assemblages (Patterson and Atmar 1986, Almeida-Neto et al. 2008, Almeida-Neto and Ulrich 2011). A variety of processes, deterministic or stochastic, have been proposed to cause nested patterns of species assemblages (Ulrich et al. 2009). These processes include differential colonization and extinction driven by species-specific traits, such as dispersal ability (Patterson and Atmar 1986, 2000, Srinivasan et al. 2014) and habi-tat heterogeneity or quality associated with species varying in their degree of specialization (Wright and Reeves 1992). The level of nestedness regulates the extent to which large areas contain the diversity of species hosted in smaller areas and has implications in conservation science (Patterson and Atmar 1986, 2000, Ulrich et al. 2009).
Beyond the number of species, the breadth of functions performed by species is a biodiversity facet that is worth
Isolation drives taxonomic and functional nestedness in tropical reef
fish faunas
Mariana G. Bender, Fabien Leprieur, David Mouillot, Michel Kulbicki, Valeriano Parravicini, Marcio R. Pie, Diego R. Barneche, Luiz Gustavo R. Oliveira-Santos and Sergio R. Floeter
M. G. Bender (marianabender.bio@gmail.com), Programa de Pós-graduação em Ecologia e Conservação, Univ. Federal do Paraná, Brazil. – L. G. R. Oliveira-Santos, S. R. Floeter and MGB, Univ. Federal de Santa Catarina, Laboratório de Biogeografia e Macroecologia Marinha, Florianópolis – SC, 88010-970, Brazil. LGRO-S also at: Univ. Federal do Rio de Janeiro, Inst. de Biologia, Lab. Ecologia e Conservação de Populações, Ilha do Fundão, Rio de Janeiro – RJ, 21941-375, Brazil. – F. Leprieur, D. Mouillot and MGB, UMR MARBEC 9190, Univ. de Montpellier, Place Eugene Bataillon, Montpellier, FR-34095, France. DM also at: ARC Centre of Excellence for Coral Reef Studies, James Cook Univ., Townsville, QLD 4811, Australia. – M. Kulbicki and V. Parravicini, IRD, Inst. de Recherche pour le Développement, URM Entropie, LABEX Corail, Univ. de Perpignan, FR-66000 Perpignan, France. VP also at: CESAB-FRB, Immeuble Henri Poincaré, Domaine du Petit Arbois, FR-13857 Aix-en-Provence, Cedex 3, France. – M. R. Pie, Univ. Federal do Paraná, Depto de Zoologia, C.P. 19020, Curitiba – PR, 81531, Brazil. – D. R. Barneche, Centre for Geometric Biology, School of Biological Sciences, Monash Univ., Clayton, VIC 3800, Australia.
Taxonomic nestedness, the degree to which the taxonomic composition of species-poor assemblages represents a subset of richer sites, commonly occurs in habitat fragments and islands differing in size and isolation from a source pool. However, species are not ecologically equivalent and the extent to which nestedness is observed in terms of functional trait composi-tion of assemblages still remains poorly known. Here, using an extensive database on the funccomposi-tional traits and the distribu-tions of 6316 tropical reef fish species across 169 sites, we assessed the levels of taxonomical vs functional nestedness of reef fish assemblages at the global scale. Functional nestedness was considerably more common than taxonomic nestedness, and generally associated with geographical isolation, where nested subsets are gradually more isolated from surrounding reef areas and from the center of biodiversity. Because a nested pattern in functional composition implies that certain combina-tions of traits may be represented by few species, we identified these groups of low redundancy that include large herbivore-detritivores and omnivores, small piscivores, and macro-algal herbivores. The identified patterns of nestedness may be an outcome of the interaction between species dispersal capabilities, resource requirements, and gradients of isolation among habitats. The importance of isolation in generating the observed pattern of functional nestedness within biogeographic regions may indicate that disturbance in depauperate and isolated sites can have disproportionate effects on the functional structure of their reef fish assemblages.
(but see Parravicini et al. 2014). Functional nestedness can reveal the degree to which the functions present in a species-poor site are also present (and nested) in a species-rich site, and whether there is a core set of functions in species assem-blages across a diversity gradient. When nestedness analysis takes into account species richness, it may reveal not only the functional composition but also patterns of functional redundancy in species assemblages. Thus, we define func-tional nestedness as the degree to which the set of functions present in a species-poor site are also present in richer sites, and represented by a greater number of species, revealing a gradient in functional redundancy (Fig. 1). Given the poten-tial erosion of FD following the loss of species (Flynn et al. 2009, Mouillot et al. 2013a), the level of functional nest-edness among assemblages, and its underlying patterns and processes, need further investigation.
Taxonomic nestedness tends to emerge in archipelagos or habitat patches through a combination of differences in island (or patch) sizes and degrees of isolation from a source pool (Lomolino 1996, 1999). However, we still lack predictions about the influence of such biogeographic factors on functional nestedness among assemblages. The identification of associations between nestedness and habi-tat variables (e.g. area, isolation, habihabi-tat type) can offer relevant perspectives on the interaction between traits and the environment, which in turn are important to conser-vation strategies and management efforts (Fleishman et al. 2002, Semmens et al. 2010, Novak et al. 2011, Wang et al. 2013). Here, we estimated the degree of nestedness among reef fish assemblages across the world’s tropical oceans to assess whether the taxonomic and functional compositions of depauperate assemblages represent subsets of richer ones.
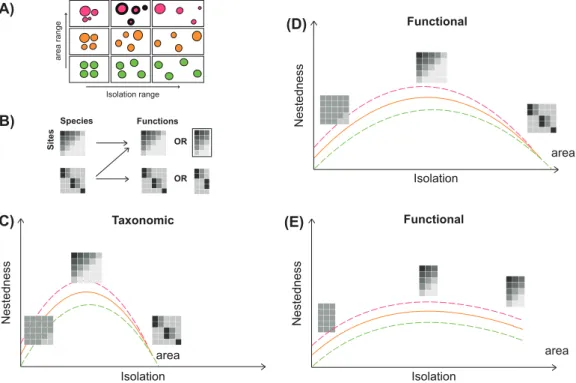
We hypothesize that the degree of nestedness among reef fish assemblages is determined by biogeographical gradi-ents of reef area and isolation (Fig. 2). The highest degree
of nestedness is expected under large differences in area and an intermediate level of isolation among sites (Fig. 2A) since differences in area and isolation generate gradients in species richness (MacArthur and Wilson 1967, Patterson and Atmar 1986, Almeida-Neto and Ulrich 2011). For taxonomic nestedness, a low gradient of isolation among sites should generate non-nested homogeneous patterns, regardless of the range in area, since high connectivity among sites should maintain similarity among assemblages (Azeria 2004). At an intermediate isolation gradient we expect a more pronounced nested pattern for larger areas, since differences in area among sites would favour species richness gradients, and poor sites would be subsets of rich sites (Patterson and Atmar 1986, Almeida-Neto and Ulrich 2011). At the other extreme, a strong isolation gradient would shape a non-nested subset pattern of species com-position regardless of the gradient in area (Fig. 2C) because isolated reef sites would tend to have dissimilar species com-positions due to high speciation and extinction rates (Budd and Pandolfi 2010). For functional nestedness, these effects are predicted under a wider gradient of isolation, given that functional groups (FGs), i.e. unique combinations of spe-cies functional traits, may be represented by different spespe-cies along biogeographical gradients. Two alternative hypotheses can thus be made about the effects of area and isolation on the functional nestedness of assemblages. First, functional nestedness patterns may follow those of taxonomic nested-ness where species tend to occupy different FGs. In this case taxonomic nestedness would imply functional nestedness (Fig. 2D). However, several species could disproportion-ally accumulate into a small number of highly redundant FGs (Fig. 2B). In that case, functional nestedness may occur at both intermediate and high degrees of isolation. This is expected since taxonomic dissimilarity among sites does not necessarily imply functional dissimilarity even under high degrees of isolation (Fig. 2E).
Functional Entities (FE)
(A)
Functional Entities (FE)
Sites
Site 1 Site 2 Site 3 Site 4 Site 5
Sites
(B)
Redundancy
Functional Core
+
Figure 1. An example illustrating functional nestedness, the core set of functional groups (FG)s in species assemblages and its relationship with functional redundancy. In (A), the network represents the occurrence (grey line) of FG across five sites. There are five FGs, each rep-resented by a different colour. Species within each one of these groups are shown in different fish symbols, and there is a greater redundancy in FGs, decreasing from left to right. The functional composition of site 5 is nested (red FG) within site 4 (red, blue and green FGs), and so on. Functional nestedness can also be represented by a matrix (B) in which FGs are placed in columns, and sites, in rows. The colour gradient, from dark to light tones, shows decreasing species richness/decreasing redundancy of each FG. Those FGs that occur across all sites represent the functional core of species assemblages.
Specifically, we aim to investigate whether 1) reef fish assemblages are functionally or taxonomically nested across scales; 2) functional nestedness is driven by family-level tax-onomic nestedness; 3) the degrees of nestedness are corre-lated with biogeographical factors, habitat area and isolation across two different spatial scales: biogeographic regions and provinces.
Methods
The database
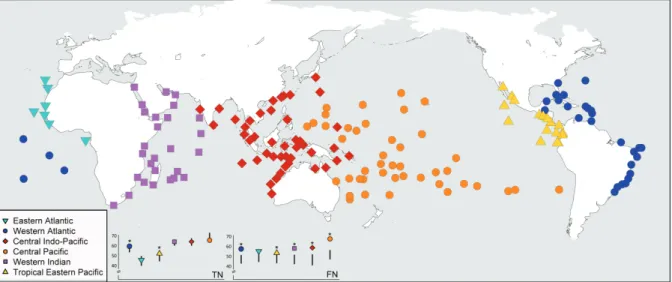
Our database comprises estimates species richness of reef fishes at 169 sites distributed across six marine biogeographic regions (Kulbicki et al. 2013) (Fig. 3). Employing a cut-off at 17°C of minimum sea surface temperature, we limited our study to tropical reefs including both coral and rocky forma-tions (Parravicini et al. 2013). In addition to reef fish species distributions, we compiled information detailing biological attributes for reef fish species, as well as environmental and geographic data for each site (Kulbicki et al. 2013, Parravicini et al. 2013).
Fish functional groups
Here, we refer to species ‘functional traits’ as those features that define ecological functions or the functional group the species pertains to. These traits have been previously applied in the reef fish ecology (Halpern and Floeter 2008, Guillemot et al. 2011, Stuart-Smith et al. 2013, Mouillot et al. 2014, Parravicini et al. 2014). We are aware of the extensive litera-ture and debate on the use of such terminology (Díaz and Cabido 2001, Lavorel and Garnier 2002, Violle et al. 2007) and of the use of ‘trait’ to define functions of organisms measured at the individual level (McGill et al. 2006, Violle et al. 2007). Nevertheless, the functional traits considered are appropriate for the large spatial scale of our study and the high number of species. Moreover, these traits define the main aspects of fish ecology (Guillemot et al. 2011).
Reef fish species were classified into one of the maximum body size categories: 0–7 cm, 7.1–15 cm, 15.1–30 cm, 30.1– 50 cm, 50.1–80 cm and 80 cm. Species were also classified according to their diet based on the main items consumed by each species, which led to the following categories: herbivore-detritivores (i.e. fish feeding on turf or filamentous algae and/or undefined organic material), macro-algal herbivores
Nestedness area Nestedness Functional Taxonomic area Isolation Isolation Isolation range area range (A) (C) (D) Species Sites Functions (B) Nestedness area Functional Isolation (E) OR OR
Figure 2. The expected trend of taxonomic and functional nestedness among sites along gradients of area and isolation. (A) Diagram show-ing nine configurations mixshow-ing gradients of area and isolation for a set of the four sites. Circle sizes are proportional to site areas while the spread among circles depicts isolation. The highest degree of nestedness is expected under a large gradient of areas and an intermediate degree of isolation (filled circles). (B) The transition from the taxonomic to the functional structure of assemblages. Taxonomic nestedness can generate functional nestedness when each species represents a different functional group (FG) or when several species accumulate into one FG (functional redundancy, highlighted box) (top). A dissimilar taxonomic composition among assemblages can generate either func-tional nestedness or funcfunc-tional dissimilarity among assemblages. (C) For taxonomic nestedness, a low gradient of isolation among sites tends to generate non-nested homogeneous patterns (left matrix) regardless the area gradient. Intermediate isolation among sites might cause a nested pattern (central matrix) that should be more pronounced for larger area gradients. In contrast, more isolated sites should exhibit non-nested taxonomic patterns whatever the area gradient. Dashed lines denote the effects of area gradients – increase and decrease – in nestedness. (D) For functional nestedness, these effects are predicted under a wider gradient of isolation, given that functional groups may be represented by different species along biogeographical gradients. (E) Under this scenario, species are concentrated into a smaller number of FGs, and functional nestedness occurs at both an intermediate and high degree of isolation. This is expected because the taxo-nomic turnover does not necessarily result in functional turnover under high degrees of isolation.
Fish taxonomic groups
The taxonomic units considered in our analysis were reef fish families. The use of this taxonomic level is appropriate because it enables comparisons among reef fish assemblages across large biogeographic regions, since families tend to be more conservative (i.e. similar) across such regions when compared to reef fish genera for instance (Bellwood and Wainwright 2002, Floeter et al. 2008). The reef fish families considered herein comprise those referred to by Bellwood and Wainwright (2002) and Floeter et al. (2008), includ-ing the typical reef fish families Acanthuridae, Apogonidae, Blennidae, Carangidae, Chaetodontidae, Holocentridae, Labridae, Mullidae, Pomacentridae and Scaridae (Bellwood 1996), as well as other typical reef taxa that occur in cer-tain areas (Chaenopsidae, Labrisomidae, Siganidae, etc.). We counted the number of species in a given family occur-ring across all sites of provinces and biogeographic regions as defined by Kulbicki et al. (2013). The data were organized in quantitative matrices where rows denoted families and col-umns represented sites. Therefore each cell was filled with the number of species in a given family (rows) for a given site (columns). In our analysis, described below, we computed the family-level taxonomic nestedness, which we refer to simply as taxonomic nestedness throughout the manuscript. Site attributes
For each site, we defined, according to maps and descrip-tions in the original publicadescrip-tions, the area to which the site’s species list pertains, thereby allowing the computation of environmental variables around each site (Parravicini et al. 2013). All information was converted to a global equal-area Behrmann projection before analyses. In studies of nest-edness, isolation has been traditionally quantified as the distance from a source pool; yet it is important to consider the influence of connectivity among sites, which can also (i.e. fish eating large fleshy algae and/or seagrass),
inverti-vores targeting sessile invertebrates (i.e. corals, sponges, ascidians), invertivores targeting mobile invertebrates (i.e. benthic species such as crustaceans), planktivores (i.e. fish eating small organisms in the water column), piscivores (including fish and cephalopods) and omnivores, i.e. fish for which both vegetal and animal material are important in their diet.
The functional group of each reef fish species was described as a combination of maximum body size and diet categories. Such combinations of attributes have been previ-ously employed to describe FGs of reef fish species (Halpern and Floeter 2008, Mouillot et al. 2013a). Fish species body size, for instance, is a proxy to other related features, includ-ing species geographic range size and pelagic larval duration (Luiz et al. 2012, 2013), reproductive output and growth rate (Munday and Jones 1998, Wong et al. 2007). Species trophic level is determined by the type and variety of food items consumed, which can provide information on spe-cific habitat requirements (Berumen and Pratchett 2008, Burkepile and Hay 2008), dependence on other trophic lev-els and home range (see Supplementary material Appendix 1 for a complete justification of the chosen functional traits). We counted the number of species in each FG across all sites contained in provinces and biogeographic regions. Data was arranged into matrices with FGs as rows and sites as columns.
We also employed two additional functional group schemes (Mouillot et al. 2014) to assess the sensitivity of nestedness to more refined trait combinations, combining species body size, diet, home range and schooling behav-ior. These analyses revealed significant and greater than expected nested patterns for the functional composition of assemblages across all biogeographic regions (Supplementary material Appendix 2).
Figure 3. Map of 169 sites that correspond to reef fish assemblages distributed across six biogeographic regions. From left to right: Eastern Atlantic (light-blue inverted triangles), Western Indian (purple squares), Central Indo-Pacific (red diamonds), Central Pacific (orange cir-cles), Tropical Eastern Pacific (yellow triangles), Western Atlantic (blue circles). Taxonomic nestedness (TN) and functional nestedness (FN) values for reef fish assemblages of each region are shown in graphs in the bottom. *Significantly nested structures. For a map of provinces embedded in regions see Supplementary material Appendix 3.
2011). Quantitative data may contain more accurate and complex information on the possible mechanisms under-pinning community structure (Ulrich and Gotelli 2010). Moreover, only through the use of quantitative data it is possible to link functional nestedness patterns to functional redundancy across reef sites. Here, the concept of functional redundancy takes into account functional groups built from the combination of categorical traits, which are appropri-ate to highlight differences in the functional structure of assemblages at large spatial scales and encompassing a large number of species (Stuart-Smith et al. 2013, Mouillot et al. 2014, Parravicini et al. 2014). Despite some of these studies have demonstrated functional vulnerability (low functional redundancy) of some reef fish communities (Mouillot et al. 2014, Parravicini et al. 2014), other studies considering dif-ferent aspects of species’ diet and behavior have also shown low functional redundancy in local communities (Bellwood et al. 2003, Fox and Bellwood 2013, Streit et al. 2015).
In order to estimate the nestedness degree of the taxo-nomic and functional structures of reef fish assemblages, we used the weighted nestedness metric based on overlap and decreasing fill (WNODF) (Almeida-Neto and Ulrich 2011), the quantitative version of NODF (Almeida-Neto et al. 2008). Under this metric, nestedness can be quantified for the whole matrix, as well as the nestedness of species and sites, i.e. rows and columns. A WNODF nestedness score ranges from 0 (non-nested) to 100 (perfectly nested).
To assess the probability that functional and taxonomic nestedness could be obtained by chance, we contrasted the empirical WNODF values with 95% confidence limits of WNODF values obtained from random matrices (1000 ran-dom matrices). Ranran-dom matrices were generated through the quasiswap count algorithm (available in ‘vegan’ R package, ver. 2.3-1; Oksanen et al. 2015). This fixed-fixed algorithm preserves the observed row and column totals in random-ized matrices, and then implements swaps in random 2 2 submatrices (Gotelli 2000). This null model is considered conservative and fulfils required statistical properties (Gotelli 2000, Ulrich and Gotelli 2007).
We calculated the Z-score (X – m simul)/s simul where X is the observed WNODF, and m simul and s simul are the mean and standard deviation, respectively, of 1000 simulated matrices. Positive Z-scores indicate X higher than expected by chance, whereas negative Z-scores indicate X lower than expected by chance. These steps were repeated for both the functional and the taxonomic structure at both spatial scales (regions and provinces).
Correlates of nestedness
Analyses of the causes of nested patterns were conducted within biogeographic regions (partial correlations) and across regions and provinces (multiple regression analyses). At the biogeographic regional scale, when matrices presented significant nested structures, we measured the influence of site attributes on such patterns through partial correlation analysis. We calculated the site nestedness order using a matrix packing function in ‘bipartite’ R package ver. 2.05 (Dormann et al. 2014). Partial Spearman’s rank order cor-relations were then conducted among the rank order of sites (increasing order) and site attributes: isolation, coral area, coastal length and distance from the biodiversity centre. operate as a source of species. Here we made use of two
complementary measures of isolation: the distance from the biodiversity centre, and the distances of each site to the 10 nearest reef habitat patches, a measure of connectiv-ity (Parravicini et al. 2013). The distance from the diver-sity centre for each biogeographical realm was measured in degrees, and it corresponded to the Caribbean (474 species recorded in Cuba) (Briggs 2003, Floeter et al. 2008), for sites within the Atlantic, and to the Indo-Australian Archipelago ( 2000 species in the Philippines) (Carpenter and Springer 2005) for sites in the Indo-Pacific. Connectivity was cal-culated using a nearest neighbor approach (Moilanen and Nieminen 2002), which corresponded to the mean distance from the site to the 10 nearest patches of habitat (Parravicini et al. 2013). Coral reef area estimates were derived from the Coral Reef Millennium Census project (UNEP-WCMC, WorldFish Centre, WRI, TNC 2010), while the rocky reef layer was obtained from Halpern and Floeter (2008).
Data analysis
Nestedness analyses
Analyses were carried out at two spatial scales. The first and larger scale corresponded to six biogeographic regions defined for reef fish faunas (Kulbicki et al. 2013), namely: Eastern Atlantic, Western Atlantic, Tropical Eastern Pacific, Central Pacific, Central Pacific, and Western Indo-Pacific (Fig. 3). These regions were composed of a number of provinces, which in turn were constituted by a given number of sites (Fig. 3). The second set of analysis was conducted at the Province scale (Kulbicki et al. 2013), encompassing 14 provinces presenting specific characteristics of its associ-ated reef fish fauna (see Supplementary material Appendix 3, for a complete list of provinces, their sites and local species richness).
We assessed the degree of nestedness of reef fish assem-blages at both spatial scales to investigate whether the patterns were similar across regions and its constituent provinces. Within a biogeographic region, provinces might exhibit different degrees of nestedness, which could corre-spond to particular processes operating and structuring their reef fish assemblages. At both scales, we examined the nest-edness degree of the taxonomic and functional structure of reef fish assemblages.
There are many indices available to measure nestedness using presence–absence data (Ulrich et al. 2009), and there are metrics designed to estimate nestedness for quantitative data (Galeano et al. 2009, Almeida-Neto and Ulrich 2011). Also, more recently, Melo et al. (2014) have developed a framework termed treeNODF, an extension of the NODF index (nest-edness metric based on overlap and decreasing fill; Almeida-Neto et al. 2008) that measures nestedness while accounting for the functional or phylogenetic diversity of communities (traitNODF and PhyloNODF, respectively). While trait-NODF represents a functional nestedness estimate (Melo et al. 2014, Matthews et al. 2015), it only considers binary data. An index using quantitative data provides informa-tion on whether the populainforma-tions of smaller assemblages have lower abundances compared to conspecific populations that occur in species-rich assemblages (Almeida-Neto and Ulrich
provinces were also functionally nested (Table 1): the Southwestern Atlantic, the Southwestern Pacific and Easter Island provinces.
Isolation exerted an important effect on the level of nest-edness observed across reef fish assemblages (Fig. 5). Within regions, isolation was significantly and positively related to the rank order of sites of the Central Pacific, Tropical Eastern Pacific and Western Atlantic regions. In those regions, poorer sites – with a high rank order according to the maximally packed matrix – are more isolated from surrounding reef areas (Fig. 6). For the Western Indian, isolation was nega-tively related to ranked sites (Fig. 6, pink bars). Area, mea-sured as either coral area (km2) or coastal length (km), was identified as a driver of a nested pattern only for Western Atlantic reef fish assemblages. For the Western Atlantic, coastal length had a significant negative relationship with the rank order of sites, i.e. poorer sites (with a high rank order) have smaller coastal lengths. The distance from the centre of biodiversity is a driver of nestedness across five biogeographic regions. The significant negative relationship between this distance and the rank order of sites implies that the most distant sites are poorer, and represent subsets of assemblages that are closer to the centre of biodiversity. This relationship was identified for the Central Pacific, Tropical Eastern Pacific, Western Atlantic and with a lower value for the Central Indo-Pacific. For the Western Indian, the pat-tern was the opposite: low ranked sites – with the greater number of FG and species – are farther from the centre of biodiversity.
Across regions, we found a moderate correlation between taxonomic nestedness and isolation (p 0.01, r2 0.43), but no correlation between functional nestedness and isolation (Fig. 3, p 0.55, r2 0.05) (Fig. 5). Area had a positive, but not significant, effect on nested patterns.
Partial correlations were conducted in R software using the ‘ppcor’ R package, ver. 1.0 (Seongho 2015).
To test our predictions on the relationship between func-tional and taxonomic nestedness with gradients of isolation and area across sites (Fig. 2), we performed quadratic least square regressions: y=β0+β1X12+β1X1+β2X2 where y corresponds to the observed nestedness at two different scales (regions and provinces), X1 is the mean isolation and X2 is the mean area across sites (Supplementary material Appendix 4 for model selection). All data analyses were conducted in the software R 2.14.2 (R Core Team).
Results
At the biogeographical regional scale, the taxonomic structure of reef fish assemblages was significantly nested in the Tropical Eastern Pacific and the Western Atlantic regions. In the Central Pacific region, assemblages were not nested for their taxonomic structure. On the other hand, reef fish assemblages within five out of the six regions presented higher functional nestedness than expected by chance, i.e. reef fish FGs that occurred in depauperate sites were subsets of species-rich sites (Table 1, Fig. 4). The Western Atlantic and Tropical Eastern Pacific regions exhibited significantly nested taxonomic and functional structures, whereas the Central Pacific, Central Indo-Pacific and Western Indo-Pacific were only functionally nested. On the other hand, fish assemblages of the Eastern Atlantic region were not significantly nested for any diversity component. At the province scale, the taxonomic and functional structures were significantly nested only in three and four out of the 14 provinces respectively, but all taxonomically nested
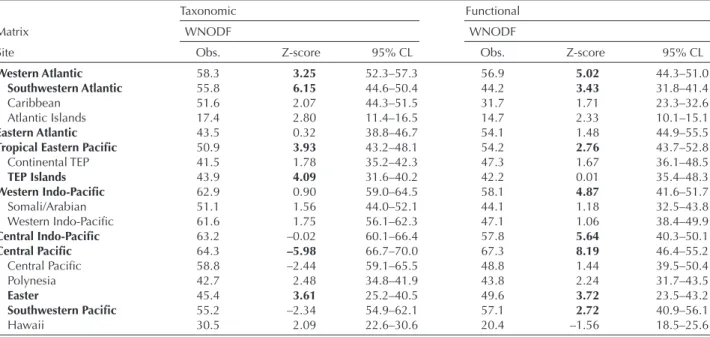
Table 1. Quantitative nestedness (WNODF) of taxonomic and functional matrices of reef fish assemblages in six biogeographic regions and its provinces. Obs.: observed WNODF values; 95% CL: WNODF confidence limits from 1000 random matrices obtained from null model ‘quasiswap’ (see Methods); Z-score (X-m simul)/s simul, where X is the observed WNODF, and m simul and s simul are the mean and stan-dard deviation, respectively, of 1000 simulated matrices. Positive Z-scores indicate higher x than expected by chance, whereas negative Z-scores indicate lower x than expected by chance. All matrices were double sorted according to marginal richness and abundance totals. Regions and provinces with positive Z-scores in bold were significantly nested.
Taxonomic Functional
Matrix WNODF WNODF
Site Obs. Z-score 95% CL Obs. Z-score 95% CL
Western Atlantic 58.3 3.25 52.3–57.3 56.9 5.02 44.3–51.0
Southwestern Atlantic 55.8 6.15 44.6–50.4 44.2 3.43 31.8–41.4
Caribbean 51.6 2.07 44.3–51.5 31.7 1.71 23.3–32.6
Atlantic Islands 17.4 2.80 11.4–16.5 14.7 2.33 10.1–15.1
Eastern Atlantic 43.5 0.32 38.8–46.7 54.1 1.48 44.9–55.5
Tropical Eastern Pacific 50.9 3.93 43.2–48.1 54.2 2.76 43.7–52.8
Continental TEP 41.5 1.78 35.2–42.3 47.3 1.67 36.1–48.5 TEP Islands 43.9 4.09 31.6–40.2 42.2 0.01 35.4–48.3 Western Indo-Pacific 62.9 0.90 59.0–64.5 58.1 4.87 41.6–51.7 Somali/Arabian 51.1 1.56 44.0–52.1 44.1 1.18 32.5–43.8 Western Indo-Pacific 61.6 1.75 56.1–62.3 47.1 1.06 38.4–49.9 Central Indo-Pacific 63.2 –0.02 60.1–66.4 57.8 5.64 40.3–50.1 Central Pacific 64.3 –5.98 66.7–70.0 67.3 8.19 46.4–55.2 Central Pacific 58.8 –2.44 59.1–65.5 48.8 1.44 39.5–50.4 Polynesia 42.7 2.48 34.8–41.9 43.8 2.24 31.7–43.5 Easter 45.4 3.61 25.2–40.5 49.6 3.72 23.5–43.2 Southwestern Pacific 55.2 –2.34 54.9–62.1 57.1 2.72 40.9–56.1 Hawaii 30.5 2.09 22.6–30.6 20.4 –1.56 18.5–25.6
Bellwood and Hughes (2001). It is possible that such homo-geneous or nested pattern detected at a large spatial scale (i.e. encompassing Indian, Pacific and Tropical Eastern Pacific Oceans) (Bellwood and Hughes 2001) conceals small-scale patterns, which have, for instance, shown differences in the proportion of families in South Pacific reef fish assemblages (Kulbicki and Rivaton 1997, Kulbicki et al. 2004). Studies have highlighted the importance of nestedness for reef fish assemblages across the Indo-Pacific (Bellwood and Hughes 2001, Kulbicki et al. 2013, Mouillot et al. 2013b); yet a turnover component is also present, associated with high levels of endemism or recent cladogenesis (Mouillot et al. 2013b).
Discussion
Nested patterns
Our findings reveal that the functional structure, i.e. the composition and number of species per FG – of depauperate tropical reef fish assemblages represents a nested subset of the structure found in richer assemblages, a pattern found across five biogeographic regions. Nevertheless, the family-level taxonomic structure of most assemblages did not fol-low a nested pattern. This differs from the homogeneous structure identified for Indo-West Pacific assemblages by
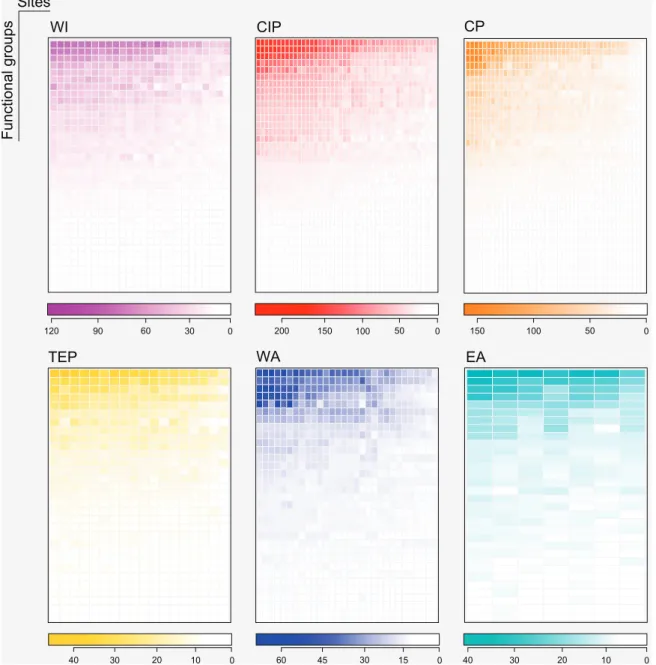
Sites Functional groups EA WI CIP CP TEP WA 0 50 100 150 0 20 30 40 10 0 50 150 200 0 60 90 120 30 0 30 45 60 15 0 20 30 40 10 100
Figure 4. The nested functional structure of global reef fish assemblages. Maximally packed matrices representing the number of functional groups (rows) across sites in six biogeographic regions: Western Indian (WI, in purple), Central Indo-Pacific (CIP, in red), Central Pacific (CP, orange), Tropical Eastern Pacific (TEP, in yellow), Western Atlantic (WA, in blue) and Eastern Atlantic (EA in light-blue). Color gradients below each matrix denote the species richness of functional groups within each site. Functional redundancy decreases from top to bottom rows, and also from left to right, i.e. from the most species-rich to poorer sites. Indeed, our analyses reveal that the functional structure of poor sites is significantly nested within the structure of richer sites, with the exception of the EA. Note, for instance, that the most redundant FGs vary from over 200 species in the CIP (dark-red), to 40 species in the TEP (dark-yellow). Matrices for the taxonomic structure in Supplementary material Appendix 5.
(Svenning et al. 2011, Luiz et al. 2013). Filters known to limit the distribution of reef fishes, such as isolation and the distance from the centre of biodiversity, may have an effect on both the taxonomic composition and functional structure of assemblages.
Causes of nestedness
Area was expected to be a major driver of nested patterns across global reef fish assemblages, yet it was found to underpin nestedness (functional and taxonomic) only in Such spatial turnover in species composition was identified
at the boundaries of the Indo-Pacific, and could have its ori-gins in the higher endemism of regions such as the eastern Pacific, southern Australia and the Western Indian Ocean province (Kulbicki et al. 2013, Mouillot et al. 2013b, Borsa et al. 2016). The taxonomic turnover across Central Pacific sites (Marquesas, Easter, Hawaii, Polynesia) may account for the non-nested taxonomic pattern identified for this region (here referred to as Central Pacific sensu Kulbicki et al. 2013). The turnover between assemblages could be related to the effects of dispersal limitation and environmental filtering
0 500 1000 1500 2000 2500 3000 0 20 40 60 80 100 (A) (B) Isolation Taxonomic nestednes s 0 500 1000 1500 2000 2500 3000 Isolation Functional nestednes s r2 = 0.43; p < 0.01 r2 = –0.05; p = 0.55 0 20 40 60 80 100
Figure 5. The observed relationship between levels of taxonomic (A) and functional nestedness (B) and gradients in isolation for global reef fish assemblages. Nestedness values were obtained for six biogeographic regions and 12 provinces, and correspond to those in Table 1. Isolation expressed in km and measured as the distance from the 10 nearest reef sites. Mean isolation was pooled across all sites. Circle size is proportional to area gradients in each region and province. Solid line corresponds to predicted values under a quadratic regression (Taxonomic: p 0.01, r2 0.43; Functional: p 0.55, r2 –0.05), shaded area corresponds to 95% confidence intervals. Regions and
provinces are color-coded following Fig. 3.
WI Spearman's Rho CIP TEP WA Spearman's Rho –1.0 –0.5 0.0 0.5 1.0
isolcoralcoastdist
Taxonomic Functional CP –1.0 –0.5 0.0 0.5 1.0 TEP WA
isolcoralcoastdist
Figure 6. Spearman’s rank order correlations between functional (top) and taxonomic (bottom) nestedness with site attributes across bio-geographic regions. Coloured bars represent significant correlations (p 0.05). isol: isolation; coral: coral area (km2); coast: coast length
(km); dist: distance from the biodiversity center measured in degrees. Isolation expressed in km and measured as the distance from the 10 nearest reef sites. WI: Western Indian, CIP: Central Indo-Pacific; CP: Central Pacific; TEP: Tropical Eastern Pacific; WA: Western Atlantic. Depicted regions are those significantly nested.
however, that our conceptual framework did not include pre-dictions for nestedness relative to potential variations in the spatial distribution of patches in relation to other patches, as well as differences in island age. The geographical posi-tion, size and age of a patch could possibly affect nestedness among species assemblages through its influence on coloni-zation and/or extinction events (Pellissier et al. 2014). This is an interesting avenue for further research on the assembly of reef fish communities.
The roles of habitat area and isolation on the structure of assemblages are widespread in ecology and biogeogra-phy (MacArthur and Wilson 1967, Lomolino 1999) with smaller or isolated sites being subsets of larger and/or less isolated ones (Patterson and Atmar 1986, Lomolino 1999). Insular nestedness would result from processes of extinction and colonization (Patterson and Atmar 1986), mediated by species abilities to interact with isolation and area (Lomolino 1999). Thus, nested patterns are attributable to species traits (Lomolino 1999, Hu et al. 2011, Novak et al. 2011, Sasaki et al. 2012), and how these traits are related to dispersal abil-ity and colonizing capacabil-ity (Luiz et al. 2013), vulnerabilabil-ity to extinction and habitat specificity. By looking at functional nestedness, we are ultimately assessing which traits con-tribute to such pattern. Among species widely discon-tributed across fish assemblages, many are large-bodied piscivores and carnivores (mobile invertebrate feeders) (Supplementary material Appendix 6). For reef fishes, large body size implies greater range sizes, as well as higher potential to expand their ranges across dispersal barriers and to colonize new habitats (Luiz et al. 2012, 2013). On the contrary, FGs such as small piscivores and sessile invertebrate feeders have restricted ranges and also habitat specificity (Hawkins et al. 2000). These contrasting patterns in dispersal abilities and resource requirements – also related to species’ body sizes – could generate both taxonomic and functional nested patterns (Lomolino 1999).
The contrast between highly redundant and low redun-dant FGs has been highlighted by Mouillot et al. (2014), who found that tropical reef fish assemblages are character-ized by functional over-redundancy – over a third of func-tional groups are represented by a disproporfunc-tional number of species – as well as by functional vulnerability – another con-siderable amount of FGs are supported by one species only, and left with no insurance. High functional vulnerability – where there is a high proportion of FGs with no insurance – is found across many assemblages of the Tropical Eastern Pacific, across the Eastern Atlantic and in Atlantic Ocean islands (Parravicini et al. 2014). This study provides new insights by unravelling the level of spatial insurance among assemblages through functional redundancy. We indeed showed that, within biogeographic regions, redundant FGs mostly exhibited a homogeneous distribution, carrying com-binations of functional traits such as large body sizes and piscivore diets, small to large-bodies and carnivorous diets (mobile invertebrate feeders). Nevertheless, those FGs sup-ported by few species, and low redundancy, may differ across biogeographic regions. Overall, low functional redundancy appears related to FGs that have a close link to reef habitats (hard substratum): sessile invertebrate feeders (e.g. corals, sponges) (in the Indo-Pacific), macro-algal herbivores, and herbivore-detritivores. In sites where these functions occur, fish faunas of the Western Atlantic. Indeed, coral reefs and
reef fishes are closely connected in their evolutionary history (Bellwood and Wainwright 2002, Cowman and Bellwood 2013), with reef systems acting as a centre for survival, as well as diversification, of fish lineages (Cowman and Bellwood 2013). Reef area has been identified as a key habitat attribute structuring reef fish assemblages at global (Parravicini et al. 2013), regional (Bellwood and Hughes 2001, Bender et al. 2013) and local scales (Hubert et al. 2011). In the Atlantic Ocean, reefs have undergone extinction events and expe-rienced severe reductions in shallow-water habitats caused by Pleistocene glaciations (Bellwood and Wainwright 2002, Floeter et al. 2008, Pellissier et al. 2014). The dramatic his-tory of reefs and fishes in the Atlantic (Budd 2000), com-pared to that of the Indo-Pacific, might explain the role of area in driving a nested pattern across Atlantic reef fish assemblages. The lower availability and connectivity across shallow-water habitats of the Atlantic Ocean (Bellwood and Wainwright 2002, Floeter et al. 2008) may have led to an increased dependence or association of fish assemblages and reef areas, as well as isolated communities over time, favour-ing nestedness. Furthermore, reef features (e.g. patch size, reef type, reef habitat, coral richness) may act as filters to the functional (Bellwood et al. 2002, MacNeil et al. 2009, Bender et al. 2013) and phylogenetic structure (Hubert et al. 2011, Leprieur et al. 2015) of associated assemblages.
The role of isolation in shaping nested patterns was identified for three biogeographic regions, namely Central Pacific, Tropical Eastern Pacific and Western Atlantic. For the Western Indian assemblages, isolation does not imply a reduced taxonomic and functional diversity. The high degree of functional nestedness identified for the Central Pacific may have been caused by the physical geography of the region, comprising several islands and atolls of various sizes, sufficiently isolated from each other. Contrasting to the Central Pacific region, a slightly lower nestedness value is observed for the Central Indo-Pacific where historical habi-tat connectivity is high (Cowman and Bellwood 2013) with low isolation among sites. Also, in the Central Indo-Pacific, the greater habitat diversity and lower dispersal constraints compared to the Central Pacific could decrease nestedness. In the Atlantic Ocean, isolation has shaped the structure of reef fish assemblages, acting as a filter to certain reef fish families and species’ functional traits (Bender et al. 2013). Also, isolation had a role in the present-day patterns of reef fish endemism in Atlantic islands, possibly by reducing gene flow between populations (Hachich et al. 2015). ‘Filtering effects’ of isolation may contribute to a nested pattern across Atlantic reef sites. In the Western Indian, high levels of endemism and species richness of the reef fauna in isolated provinces, such as the Western Indian Ocean Islands (WII) and the Southwestern Indian (SWI) (Borsa et al. 2016), have possibly caused the observed effect of isolation on nested patterns.
The relationship between taxonomic nestedness and isolation across regions was similar to the expected trend (Fig. 2), with nestedness values dropping at high isola-tion (Fig. 5). In contrast, funcisola-tional nestedness was weakly influenced by isolation when pooling regions and prov-inces together (see Fig. 2 and 5 for a comparison between predictions and observed data, respectively). We are aware,
Carpenter, K. E. and Springer, V. G. 2005. The center of the center of marine shore fish biodiversity: the Philippine Islands. – Environ. Biol. Fish. 72: 467–480.
Cowman, P. F. and Bellwood, D. R. 2013. The historical biogeog-raphy of coral reef fishes: global patterns of origination and dispersal. – J. Biogeogr. 40: 209–224.
Díaz, S. and Cabido, M. 2001. Vive la différence: plant functional diversity matters to ecosystem processes. – Trends Ecol. Evol. 16: 646–655.
Dormann, C. F. et al. 2014. Bipartite-package: analysis of bipartite ecological networks. – R package ver. 2.05.
Fleishman, E. et al. 2002. Nestedness analysis and conservation planning: the importance of place, environment, and life history across taxonomic groups. – Oecologia 133: 78–89. Floeter, S. R. et al. 2008. Atlantic reef fish biogeography and
evolution. – J. Biogeogr. 35: 22–47.
Flynn, D. F. et al. 2009. Loss of functional diversity under land use intensification across multiple taxa. – Ecol. Lett. 12: 22–33.
Fox, R. J. and Bellwood, D. R. 2013. Niche partitioning of feeding microhabitats produces a unique function for herbivorous rab-bitfishes (Perciformes, Siganidae) on coral reefs. – Coral Reefs 32: 13–23.
Galeano, J. et al. 2009. Weighted-interaction nestedness estimator (WINE): a new estimator to calculate over frequency matrices. – Environ. Model. Softw. 24: 1342–1346.
Gotelli, N. J. 2000. Null model analysis of species co-occurrence patterns. – Ecology 81: 2606–2621.
Guillemot, N. et al. 2011. Functional redundancy patterns reveal non-random assembly rules in a species-rich marine assem-blage. – PLoS One 6: e26735.
Hachich, N. F. et al. 2015. Island biogeography: patterns of marine shallow-water organisms in the Atlantic Ocean. – J. Biogeogr. 42: 1871–1882.
Halpern, B. S. and Floeter, S. R. 2008. Functional diversity responses to changing species richness in reef fish communities. – Mar. Ecol. Prog. 364: 147–156.
Hawkins, J. P. et al. 2000. The threatened status of restricted-range coral reef fish species. – Anim. Conserv. 3: 81–88.
Hooper, D. et al. 2002. Species diversity, functional diversity and ecosystem functioning. – In: Loreau, M. et al. (eds), Biodiversity and ecosystem functioning. Oxford Univ. Press, pp. 195–208. Hu, G. et al. 2011. Determinants of plant species richness and
patterns of nestedness in fragmented landscapes: evidence from land-bridge islands. – Landscape Ecol. 26: 1405–1417. Hubert, N. et al. 2011. Community assembly and diversification
in Indo-Pacific coral reef fishes. – Ecol. Evol. 1: 229–247. Kulbicki, M. and Rivaton, J. 1997 Inventaire des poissons
lagonaires et récifaux de Nouvelle-Calédonie. – Cybium 21: 81–98.
Kulbicki, M. et al. 2004. Basic principles underlying research projects on the links between the ecology and the uses of coral reef fishes in the Pacific. – In: Visser, L. E. (ed.), Challenging coasts. Transdisciplinary excursions into integrated coastal zone development. Amsterdam Univ. Press, pp. 119–158.
Kulbicki, M. et al. 2013. Global biogeography of reef fishes: a hierarchical quantitative delineation of regions. – PLoS One 8: e81847.
Lavorel, S. and Garnier, E. 2002. Predicting changes in community composition and ecosystem functioning from plant traits: revisiting the Holy Grail. – Funct. Ecol. 16: 545–556. Lawton, J. H. and Brown, V. K. 1994. Redundancy in ecosystems.
– In: Schulze, E. D. and Mooney, H. A. (eds), Biodiversity and ecosystem function. Springer, pp. 255–268.
Leprieur, F. et al. 2015. Historical and contemporary determinants of global phylogenetic structure in tropical reef fish faunas. – Ecography in press.
impacts to reefs may impair the ability of species assemblages to replace a lost function, given the low redundancy of these groups. Finally, the role of isolation in causing nested pat-terns within regions may indicate that disturbances may have disproportionate effects on the structure and functioning of depauperate and isolated reef ecosystems.
Acknowledgements – We thank the GASPAR (General Approach to
Species Abundance Relationships) program at the Center of Eco-logical Synthesis and Analysis of Biodiversity (CESAB), funded by the French Foundation for Research on Biodiversity (FRB), whose database has enabled this work. MGB, SRF and MRP were sup-ported by CNPq (grants 168287/2014-5, 305358/2015-4 and 571334/2008-3).
References
Almeida-Neto, M. and Ulrich, W. 2011. A straightforward com-putational approach for measuring nestedness using quantita-tive matrices. – Environ. Model. Softw. 26: 173–178. Almeida-Neto, M. et al. 2008. A consistent metric for nestedness
analysis in ecological systems: reconciling concept and meas-urement. – Oikos 117: 1227–1239.
Azeria, E. T. 2004. Terrestrial bird community patterns on the coralline islands of the Dahlak Archipelago, Red Sea, Eritrea. – Global Ecol. Biogeogr. 13: 177–187.
Bellwood, D. R. 1996. The Eocene fishes of Monte Bolca: the earliest coral reef fish assemblage. – Coral Reefs 15: 11–19. Bellwood, D. R. and Hughes, T. P. 2001. Regional-scale assembly
rules and biodiversity of coral reefs. – Science 292: 1532–1534. Bellwood, D. R. and Wainwright, P. C. 2002. The history and
biogeography of fishes on coral reefs. – In: Sale, P. F. (ed.), Coral reef fishes. Dynamics and diversity on a complex ecosys-tem, Academic Press, pp. 5–32.
Bellwood, D. R. et al. 2002. Assembly rules and functional groups at global biogeographic scales. – Funct. Ecol. 16: 557–562. Bellwood, D. R. et al. 2003. Limited functional redundancy in
high diversity systems: resilience and ecosystem function on coral reefs. – Ecol. Lett. 6: 281–285.
Bellwood, D. R. et al. 2004. Confronting the coral reef crisis. – Nature 429: 827–833.
Bender, M. G. et al. 2013. Biogeographic, historical and environ-mental influences on thetaxonomic and functional structure of Atlantic reef fish assemblages. – Global Ecol. Biogeogr. 22: 1173–1182.
Berumen, M. L. and Pratchett, M. S. 2008. Trade-offs associated with dietary specialization in corallivorous butterflyfishes (Chaetodontidae: Chaetodon). – Behav. Ecol. Sociobiol. 62: 989–994.
Borsa, P. et al. 2016. Comparative phylogeography of the south-western Indian Ocean reef fauna. – Acta Oecol. 72: 72–86. Briggs, J. C. 2003. Marine centres of origin as evolutionary engines.
– J. Biogeogr. 30: 1–18.
Budd, A. F. 2000. Diversity and extinction in the Cenozoic history of Caribbean reefs. – Coral Reefs 19: 25–35.
Budd, A. F. and Pandolfi, J. M. 2010. Evolutionary novelty is con-centrated at the edge of coral species distributions. – Science 328: 1558–1561.
Burkepile, D. E. and Hay, M. E. 2008. Herbivore species richness and feeding complementarity affect community structure and function on a coral reef. – Proc. Natl Acad. Sci. USA 105: 16201–16206.
Cardinale, B. J. et al. 2012. Biodiversity loss and its impact on humanity. – Nature 486: 59–67.
Parravicini, V. et al. 2013. Global patterns and predictors of trop-ical reef fish species richness. – Ecography 36: 1254–1262. Parravicini, V. et al. 2014. Global mismatch between species
richness and vulnerability of reef fish assemblages. – Ecol. Lett. 17: 1101–1110.
Patterson, B. D. and Atmar, W. 1986. Nested subsets and the structure of insular mammalian faunas and archipelagos. – Biol. J. Linn. Soc. 28: 65–82.
Patterson, B. D. and Atmar, W. 2000. Analyzing species composi-tion in fragments. – Bonner Zool. Monogr. 46.
Pellissier, L. et al. 2014. Quaternary coral reef refugia preserved fish diversity. – Science 344: 1016–1019.
Sasaki, T. et al. 2012. Nestedness and niche-based species loss in moorland plant communities. – Oikos 11: 1783–1790. Semmens, B. X. et al. 2010. Using ecological null models to assess
the potential for marine protected area networks to protect biodiversity. – PLoS One 5: e8895.
Seongho, K. 2015. Package ‘ppcor’: partial and semi-partial cor-relation. – R package ver. 1.0.
Srinivasan, U. et al. 2014. Past climate and species ecology drive nested species richness patterns along an east‐west axis in the Himalaya. – Global Ecol. Biogeogr. 23: 52–60.
Streit, R. P et al. 2015. Feeding characteristics reveal functional distinctions among browsing herbivorous fishes on coral reefs. – Coral Reefs 34: 1037–1047.
Stuart-Smith, R. D. et al. 2013. Integrating abundance and functional traits reveals new global hotspots of fish diversity. – Nature 50: 539–542.
Svenning, J.-C. et al. 2011. Climate, history and neutrality as drivers of mammal beta diversity in Europe: insights from multiscale deconstruction. – J. Anim. Ecol. 80: 393–402. Ulrich, W. and Gotelli, N. J. 2007. Null model analysis of species
nestedness patterns. – Ecology 88: 1824–1831.
Ulrich, W. and Gotelli, N. J. 2010. Null model analysis of species associations using abundance data. – Ecology 91: 3384–3397. Ulrich, W. et al. 2009. A consumer’s guide to nestedness analysis.
– Oikos 118: 3–17.
UNEP-WCMC, WorldFish Cente, WRI, TNC 2010. Global distributin of warm-water coral reefs, compiled from multiple sources including the Millennium Coral Reef Mapping Project. – Version 1.3, < http://data.unep-wcmc.org/datasets/1 >. Violle, C. et al. 2007. Let the concept of trait be functional!
– Oikos 116: 882–892.
Wang, Y. et al. 2013. Nestedness of bird assemblages on urban woodlots: implications for conservation. – Landscape Urban Plan. 111: 59–67.
Wong, M. Y. L. et al. 2007. The threat of punishment enforces peaceful cooperation and stabilizes queues in a coral-reef fish. – Proc. R. Soc. B 274: 1093–1099.
Wright, D. H. and Reeves, J. H. 1992. On the meaning and meas-urement of nestedness of species assemblages. – Oecologia 92: 416–428.
Lomolino, M. V. 1996. Investigating causality of nestedness of insular communities: selective immigration or extinctions? – J. Biogeogr. 23: 699–703.
Lomolino, M. V. 1999. A species-based, hierarchical model of island biogeography. – In: Weiher, E. and Keddy, P. (eds), Eco-logical assembly rules. Cambridge Univ. Press, pp. 272–307. Luiz, O. J. et al. 2012. Ecological traits influencing range
expansion across large oceanic dispersal barriers: insights from tropical Atlantic reef fishes. – Proc. R. Soc. B 279: 1033–1040.
Luiz, O. J. et al. 2013. Adult and larval traits as determinants of geographic range size among tropical reef fishes. – Proc. Natl Acad. Sci. USA 110: 16498–16502.
MacArthur, R. H. and Wilson, E. O. 1967. The theory of island biogeography. – Princeton Univ. Press.
MacNeil, M. A. et al. 2009. Hierarchical drivers of reef-fish metacommunity structure. – Ecology 90: 252–264.
Matthews, T. J. et al. 2015. Ecological traits reveal functional nestedness of bird communities in habitat islands: a global sur-vey. – Oikos 124: 817–826.
McGill, B. J. et al. 2006. Rebuilding community ecology from functional traits. – Trends Ecol. Evol. 21: 178–185.
Melo, A. S. et al. 2014. treeNODF: nestedness to phylogenetic, functional and other tree‐based diversity metrics. – Methods Ecol. Evol. 5: 563–572.
Moilanen, A. and Nieminen, M. 2002. Simple connectivity meas-ures in spatial ecology. – Ecology 83: 1131–1145.
Mouillot, D. et al. 2011. Protected and threatened components of fish biodiversity in the Mediterranean Sea. – Curr. Biol. 21: 1044–1050.
Mouillot, D. et al. 2013a. Rare species support vulnerable func-tions in high-diversity ecosystems. – PLoS Biol. 11: e1001569.
Mouillot, D. et al. 2013b. The challenge of delineating biogeo-graphical regions: nestedness matters for Indo-Pacific coral reel fishes. – J. Biogeogr. 40: 2228–2237.
Mouillot, D. et al. 2014. Functional over-redundancy and high functional vulnerability in global fish faunas of tropical reefs. – Proc. Natl Acad. Sci. USA 111: 13757–13762.
Munday, P. L. and Jones, G. P. 1998. The ecological implications of small body size among coral-reef fishes. – Oceanogr. Mar. Biol. 36: 373–411.
Naeem, S. 1998. Species redundancy and ecosystem reliability. – Conserv. Biol. 12: 29–45.
Naeem, S. et al. 2012. The FE of biological diversity in an age of extinction. – Science 336: 1401–1406.
Novak, M. et al. 2011. Nestedness patterns and the dual nature of community reassembly in California streams: a multivariate permutation-based approach. – Global Change Biol. 17: 3714–3723.
Oksanen, J. et al. 2015. The Vegan package. – Community ecology package, R package ver. 2.3-1.
Supplementary material (Appendix ECOG-02293 at < www. ecography.org/appendix/ecog-02293 >). Appendix 1–6.