HAL Id: hal-01460400
https://hal.archives-ouvertes.fr/hal-01460400
Submitted on 3 Feb 2021
HAL is a multi-disciplinary open access
archive for the deposit and dissemination of
sci-entific research documents, whether they are
pub-lished or not. The documents may come from
teaching and research institutions in France or
abroad, or from public or private research centers.
L’archive ouverte pluridisciplinaire HAL, est
destinée au dépôt et à la diffusion de documents
scientifiques de niveau recherche, publiés ou non,
émanant des établissements d’enseignement et de
recherche français ou étrangers, des laboratoires
publics ou privés.
COARSE FRACTION FLUCTUATIONS IN PELAGIC
CARBONATE SEDIMENTS FROM THE TROPICAL
INDIAN-OCEAN - A 1500-KYR RECORD OF
CARBONATE DISSOLUTION
Fc Bassinot, L Beaufort, E Vincent, Ld Labeyrie, F Rostek, Pj Muller, X
Quidelleur, Y Lancelot
To cite this version:
Fc Bassinot, L Beaufort, E Vincent, Ld Labeyrie, F Rostek, et al.. COARSE FRACTION
FLUCTU-ATIONS IN PELAGIC CARBONATE SEDIMENTS FROM THE TROPICAL INDIAN-OCEAN - A
1500-KYR RECORD OF CARBONATE DISSOLUTION. Paleoceanography, American Geophysical
Union, 1994, 9 (4), pp.579-600. �10.1029/94PA00860�. �hal-01460400�
Coarse fraction fluctuations in pelagic carbonate sediments
from the tropical Indian Ocean: A 1500-kyr record
of carbonate
dissolution
Franck C. Bassinot,
•,: Luc Beaufort,
• Edith Vincent, • Laurent D. Labeyrie,
3
Frauke Rostek, • Peter J. Miiller, 4 Xavier Quidelleur, • and Yves Lancelot •
Abstract. We examined
coarse
fraction
contents
of pelagic carbonates
deposited
between
2000-
and 3700-m water depth
in the tropical
Indian Ocean
using
Ocean
Drilling Program
(ODP) sites
722 (Owen Ridge, Arabian Sea) and 758 (Ninetyeast
Ridge, eastern
equatorial
Indian Ocean), and
four giant piston
cores
collected
by the French
R/V Marion Dufresne
during
the SEYMAMA
expedition.
Over the last 1500 kyr, coarse
fraction
records
display
high-amplitude
oscillations
with
an irregular
wavelength
on the order
of ~500 kyr. These
oscillations
can be correlated
throughout
the entire equatorial
Indian Ocean,
from the Seychelles
area eastward
to the Ninetyeast
Ridge, and
into the Arabian Sea. Changes
in grain size mainly result from changes
in carbonate
dissolution
as
evidenced
by the positive
relationship
between
coarse
fraction
content
and a foraminiferal
preservation
index based
on test fragmentation.
The well-known
"mid-Brunhes
dissolution
cycle"
represents
the last part of this irregular
long-term
dissolution
oscillation.
The origin of this long-
term oscillation
is still poorly understood.
Our observations
suggest
that it is not a true cycle (it
has an irregular
wavelength)
and we propose
that it may result from long-term
changes
in Ca ++
flux
to the ocean.
Sites 722 and 758 fi•aO
records
provide
a high-resolution
stratigraphy
that allows a
detailed intersite
comparison
of the two coarse
fraction records
over the last 1500 kyr. Site 722
(2030 m) lies above the present
and late Pleistocene
lysocline.
The lysocline
shoaled
to the
position
of site 758 (2925 m) only during the interglacial
intervals
that occurred
between
about
300 and 500 ka (Peterson
and Prell, 1985a). Despite these supralysoclinal
positions
of the two
sites, short-term
changes
in coarse
fraction
contents
are correlatable
from one site to another
and
probably
result from regional (or global) dissolution
pulses.
By stacking
the normalized
coarse
fraction records
from sites 722 and 758, we constructed
a Composite
Coarse
Fraction Index (CCFI)
curve in which most of the local signals
cancelled
out. The last 800 kyr of this curve appear
to
compare
extremely well with the Composite
Dissolution
Index curve from core V34-53
(Ninetyeast
Ridge), which unambiguously
records
past variations
of carbonate
dissolution
in the
equatorial
Indian Ocean (Peterson
and Prell, 1985a). In the late Pleistocene
the CCFI variations
are
mainly associated
with glacial-interglacial
changes.
They show strong 100 and 41 kyr periodicities
but no clear precession-related
periodicities.
As proposed
earlier by Peterson
and Prell (1985a), the
lack of precession
frequencies
may suggest
that the regional carbonate
dissolution
signal is driven
by changes
in deepwater
circulation.
We cannot
totally reject the possibility,
however, that low
temporal
resolution
and/or bioturbation
degrade
somehow
the precessional
signal at ODP sites
722 and 758. In contrast,
spectral
density of dissolution
cycles in the giant (53 m long) piston core
MD900963 (Maidives area) displays
clear maxima centered
on the precession
frequencies
(23 and 19
kyr -1) as well as on the 29-kyr I frequency
but shows
little power at the 100-kyr
-1 frequency.
These
high-frequency
changes
most probably
result from changes
in surface
productivity
associated
with
monsoon
variability. Dissolution
at this site may be ultimately controlled
by the oxidation of
organic
matter which appears
to be incorporated
into the sediments
in greater
quantity
during
periods of weak SW monsoon
and/or increased
dry NE monsoon.
1 Laboratoire de G6ologie du Quaternaire, Centre National de la
Recherche Scientifique, Marseille, France.
2 Now at Centre des Faibles Radioactivit6s, Domaine du Centre
National de la Recherche Scientifique, Gif-sur-Yvette, France.
3 Centre des Faibles Radioactivit6s, Domaine du Centre National de la
Recherche Scientifique, Gif-sur-Yvette, France.
4 Geowissenschaften, Universit•it Bremen, Bremen, Germany. 5 Institut de Physique du Globe de Paris, Paris, France.
Copyright 1994 by the American Geophysical Union. Paper number 94PA00860.
0883- 8305/94/94PA-00860510.00
Introduction
Deep-sea carbonate sediments cover about one half of the total oceanic floor [Berger et al., 1976; Biscaye et al., 1976;
Kolla et al., 1976] and act as a large and reactive reservoir for carbon dioxide [Broecker and Peng, 1•982, 1987; Sundquist and Broecker, 1985]. Understanding temporal and spatial changes
in carbonate preservation is of key importance for testing the
numerous models which seek to explain past changes in
atmospheric pCO 2 through changes in the oceanic carbon-
carbonate system [Broecker, 1982; Broecker and Peng, 1982; Boyle, 1988; Keir, 1988].
5 80 BASSINOT ET AL.: COARSE FRACTION RECORD OF PELAGIC CARBONATE
Since the pioneering work of Arrhenius [1952], it has been clearly established that carbonate contents of equatorial pelagic sediments show cyclic variations associated with Pleistocene glacial-interglacial changes [e.g., Arrhenius, 1952; Broecker, 1971; Berger, 1973; Gardner, 1975; Moore et al., 1982; Crowley, 1985; Peterson and Prell, 1985a; Vincent, 1985; Arrhenius, 1988; Farrell and Prell, 1989; Berger, 1992]. These fluctuations have been correlated over large distances in the Pacific [Hays et al., 1969; Vincent, 1981; Karlin et al., 1992] and into the Indian Ocean [Volat et al., 1980; Vincent, 1985] and have been used as powerful geochemical correlation tools. First interpreted in terms of changing surface productivity [Arrhenius, 1952], the Indo-Pacific carbonate fluctuations have been later reinterpreted in terms of dissolution changes, with increased dissolution during interglacials and enhanced preservation during glacials [Berger, 1973; Thompson and Saito, 1974; Volat et al., 1980; Farrell and Prell, 1989] (see the review by Berger [1992]). In the Atlantic and Southern Oceans, dissolution generally intensified during glacial periods [Gardner, 1975; Bd et al.,
1976; Crowley, 1983; Howard and Prell, 1990]. This asymmetry between the Atlantic and the Indo-Pacific has been attributed to changes in basin-basin fractionation resulting from variations in North Atlantic Deep Water (NADW) formation [Berger, 1970; Volat et al., 1980; Crowley, 1985].
Most studies dealing with carbonate dissolution history
have focused on deep-sea records below the calcite lysocline, where past changes in carbonate saturation of seawater have resulted in high-amplitude changes in carbonate content or in calcareous microfossil preservation [Berger, 1973; Thompson and Saito, 1974; Luz and Shackleton, 1975; Adelseck, 1977; Mayer, 1979; Peterson and Prell, 1985a; Farrell and Prell,
1989]. There is far less data available for carbonate dissolution
cycles in "shallower" water depths (above the lysocline)
[Droxler et al., 1983, 1990; Haddad, 1986]. Although
supralysoclinal waters are supersaturated with respect to
calcite, sediments deposited above the lysocline undergo significant carbonate dissolution. It has been proposed that
this dissolution results from the decay of organic matter [Emerson and Bender, 1981; Peterson and Prell, 1985b], with the release of CO2 reducing the pore water carbonate ion concentration to a level lower than at the equivalent water
depth in the water column. Carbonate dissolution patterns at intermediate and shallow water depths are of key importance in
determining whether past changes in the oceanic carbon-
carbonate system indicate a redistribution of properties within the ocean during glacial/interglacial oscillations [e.g., Boyle, 1988], or indicate transfers between global carbon or carbonate reservoirs (shelf, soil, and biosphere) that affect the entire water column in a similar way [e.g., Berger, 1970;
Shackleton, 1977; Broecker, 1982].
With increasing dissolution, foraminiferal tests tend to
break down into small fragments [Berger, 1968; Bd et al., 1975; Thunell, 1976]. Detailed depth transect studies conducted on the Ontong Java Plateau (western equatorial Pacific) and upon the Ninetyeast Ridge (eastern equatorial
Indian Ocean) have clearly established that coarse fraction
contents show a systematic relationship with water depth,
which mainly results from the fragmentation of foraminifera
and the subsequent transfer of fragments to the finer size
fraction as dissolution
proceeds
[Johnson
et al., 1977; Berger
et al., 1982; Peterson and Prell, 1985b]. Decrease in coarse
fraction content is a much more sensitive indicator of
dissolution than carbonate content, because foraminiferal tests
can break down after a small amount of carbonate has been lost
to dissolution. For instance, some 60% of the whole sand-sized
planktonic foraminifera has already broken up at the lysocline level upon Ninetyeast Ridge, whereas no more than 20 to 30%
of total carbonate has been estimated to have been lost to
dissolution [Peterson and Prell, 1985b]. Thus coarse fraction records should provide relatively easy to obtain qualitative information on the dissolution history in supralysoclinal carbonate deposits. The purpose of this study is to present a detailed coarse fraction stratigraphy of Pleistocene carbonate sediments from the tropical Indian Ocean to test the potential of grain size data as a correlation tool and as a proxy for studies of supralysoclinal carbonate dissolution.
Study Area, Material, and Methods
We selected four giant piston cores (30 to 53 m in length) retrieved during the SEYMAMA expedition of the French R/V Marion Dufresne (cores MD900938, MD900940, MD900949, and MD900963) and two Ocean Drilling Program (ODP) sites (sites 722 and 758). These pelagic carbonate sections are distributed over much of the tropical Indian Ocean in water depths ranging from 2030 to 3700 m (Figure 1 and Table 1). They provide long, continuous, and undisturbed Plio-
Pleistocene coarse fraction records.
Sites 722 (Owen Ridge, Arabian Sea) and 758 (Ninetyeast Ridge, eastern equatorial Indian Ocean) are especially suitable for studying temporal changes in coarse fraction content above the lysocline. Sites 722 (2030 m) and 758 (2925 m) lie about 1300 and 900 m above the present foraminiferal lysocline in the Arabian Sea [Cullen and Prell, 1984] and in the eastern equatorial Indian Ocean [Peterson and Prell, 1985b], respectively. On Ninetyeast Ridge the present foraminiferal lysocline (at 3800 m) is close to the saturation horizon with respect to calcite in the water column [Peterson and Prell, 1985b]. The lysocline position in the Ninetyeast Ridge area varied between about 2800 m and 4200 m during the last 800 kyr, that is to say, plus 400 m or minus 1000 m around its present position in the water column [Peterson and Prell, 1985a]. The lysocline shoaled to the position of site 758 only during the interglacial intervals that occurred between about 300 and 500 ka. If we consider that the lysocline position at Owen Ridge may have roughly fluctuated with the same amplitude, then site 722 probably remained in a supralysoclinal position during the entire late Pleistocene.
At sites 722 and 758, continuous sedimentary sections have
been previously constructed by splicing across recovery gaps the 9.5-m-long hydraulic piston cores retrieved in adjacent
holes from the same site [Murray and Prell, 1991; Farrell and
Janecek, 1991, respectively]. Sedimentological data
(proportion of fraction > 150 gm obtained by wet-sieving and
CaCO3 content) and oxygen isotope data obtained on
planktonic foraminifera were also taken from Murray and Prell
[ 1991 ] and Farrell and Janecek [ 1991 ].
In the SEYMAMA cores, sediments were sampled at a 10-cm
interval. Carbonate content was measured on cores
MD900938, MD900949, and MD900963 using a modified "Bernard calcimeter." We estimated the accuracy of the method
610
ß 70 ßI
8o ßI
9o ßI
looo 1000 Km. I Site 72: •Oo 0 lO' [ODP Site 7581 SOMALI BASIN SEYCHELL MADINGLEYMAS
BASIN CENTRAL INDIAN BASIN (5Figure
1. Location
map
showing
positions
of SEYMAMA
giant
piston
cores
and
Ocean
Drilling
Program
(ODP) sites
used
in this study.
Bathymetric
contours
are in meters.
Note that identification
numbers
of
SEYMAMA cores
were shortened
in this figure
for convenience
(e.g.,
MD938 instead
of MD900938).
Table 1. Location and Water Dept of Piston Cores
Retrieved
During the SEYMANA Cruise of the French
R/V Marion Dufresene
in the Equatorial
Indian Ocean,
and
of Ocean
Drilling Program
Site 572 (Equatorial
Pacific),
and 722 and 758 (Tropical Indian Ocean)
Cores/Sites Latitude Longitude WaterDepth, m MD900938 04ø57'90" S 60ø04'44" E 3430 MD900940 05033'53" S 61ø40'12" E 3190 MD900949 02005'43" N 76ø06'96" E 3700 MD900963 05003'30" N 73ø52'60" E 2446 ODP site 722 16037'30" N 59047'80" E 2030 ODP site 758 05023'05" N 90021'67" E 2925 ODP site 572 01026'09" N 113050'52" W 3900
to be within + 2-3% for carbonate contents ranging from 50 to 100%. Coarse fraction contents were obtained in all
SEYMAMA cores through wet-sieving over a 63-pm mesh
sieve. In core MD900938, we also measured relative
abundances of the > 250- and >350-I.tm fractions to test if there
are important differences in the interpretation of coarse
fraction records based on a different size. It is important toaddress correctly this point, since we will compare > 150-pm
grain size records
(sites 722 and 758) with > 63-pm records
(SEYMAMA cores).In cores MD900938, MD900949, and MD900963, we subsieved the fraction coarser than 63 pm using a 250-pm and a
355-pm mesh sieve in order to isolate large foraminifera
for
later stable isotopic studies. In these three cores, we examined
the fragmentation
of planktonic
foraminifera
in the 250- to
355-pm size fraction. Results
are expressed
in the form of a
"preservation
index" calculated
as the percentage
of whole
582 BASSINOT ET AL.: COARSE FRACTION RECORD OF PELAGIC CARBONATE
foraminifera to fragments plus whole foraminifera. In core MD900938 and MD900949, fragmentation was measured at 20-cm intervals, and in core MD900963 it was measured at 10-
cm intervals.
Foraminiferal fragmentation is one of the most reliable indices of carbonate dissolution [Bd et al., 1975; Thunell, 1976; Peterson and Prell, 1985b; Le and Shackleton, 1992]. The large size of particles in the 250- to 355-gm size fraction makes the counting of fragments a relatively easy task to perform. However, we were aware that foraminiferal fragments
in such a small size range may not be numerous enough to get a good statistical measure of dissolution intensity. In core MD900938, to test the sensitivity of our index, we compared
results obtained in the 250- to 355-gm size fraction with fragmentation measured in the > 150-gm size fraction, since
this latter fraction is the most commonly used in foraminiferal
fragmentation studies [e.g., Peterson and Prell, 1985b]. In core MD900963, oxygen stable isotopes were measured at the isotope geochemistry laboratory of the Centre des Faibles Radioactivit6s, Gif-sur-Yvette, France, on the
planktonic foraminifera Globigerinoides ruber (white) picked from the 250- to 355-gm size fraction. The mass spectrometer
is a Finnigan MAT-251 model with an automated carbonate preparation system (individual reaction chambers device). The data are all reported with respect to the Pee Dee belemnite
standard. (Carbonate content, grain size, foraminifer frag-
ments, and •5•80 data are available in the Calcium Carbonate Database, National Geophysical Data Center, Boulder, Colorado, at paleo@mail.ngdc.noaa.gov).
Paleomagnetic measurements were performed on standard
cubes (8 cm
3) every 75 cm along core MD900963, with the
mean sampling interval then reduced to about 12 cm around the Brunhes/Matuyama magnetic reversal. The measurements and stepwise demagnetizations of the natural remanent magnetization (NRM) were performed within the shielded room of the Institut de Physique du Globe de Paris, France. NRM values are low but declination is interpretable.In the uppermost 10 m of core MD900963, organic carbon
measurements were carried out at intervals of 10 cm at the
Department of Geoscience of the University of Bremen, Germany, using a Carbone-Hydrogen-Nitrogen analyzer. Sample preparation and technical details are described elsewhere [Maller et al., 1994].
Chronological Framework
Chronological Framework Based on Biostratigraphy and Magnetostratigraphy
At all sites, we were able to develop a coarse chronological framework for the past 2500 kyr based on magnetic reversal stratigraphy and/or calcareous microfossil events (Table 2).
Table 2. Calcareous
Microfossil Datums and Magnetostratigraphic
Events Used for the
Depth-to-Time Conversions in SEYMANA Cores MD900938, MD900940, MD900949,
and MD900963, and ODP Sites 722 and 758
Stratigraphic Events Age, MD938, MD940, MD949, MD963, Site 722, Site 758,
Ma m m m m m m
Acme Emiliania huxleyi FO Emiliania huxleyi
LO Pseudoemiliania lacunosa
Brunhes/Matuyama LO Reticulofenestra asanoi Top Jaramillo
Rejuven. Gephyrocapsa oceanica
Base Jaramillo
LO large Gephyrocapsa oceanica LO Helicosphaera sellii LO Calcidiscus rnacintyrei FO Gephyrocapsa oceanica LO Globigerinoides fistulosus Top Olduvai LO Discoaster brouweri LO Discoaster assymetricus Matuyama/Gauss 0.073 (1) ... 3.80 ...
0.28 (1)
71'5
...
0.47 (1)
7'•'5
6'.¾5 1•i•5
2i'30
18.90
...
0.78 (2) ... 35.10 28.00 12.170.88 (3)
1•'•5
11.15 2•i•5
38.38
...
0.99 (2) ... 15.57 1.028 (4) 15.95 12.55 25.71 ... 1.07 (2) ... 40.35 16.771.24 (4)
18.06 1
• i 5
3(•
• 5
...
1.47 (4)
19.17 17.71 35.00 4i'•9
...
1.59 (4)
20.62 18.56
41.09 5•'}5
...
1.67 (4) ... 41.09 ... 1.73 (5) ... 41.20 ... 1.77 (2) 41.20 ...1.95 (4)
2z[i•5 2(•i•5
51.00 6•'}0
...
2.26 (6) 29.45 ...2.60 (2)
...
89.40
Biostratigraphic analyses for SEYMAMA cores were performed at the Laboratoire de G6ologie du Quaternaire (Centre National
de la Recherche Scientifique, Marseille, France); biostratigraphic and magnetostratigraphic events for ODP sites are from the
shipboard parties of legs 117 and 121, respectively [Peirce et al., 1991; Prell et al., 1991 ]. Depth positions in the final, spliced depth scales of sites 722 and 758 were taken from Murray and Prell [1991] and Farrell and Janecek [1991], respectively. FO, first
occurrence, LO, last occurrence. Ages are (1) from Berggren et al. [1985], (2) from Shackleton et al. [1990], (3) from Wei [1993],
(4) from Raffi et al. [1993], (5) estimated according to the disappearance of G. fistulosus at site 677 and the orbital chronology developed at this site by Shackleton et al. [1990], and (6) calculated by linear interpolation between ages of magnetic reversals from Shackleton et al. [1990] with position of the datum given by Berggren et al. [1985].
For sites 722 and 758, biostratigraphic and magnetostratigraphic events are those determined during
shipboard analysis. Positions of these selected stratigraphic
events in the spliced depth scale are given by Murray and Prell [ 1991 ] and Farrell and Janecek [ 1991 ]. In the SEYMAMA cores, the positions of calcareous microfossil events have
been determined with a 10-cm sampling interval. The
Brunhes/Matuyama magnetic polarity reversal has been identified in core MD900963 at a depth of 35 _+ 0.3 m.
Time-to-depth conversions (Figure 2) were performed by assuming constant sedimentation rates between control points (Table 2). Ages of magnetic reversals are from estimates by Shackleton et al. [1990]. Ages of calcareous nannofossil
events are derived from recent calibration of nannofossil
biostratigraphy to oxygen isotope stratigraphies [Raffi et al.,
1993; Wei, 1993]. Some nannofossil events have been shown
to be diachronous between low- and mid-latitude sites [Raffi et
al., 1993]. Because we are dealing with low-latitude sites in this paper, we use age estimates based on calibration to
20 40 0 0.5 2.0 2.5
Age (Ma)
.0 1.5 , , , , , , , , , , , , , , , 60 i i , --s-- MD900940I -"•"'
MD900949
•D900963 , , . c . . -'l - -1- - 1 2 345 6 789 10 11Figure 2. Age-depth plots showing sedimentation rates in
cores MD900938 and MD900940 (Madingley Rise, western
equatorial Indian Ocean) and in cores MD900949 and
MD900963 (central equatorial Indian Ocean): 1, first occurrence (FO) Erniliania huxleyi; 2, last occurrence (LO) Pseudoemiliania lacunosa; 3, Brunhes/Matuyama reversal; 4,
LO Reticulofenestra asano•'; 5, rejuvenation of large Gephyrocapsa oceanica; 6, decrease of the abundance in large G. oceanica; 7, LO Helicosphaera sellii; 8, LO Calcidiscus rnacintyrei; 9, LO Globigerinoides fistulosus; 10, LO
Discoaster brouweri; 11, LO Discoaster assymetricus.
oxygen isotope stratigraphy from Ocean Drilling Program (ODP) site 677. The last occurrence of Globigerinoides fistulosus occurs in the oxygen isotopic stage 61 (at 70.6 m)
in site 677 and is dated at 1.73 Ma based on the orbitally
derived chronology developed at this site by Shackleton et al.
[ 1990]. Depth-age curves for the SEYMAMA cores are shown in Figure 2.
The depositional history of core MD900963 records a major hiatus at about 41 m (Figure 2), as shown by the concomitant disappearance at this level of Helicosphaera sellii, Calcidiscus rnacintyrei, and G. fistulosus and by the first appearance of Gephyrocapsa oceanica. The ages of these biostratigraphic datums span the time interval from 1.73 Ma to 1.47 Ma, which gives the minimum duration of the hiatus. We interpret, however, the hiatus as spanning 770,000 years between 1.73 Ma at its base (dated by the last occurrence of G. fistulosus) and 0.96 Ma at its top (dated by extrapolating downcore the sedimentation rates calculated between the Brunhes/Matuyama reversal and the last occurrence of Reticulofenestra asanoi).
In core MD900938, a step in the depth-age curve is observed between the last occurrence of H. sellii (1.47 Ma at 19.17 m) and the disappearance of large Gephyrocapsa oceanica (1.24 Ma at 18.06 m) (Figure 2). It is unlikely that there is continuous sedimentation in this short depth interval. We interpret this interval as containing a hiatus at about 18.60 m, spanning almost totally the time interval (230,000 years) between the two biostratigraphic events (Figure 2).
Oxygen Isotope Stratigraphy and Orbital Chronology
We constructed more detailed age models based on
planktonic foraminiferal 6180 in SEYMAMA core MD900963
and ODP sites 722 and 758. These age models will permit more precise intersite comparisons of the coarse fraction records from these three series. The chronology for these isotopic age models was developed from site 677 [Shackleton et al., 1990]. Thus age models from sites 722 and 758 differ from those
proposed by Murray and Prell [1991] and Farrel and Janecek [1991], respectively, which rested upon correlation to the
SPECMAP curve [Imbrie et al., 1984] and to the orbitally tuned record from ODP site 607 [Ruddirnan et al., 1989].
We aligned
features
in our 6180 records
with features
in the
site 677 record using the program "LINAGE" developed by D.Paillard and L. Labeyrie at the Centre des Faibles
Radioactivit6s. In our correlation processes,
the 61sO
transitions (stage boundaries) were given higher priorities than the centers of glacials and interglacials. The
sedimentation rates are assumed to be constant between
selected age control points and to change more or less abruptly
at these control points. Such an assumption is probably quite correct when control points correspond to isotopic
transitions, where environmental changes are supposed to affect the sedimentation rates decisively. Furthermore, as
stated recently by Le and Shackleton [1992], locating a rapid change with a large amplitude (stage boundary) is probably
more accurate than positioning a peak or trough with considerable width and small amplitude in comparison with analytical noise (centers of glacials or interglacials).
Correlations are easy in the Brunhes chronozones because of the characteristic glacial-interglacial 100-kyr cycles. In the
584 BASSINOT ET AL.: COARSE FRACTION RECORD OF PELAGIC CARBONATE
early Pleistocene,
however, the low-amplitude
41-kyr õ•80
cycles typical of this time interval [e.g., Prell, 1982; Ruddiman et al., 1986] are much more difficult to correlate withconfidence. In this interval, the base of the Jaramillo
subchronozone, recognized at sites 722 and 758, provides an
additional control point for ensuring intersite õ•80 correlations.
Results and Discussion
Coarse Fraction Records From the Equatorial
Indian Ocean and Carbonate Dissolution
Fluctuations
Except for a few ash layers encountered at site 758 [œ'arrell
and Janecek, 1991], carbonate contents range roughly from
about 40 to 80% in cores MD900949 and MD900963 and in
sites 722 and 758 (Figure 3). Core MD900938 shows higher carbonate contents, ranging from about 80 to 95%. Sediments mainly consist of calcareous nannofossil oozes with varying
amounts of foraminifera. Sediments retrieved at site 722 and
core MD900963, however, are not "typical" open sea pelagic carbonates. Site 722 was cored in an area strongly affected by
monsoonal winds and is close to the Arabian coast.
Consequently, carbonate contents reflect the dilution by terrigeneous material, largely eolian in origin, coming from nearby arid land masses [Murray and Prell, 1991]. Core
MD900963 was retrieved on the eastern shoulder of the
Maldives Ridge. Besides calcareous planktonic particles, the
sediments at this location also contain bank-derived aragonite needles (aragonite content averages 8% with a standard
deviation of 10% (G. Haddad, personal communication, 1992))
which are typical of periplatform carbonate deposits [e.g., Kier
and Pilkey, 1971; Schlager and James, 1978; Droxler et al.,
1983, 1990; Boardman and Neumann, 1984].
Coarse fraction records from all sites are plotted versus age for the last 2500 kyr (Figure 4). Ages are those derived from biostratigraphic and magnetostratigraphic age models (Table 2). In sediments older than about 1500 ka, grain size varied with only low amplitudes. The fluctuations do not appear to be easily correlatable among all the sites (except between cores
MD900938 and MD900940, which were retrieved about 100
km apart on Madingley Rise (Figure 1 and Table 1)). At about
1300-1500 ka, coarse fraction records show the onset of a
high-amplitude, long-term oscillation. Minima and maxima of
this oscillation appear to be roughly correlatable across the entire tropical Indian Ocean. Minima are centered at about 300-
500 ka and 900-1000 ka, and maxima are centered at about 100-200 ka, 700-800 ka, and 1100-1300 ka.
The coarse fraction from these sediments consists almost
exclusively of sand-sized foraminifera (radiolarians are usually < 10%). Past changes in the coarse fraction abundance in these sediments may reflect (1) ecological factors, such as past changes in the mean size of foraminifera or changes in the foraminifera to nannofossils ratio [Briggs etal., 1985; Mienerr and Bloemendal, 1989], or (2) sedimentological factors, such as carbonate dissolution [Berger etal., 1982;
Peterson and Prell, 1985b], changes in the winnowing
intensity at the seafloor which preferentially removes fines and leaves coarse particles [Wu and Berger, 1991; Mayer etal., 1993], or changes in dilution by fine-grained, nonbiogenic particles.
A positive relationship between coarse fraction content and foraminiferal preservation has been previously observed at site 758 [Chen and Farrell, 1991], thus clearly arguing for a control by carbonate dissolution. We examined the fragmentation of planktonic foraminifera in the 250- to 355-[tm size fraction in
cores MD900938, MD900949, and MD900963. In core
MD900938, fragmentation was also measured in the >150 gm fraction. The strong correlation between our preservation
o 500 1 ooo 1500 2000 2500 MD900938 (3430 m) Carbonate (%) 80 90 100 30 i ! . Hiatus Site 722 MD900949 MD900963 Site 758 (2030 m) (3700 m) (2446 m) (2925 m)
Carbonate (%) Carbonate (%) Carbonate (%) Carbonate (%)
60 90 30 60 90 30 60 90 40 60 80
Figure 3. Plots of carbonate contents versus age for cores MD900938 and MD900940 (Madingley Rise, western equatorial Indian Ocean), cores MD900949 and MD900963 (Maidives area, central equatorial Indian Ocean), and sites 722 (Owen Ridge, Arabian Sea) and 758 (Ninetyeast Ridge, eastern equatorial Indian Ocean). Carbonate contents data from sites 722 and 758 are from Murray and Prell [1991] and Farrell and Janecek [ 1991 ], respectively.
5OO 1 ooo 1500 2000 2500 MD900938 (3430 m) > 63/Jm (%) 0 2O 4O Hiatus MD900940 Site 722 MD900949 MD900963 (3190 m) (2030 m) (3700 m) (2446 m) > 63 prn (%) > 150 prn (%) > 63 prn (%) > 63 prn (%) 0 20 40 0 10 20 0 10 20 30 0 20 40 Site 758 (2925 m) > 150 prn (%) 0 10 20
Figure 4. Plots of coarse fraction contents versus age for cores MD900938 and MD900940 (Madingley Rise, western equatorial Indian Ocean), cores MD900949 and MD900963 (Maidives area, central equatorial Indian Ocean), and sites 722 (Owen Ridge, Arabian Sea) and 758 (Ninetyeast Ridge, eastern equatorial Indian Ocean). Coarse fraction data from sites 722 and 758 are from Murray and Prell [1991] and Farrell and Janecek
[ 1991 ], respectively.
index (measured in the 250- to 355-gm fraction) and the index measured in the >150-gm fraction (Figure 5) indicates that our preservation index is a valuable tool for estimating carbonate preservation/dissolution despite the smaller size range of the 250- to 355-gm fraction and the relatively low number of fragments it contains compared to the >150-gm fraction.
A good relationship can be seen in Figures 6 and 7 between
coarse fraction content and foraminiferal preservation in cores
MD900938, MD900949, and MD900963 (despite the fact that the sampling resolution of the foraminiferal fragmentation
analyses in cores MD900938 and MD900949 is lower than the
sampling resolution of the grain size analyses). This
Preservation index (%) 0 20 40 60 80 ß " - I . I .
200
--i.;':-:-::.--
400"•"
:'.i'-
""
800 1000 - 1 oo -o 80õE 6ø
40
o Preservation index 250-355/•m (%)Figure 5. (left) Plots of carbonate preservation indices versus age for core MD900938 over the last 1000
kyr. Whole foraminifera/whole
foraminifera
plus foraminiferal
fragments,
in percentages,
measured
in the 250-
to 355-gm
size fraction
(dashed
line) and the > 150-gm
size fraction
(solid
line). (right)
Plot of the >150-gm
preservation
index
(PI) versus
the 250- to 355-gm
index.
In the samples
studied
there
appears
to be a strong
586 BASSINOT ET AL.: COARSE FRACTION RECORD OF PELAGIC CARBONATE
MD900938
Foraminifer > 63 •m preservation (%) W/W+F (%) 0 20 30 60 90 o 500 1 1500MD900949
Foraminifer > 63 prn preservation (%) W/W+F (%) 20 o 40 80MD900963
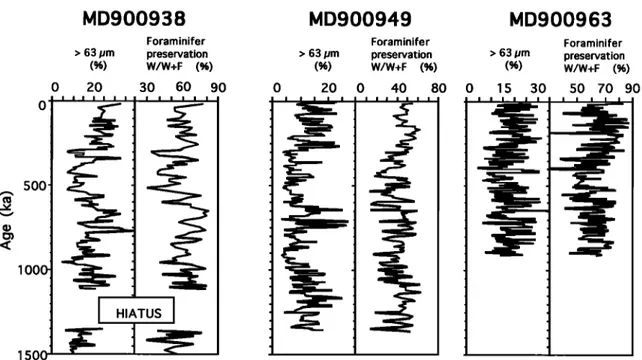
Foraminifer > 63 pm preservation (%) W/W+F (%) 0 15 30 50 70 90Figure 6. Coarse fraction content (> 63 I. tm) and foraminiferal preservation index (calculated as the percentage of whole foraminifera (W) to fragments plus whole foraminifera (W+F)) for SEYMAMA cores MD900938, MD900949, and MD900963. The good visual correlation between the two curves suggests that most of the changes in grain size, and especially the long-term oscillations observed in Figure 4, are controlled by carbonate dissolution.
relationship is particularly clear in the two shallowest cores MD900938 (3430 m) and MD900963 (2446 m). Because dissolution becomes a more dominant sedimentary process as water depth increases, we expected to find the strongest relationship between foraminiferal fragmentation and coarse fraction content in core MD900949, which is the deepest SEYMAMA section studied (3700 m). Surprisingly, the correlation is less obvious in this core, although it is still noticeable. The following scenario could well explain such results: In the early stages of dissolution (little loss of carbonate and shallow water depths), foraminiferal fragmentation results in a net transfer of material from the coarse to the fine fractions, whereas there is only a little loss of the finest particles through total dissolution. Thus grain size changes and foraminiferal fragmentation are strongly related. With increasing water depth, as loss of carbonate becomes more important, grain size distribution results from two processes that act in opposite directions: foraminiferal fragmentation tends to enrich the finest size fractions relative
to the coarser ones, whereas at the same time, increased
dissolution of the finest particles tends to reduce significantly
the relative contribution of the fine fraction to the total
sediment. This significant loss of the finest fraction may well explain the loose relationship between foraminiferal fragmentation and the coarse fraction content at great depths. The intersite comparison between the different coarse fraction curves (Figure 4) clearly shows that the same long- term signal is recorded whatever the coarse size fraction (> 63 gm in SEYMAMA cores and >150 I. tm in ODP sites). In core MD900938, we studied the relative weight contributions of the >63-I. tm, >250-I. tm, and >355-I. tm fractions to the total
sediment. Our data confirm that changes in grain size composition mainly result from variations in the relative importance of the finest and coarsest end-members (<63 I. tm and >355 I. tm), whereas the relative abundances of intermediate fractions (63-250 I. tm and 250-355 !.tm) show little change (Figure 8). Thus grain size changes controlled by carbonate dissolution imply a net transfer of foraminiferal fragments
from the coarsest fractions to the finest ones. In the
intermediate fractions, as suggested by Berger et al. [1982], weight losses due to the transfer of small fragments to the finer fractions were almost balanced by gains due to large fragments coming from the coarser fractions. Thus when dissolution increases, the number of fragments in intermediate fractions increases, although the weight contribution of these fractions to the total sediment does not change significantly.
Records from core MD900938, and more particularly from core MD900963, show that not only the long-term oscillation but also the higher-frequency fluctuations in coarse fraction content are mimicked by the preservation index (Figures 6 and 7). The high-resolution age models developed at sites 722 and
758 allow us to test if the higher-frequency fluctuations in
coarse fraction records are correlatable among these sites. Over the last 1000 kyr, the two coarse fraction curves bear a strong resemblance when plotted versus age (Figure 9 (middle)). Not only the large-scale fluctuations but also most of the smaller-scale changes (occurring at glacial-interglacial and higher frequencies) are correlatable among these two
remote sites. Before about 1000 ka, however, correlations are
usually poorer, with intervals where the grain size signals appear almost anticorrelated (see below for discussion). We have no detailed foraminiferal fragmentation records for sites
Sand fraction (ø,6) 5 10 15 20 2530 35 40 2OO 400 6OO 80O 1 ooo I I
3o .o
oo
Foraminifer preservation (W/W+F (%))Figure 7. Superimposition of coarse fraction content (> 63 gm) and preservation index measured in core MD900963 shows that not only the long-term oscillation (see also Figures 4 and 6) but also the high-frequency changes in the coarse fraction record are controlled by changes in carbonate dissolution/preservation.
722 and 758. Nevertheless, a positive relationship has been
observed between coarse fraction content and foraminiferal
preservation at site 758 [Chen and Farrell, 1991] and in piston
core RC27-61 retrieved in the vicinity of site 722 (Murray and Prell, 1992). Furthermore, sites 722 and 758 lie in very different environments, some 3700 km apart (Figure 1 and Table 1); thus it is unlikely that changes in surface
productivity, dilution by nonbiogenic material, or winnowing
at the seafloor could explain such an impressive, long-distance correlation of coarse fraction records over the last 1000 kyr. As concluded for the long-term oscillation, these regionally correlatable "high-frequency" changes in grain size are most probably controlled by carbonate dissolution pulses. In the late Pleistocene, the coarse fraction changes are consistent with the "classical" Indo-Pacific dissolution pattern [Berger, 1973; Volat et al., 1980; Vincent, 1985], showing increased carbonate dissolution (coarse fraction minima) during
interglacial intervals and enhanced carbonate preservation
(coarse fraction maxima) during glacial intervals (Figure 9). However, the dissolution/preservation pattern is not a simple glacial-interglacial dichotomy. In many intervals, the coarse fraction cycles appear slightly shifted with respect to the glacial-interglacial cycles, in agreement with observations
made in deep-sea carbonate records [e.g., Luz and Shackleton,
1975; Moore et al., 1977; Peterson and Prell, 1985a; Farrell and Prell, 1989]. 2OO 400 < 600 800 1000 Proportion (%) 20 40 60 80 1 O0 63 pm ... 250 pm 355 pm
Figure 8. Abundance distribution of size classes as a function of age in core MD900938. We measured the weight percent of the >63-gm fraction (thick solid line), we subsieved this sand fraction to measure the weight percent of the > 250- gm fraction (dashed line), and finally we measured the weight contribution of the > 355-!.tm fraction by subsieving the > 250-gm fraction (thin solid line).
As noted above, although the correlation between coarse fraction records of sites 722 and 758 is fairly good, there are noticeable differences in these records. These discrepancies are especially noteworthy in the early Pleistocene. Between about 1100 ka and 1250 ka, for instance, the two grain size curves appear almost completely anticorrelated (Figure 9, (middle)). Prior to about 900 ka, the lack of large-amplitude 100-kyr glacial-interglacial oscillations in carbonate dissolution (which dominate the grain size records of sites 722 and 758 in the late Pleistocene) may explain why small-amplitude, local grain size changes are able to perturb more efficiently the
regional (global) signal. Also, in the early Pleistocene, we
cannot rule out the possibility that discrepancies between grain size records may result from inaccuracies in our age models, which rest upon the intersite correlation of low-
amplitude
41-kyr 8•80 cycles.
In the late Pleistocene,
however,
there is little doubt concerning
the accuracy
of the 8•80
stratigraphy. Consequently, minor discrepancies between thecoarse fraction records from sites 722 and 758 can be
confidently ascribed to the superimposition of local signals (e.g., winnowing and productivity) on the regionally correlatable dissolution signal.
Unlike grain size records, carbonate contents of sites 722 and 758 cannot be readily correlated (Figure 3). Variations in carbonate content at site 758 (2925-m water depth) primarily reflect changes in surface productivity and terrigeneous input [Farrell and Janecek, 1991], whereas those at site 722 mainly reflect dilution by terrigeneous material and do not reflect
dissolution; for example, low CaCO 3 content observed in
glacial intervals is associated with a good preservation of foraminiferal tests [Murray and Prell, 1991, 1992]. In some areas, carbonate content is a good proxy for carbonate dissolution and can be used for long-distance intersite correlations [e.g., Hays et al., 1969]. However, our
588 BASSINOT ET AL.: COARSE FRACTION RECORD OF PELAGIC CARBONATE 500 1 ooo 1500 0.5
> 150/Jm
(%0)
normalized
Site 722
Site 722
... 0 -0.5 -1.0 -2 -1 0 1 2Composite Coarse
Fraction
Index
curve
3 -1 0 1 2 3 4 - .,. :,_- ß '•'• "222. •,.•: -.. .
BJ 722..•
-•: .. - .•.-.-• z.- .... --- ::•_. .. ... ,.-- __ . ---'-',• ,. 0 -0.5-1.0-1.5 -2.0 ___ ß _- ._ .. .._ ,- .. _ 758 Site 758 Site 758Figure 9. (left) Detailed
8180 records
from sites
722 and 758 [Murray and Prell, 1991; Farrell and Janecek,
1991]. These isotopic records were independently correlated to the orbitally tuned isotopic record from ODP site 677 [Shackleton et al., 1990]. This age model allows a detailed comparison between coarse fraction records from both sites. (middle) Normalized coarse fraction records from sites 722 and 758. The very good match suggests that not only the long-term oscillation (see also Figures 4 and 6) but also most of the higher- frequency fluctuations are correlatable from the Owen Ridge (Arabian Sea, site 722) to the Ninetyeast Ridge (eastern equatorial Indian Ocean, site 758), some 3700 km away. (right) Composite Coarse Fraction Index
curve (CCFI) obtained by stacking the normalized coarse fraction records. This method tends to diminish local signals and enhance regionally correlatable signals.
observations confirm that it is not always true. In the tropical Indian Ocean, coarse fraction content constitutes a better tool for intersite correlations and appears to be a much more
sensitive indicator of dissolution than carbonate content in
relatively shallow sites (above the lysocline).
The same carbonate dissolution pattern is observed during
the Pleistocene in the Indian Ocean and the Pacific Ocean, with
increased carbonate dissolution during interglacial intervals and enhanced carbonate preservatioo. during glacial intervals [e.g., Volat et al., 1980; Vincent, 1985]. Therefore, some
interoceanic correlations between coarse fraction records
should be possible if global signals have not been masked by local or regional processes. To test the possibility of interoceanic correlations, we selected the Deep Sea Drilling Project (DSDP) site 572 (central equatorial Pacific) in which a good quality coarse fraction record (> 150 •m) and a detailed
8•sO curve
are available
[Farrell, 1991]. We developed
an age
model at site 572 by aligning features of the 8•sO record with
the features
in the orbitally tuned 8•sO record from site 677
[Shackleton et al., 1990]. In Figure 10, the coarse fraction
records from sites 572, 722, and 758 are plotted versus age for
comparison. At every site, coarse fraction contents generally increase during glacial intervals and decrease during interglacial intervals. These fluctuations, which we interpret as reflecting changes in carbonate dissolution, are in agreement
with the Indo-Pacific dissolution-preservation history
observed in deep-sea carbonate content records [Berger, 1973;
Vincent, 1985; Farrell and Prell, 1989]. As was already noted for sites 722 and 758 (see above), in numerous places the
coarse fraction cycles in site 572 appear slightly shifted with respect to the glacial-interglacial cycles: preservation maxima (peaks in the coarse fraction curve) are centered on the intervals of most rapid deglaciation rather than at the glacial maxima (e.g., coarse fraction peaks at about 330 and 420 ka).
Berger and Vincent [1981] have reported such preservation spikes coinciding with deglaciation, in calcareous microfossil assemblages from piston cores of the equatorial Pacific. The preservation spike corresponding to the last deglaciation is
ODP Site 758 (central equat. Indian
•80 (%0) o.)
ODP Site 722
ODP Site 572
(Arabian Sea) (central equat. Pacific)
•8o (%0)
•8o (%0)
100 200 300 400 5OO 6OO 700 800 1 o 1 2 1.5 0.5 -0.5 -1.5 1 0 -1 0 10 20 30 40 0 10 20 30 0 10 20 30Coarse fraction Coarse fraction Coarse fraction
(> 150 pm; %) (> 150 pm; %) (> 150 pm; %) PSI PS II PS III PS IV PS V PS VI PS VII
Figure 10. Coarse
fraction
contents
and •5180
values
plotted
versus
age at ODP sites 758 and 722 (tropical
Indian Ocean) and 572 (equatorial Pacific) for the last 800 kyr (data from Farrell and Janecek [1991], Murray and Prell [1991 ], Farrell [1991], respectively). At all three sites, coarse fractions generally increase during glacial intervals and decrease during interglacial intervals. We interpret this pattern in terms of carbonate dissolution (e.g., increased dissolution during interglacial reduces coarse fraction content through fragmentation of foraminifera). Preservation spikes (PS I, PS II, etc.) at fight are those noted in piston cores of the equatorial Pacific by Berger and Vincent [1981]. Many of these preservation spikes are clearly visible here
in the three coarse fraction records and, as already noted by Berger and Vincent, coincide with deglaciation
590 BASSINOT ET AL.: COARSE FRACTION RECORD OF PELAGIC CARBONATE
considered to be a global phenomenon [Berger, 1977], although Fran•eis et al. [1990] recently suggested that this preservation spike is limited to the Atlantic Ocean.
Construction of a Composite Coarse Fraction Index Curve for the Tropical Indian Ocean
Coarse fraction records from sites 722 and 758 were
normalized and linearly interpolated at a regular 2-kyr time interval (Figure 9 (middle)). We stacked these normalized coarse fraction curves to produce a reference coarse fraction record in which local signals tend to cancel out. The resulting Composite Coarse Fraction Index curve (CCFI) is shown in Figure 9 (right) and the values are given in Appendix Table
A I•. (The CCFI used in this paper corresponds to the
Composite Grain Size Index (CGSI) used in previously published studies [Bassinot, 1993a, b; Bassinot et al., 1992]. Although this terminology change may introduce some confusion, it is more proper to use the term "coarse fraction" (rather than "grain size") to refer to one distinct size fraction obtained by wet sieving).
Peterson and Prell [ 1985a] have provided a 800-kyr record of
bathymetric and temporal variations of carbonate preservation
in the equatorial Indian Ocean. They used a quantitatively
defined Composite Dissolution Index (CDI) measured on a set of 7 piston cores retrieved from water depths of 2900 m to 4400 m on the Ninetyeast Ridge near 6øS. Core V34-53 was given special attention because of its sensitive location (3812
m) near the depth of the present-day foraminiferal and hydrographic lysoclines in the equatorial Indian Ocean (3800
m). For intercomparison between our CCFI curve and the CDI curve from core V34-53, we had to modify the initial age model
developed by Peterson and Prell [1985a]. This age model rested upon the correlation of the 8•80 record from core V34-53 to the SPECMAP stack [lmbrie et al., 1984]. The orbital chronology
developed from site 677 introduces three additional
precessional cycles in isotopic stages 17 and 18 compared to the SPECMAP solution [Shackleton et al., 1990]. The new age
model for core V34-53 was developed
by correlating
the 8•80
record of core V34-53 (data from Peterson and Prell [1985a]) tothe orbitally tuned 8•O record from site 677 [Shackleton et al., 1990] using the program "LINAGE".
There is a generally excellent match between our CCFI curve and the CDI curve from core V34-53 [Peterson and Prell, 1985a] (Figure 11). Over the interval from about 350 ka to 600
ka, however, low accumulation rates (around 0.5 cm kyr -•) due to intensified dissolution and loss of dissolved carbonate from the sediments tend to smooth the isotopic record from core
V34-53. This smoothed
part of the 8•O record
is difficult to
correlate confidently to the 8•O curve from site 677, which probably explains slight discrepancies (leads/lags) between the CCFI and the CDI records.
Despite these slight discrepancies, the generally good agreement between the CCFI curve and the CDI curve clearly indicates that the CCFI provides a reliable though qualitative record of past changes in carbonate dissolution in the tropical
•Appendix
Table A1 Is available
with entire article on
microfiche. Order from the American Geophysical Union, 2000 Florida Avenue, N.W., Washington, D.C. 20009. Document P94-001; $2.50. Payment must accompany order.
Core V34-53 Composite Dissolution
better
preservation•
increased dissolution -8 -4 0 4 Index 2OO 400 6OO 800 -2 0 2 4Composite Coarse Fraction
Index curve (arbitrary scale)
This study
Figure ll. Comparison of the Composite Coarse Fraction Index curve (CCFI) (this study) with the Composite
Dissolution
Index curve from core V34-53 (Ninetyeast
Ridge)
[Peterson and Prell, 1985a). The impressive match between the two curves demonstrates unambiguously that coarse fraction changes that are correlatable over long distances in the tropical Indian Ocean are controlled by regional (or global) changes in carbonate dissolution. The CCFI curve may be used
as a reference
curve to develop
a "coarse
fraction
stratigraphy"
for the last 1500 kyr.
Indian Ocean. It also extends back in time (to 1500 ka) the
record of dissolution first provided by the CDI record.
Additional high-resolution coarse fraction records are necessary to test the reliability of the CCFI curve over the interval from 900 to 1500 ka. However, over this time
interval, the CCFI curve seems to provide a good reference for
the long-term oscillation.
In deep-sea
carbonate
deposits,
changes
in P wave velocity
parallel changes in coarse fraction content [e.g., Johnson et
al., 1977; Hamilton et al., 1982]. Therefore,
in the tropical
Indian Ocean,
P wave velocity
profiles
can be tied to a precise
stratigraphic and chronostratigraphic framework by
correlating them to the CCFI curve [Bassinet, 1993a, b; Bassinet et al., 1992]. Because of the potential for near-
continuous
measurements
of acoustic velocity on unsplit
cores, "sonostratigraphy" may become a rapid means of
determining
the stratigraphic
position
of core samples
and of
getting some indication of paleoceanographic conditions that prevailed during sediment deposition [Bassinet, 1993a, b;
Magneto-
stratigraphy
680(%o) Coarse
Fraction
Index
(from Site 758)
(arbitrary scale)
0 -1.0 -2.0 -1 0 1 2 3 4 CF Z.O 500 1 ooo
5
CF
5
CF 67
CF 7
CF 8 (CF 9)9
CF
10
11 15 CF 13.0 CF 14 CF16 17 CF 18.0 CF 1819
CF
ZO
21 25 31 CF 21-23 37 1500Figure 12. Composite Coarse Fraction Index curve (CCFI) tied into a precise stratigraphic framework using the magnetostratigraphy and isotope stratigraphy of site 758. Major peaks of the CCFI curve have been
labeled
according
to their position
relative
to the/5280
stratigraphy
(see text for details).
In Figure 12, the CCFI curve is shown with the oxygen isotope stratigraphy and the magnetostratigraphy from site 758. In the 0-900 ka interval, we have assigned numbers to major CCFI peaks (i.e., preservation events) based on their
respective
positions
relative to the /5•O stratigraphy.
Peaks
were labeled "CF" followed by the oxygen isotopic stage number in which they reach their maximum. Higher CCFI values are generally observed in glacial intervals (e.g., peaks CF6, CF8, CF10, CF14, and CF16) or are shifted toward early stages of deglaciation (e.g., CF18.0). Nevertheless, peaks alsoappear in some interglacial intervals (e.g., CF5 and CF7).
These latter preservation peaks, which generally have lower maximum values than peaks in adjacent glacial intervals, are bracketed by sharp dissolution events. For instance, the peak CF5, which reaches lower values than peaks CF3.0 and CF6, is bracketed by the important dissolution event that occurs at the transition between oxygen isotope stage 5 and 4 (a global event which has been recognized in the Indo-Pacific Ocean as well as in the Atlantic Ocean [Crowley, 1985]) and a
dissolution event occurring in substage 5.5. In the CCFI record, both dissolution events have roughly the same magnitude, whereas in the CDI record, the dissolution event at
the stage 4/5 transition is much more clearly expressed (Figure
11).
Spectral Analysis of the Composite Coarse
Fraction Index Record
We analyzed the CCFI variability in the frequency domain over the last 900 kyr using the Blackman-Tukey approach with
50% lags [Jenkins and Watts, 1968]. Much of the total
variance in the CCFI record (Figure 13, solid line) occurs in the low-frequency end of the spectrum and is associated with the long-term oscillation. Observations in the time domain over the last 1500 kyr suggest that the long-term oscillation has an irregular cycle length of the order of-500 kyr (Figures 9 and 14). Minima in the CCFI curve (maxima of dissolution) are found approximately at 400 ka, 950 ka, and 1400 ka, and


![Figure 9. (left) Detailed 8180 records from sites 722 and 758 [Murray and Prell, 1991; Farrell and Janecek, 1991]](https://thumb-eu.123doks.com/thumbv2/123doknet/13693039.432622/11.880.143.782.113.888/figure-detailed-records-sites-murray-prell-farrell-janecek.webp)
![Figure 10. Coarse fraction contents and •5180 values plotted versus age at ODP sites 758 and 722 (tropical Indian Ocean) and 572 (equatorial Pacific) for the last 800 kyr (data from Farrell and Janecek [1991], Murray and Prell [1991 ], Farrell](https://thumb-eu.123doks.com/thumbv2/123doknet/13693039.432622/12.891.191.694.478.951/fraction-contents-tropical-equatorial-pacific-farrell-janecek-farrell.webp)

