HAL Id: hal-00361352
https://hal.archives-ouvertes.fr/hal-00361352
Submitted on 25 Aug 2011HAL is a multi-disciplinary open access archive for the deposit and dissemination of sci-entific research documents, whether they are pub-lished or not. The documents may come from teaching and research institutions in France or abroad, or from public or private research centers.
L’archive ouverte pluridisciplinaire HAL, est destinée au dépôt et à la diffusion de documents scientifiques de niveau recherche, publiés ou non, émanant des établissements d’enseignement et de recherche français ou étrangers, des laboratoires publics ou privés.
Experimental analysis of groundwater flow through a
landslide slip surface using natural and artificial water
chemical tracers.
Stéphane Binet, Herve Jomard, Thomas Lebourg, Yves Guglielmi, Emmanuel
Tric, Catherine Bertrand, Jacques Mudry
To cite this version:
Stéphane Binet, Herve Jomard, Thomas Lebourg, Yves Guglielmi, Emmanuel Tric, et al.. Experi-mental analysis of groundwater flow through a landslide slip surface using natural and artificial water chemical tracers.. Hydrological Processes, Wiley, 2007, 21 (25), pp.3463-3472. �10.1002/hyp.6579�. �hal-00361352�
EXPERIMENTAL ANALYSIS OF GROUNDWATER FLOW THROUGH A LANDSLIDE SLIP SURFACE USING NATURAL AND ARTIFICIAL WATER CHEMICAL TRACERS
Binet, Stephane; Jomard, Herve; Lebourg, Thomas,Guglielmi, Yves,Tric, Emmanuel,Bertrand, Catherine
Mudry, Jacques
Keywords: Hydromechanics, tracer test, landslides, slip surface
Abstract
Artificial and natural tracer tests combined with high accurate electronic distancemeter measurements are conducted on a small landslide with a well known slip surface geometry. Outflow yields and chemical contents are monitored for all the experiment duration and they analyzed to estimate the slip surface hydraulic parameters. The main result is that the slip surface acts as a drain for groundwater flows that evacuates interstitial pressures in the slope and brings the sliding mass to be more stable one.
1/ Introduction
Rainfall is one of landslides triggering factors, (Keefer et al., 1987). The water induces movements for two main raisons: (i) infiltration increases water pore pressure on the slip surface and remarkably decreasing shear strengths of the landslide mass (Tsao et al., 2005); (ii) water creates an increase of weight on the slope and destabilizes the mass by loading (Brunsden, 1999). However, during the movement, the slip surface evolution creates a new repartition of fluid pressure that can modify the movement (Cornet et al., 2003) linked with a hydromechanical effect.
Thus, to increase the stability of a landslide mass, drainage wells have been widely used to drain groundwater, but it needs a good understanding of the slope hydrogeology (Bonzanigo
et al., 2001). Water, from the entire slope, can flow in the sliding mass and increase the
complexity of the hydro mechanical coupling, with for example artesian pressure under the instable mass (Jiao & Malone, 2000). At the slope scale, the presence of slip surfaces induces a heterogeneity, where mechanical and hydrogeological properties are modified, that could modifie fluid flow (Eberhardt et al., 2005). The slip zone can create an enhanced hydraulic conductivity along fracture zones and /or create a gouge forming a relatively impervious zone which prevents perpendicular flows (Bonzanigo et al., 2001). The hydrogeological context is an important one to discuss the landslide hazard. In this aims, hydro-geochemical methods, well adapted to moving zone were developed (Guglielmi et al., 2000). This paper proposes an experimental analysis of in-situ hydro-mechanical monitoring. Groundwater flows are characterized, using hydro-geochemical methods. The surface deformation is recorded using a high sensibility geodetic network. The main question is about the influence of a slip surface on flow and the possible consequences for slope stability. Thus, a multi-disciplinary study was performed coupling geoelectrical survey, natural tracer methods and topometric time measurements to locate the 3D sliding surface (Lebourg et al., 2005). An water injection about 40 m3 in 5 hours was realized through the upper slip surfaces, with artificial and natural tracer measurements. Three objectives were fixed: (i) to estimate the hydraulic gradient with geoelectrical survey and tracer tests, (ii) to quantify the hydraulic properties of the slip surface and matrix with back-calculation from tracer tests, and (iii) to estimate the hydromechanical
behavior of the slip surface submitted to an injection, using topometric measurements during the injection.
2/ Description of the site
2.1/ Location
The la Clapière landslide is a large unstable slope, located in the South-eastern part of France, in the Alps, about 80 km North of Nice city. Near the foot of this instable mass, where the N20 draining fault crop out, a more active superficial landslide occurs in a homogeneous material (Fig. 1).
2.2/ Geometry
This landslide is embedded in fluvio-glacial deposits made of heterogeneous blocs. Five perennial spring are located in this area and testify of an important drain zone at the slope scale, (Guglielmi et al., 2000). Scarps and trenches were mapped and highlight a sliding area surrounded by trenches that prove a toppling of the sector including a sliding mass in the central part (Fig. 1).
2.3/ Activity
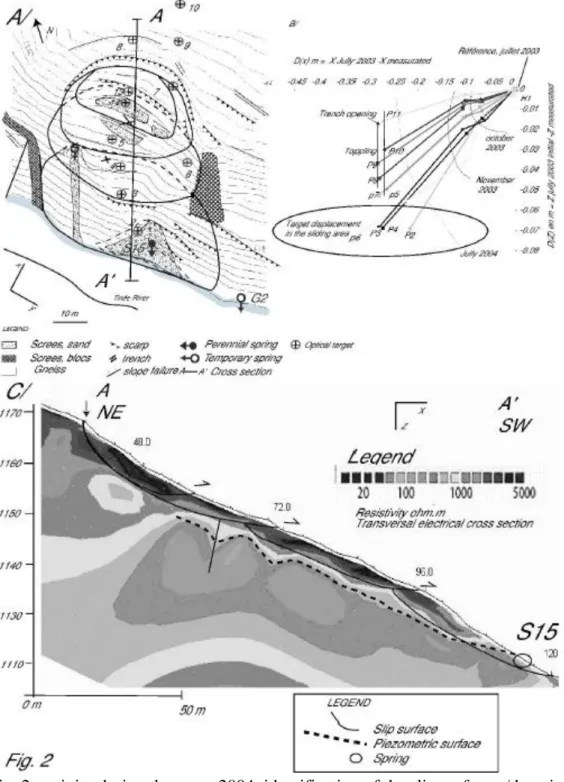
A geodetic network was installed, in order to complete the official network of the Ministry of Equipment, that characterizes the overall landslide activity. After internal and meteorological corrections (Gunzburger et al., 2005), the measurement accuracy is half a centimeter for a one year monitoring. The 2003 relative displacements, in the XZ plan can be grouped in three clusters (Fig. 2b), with differences in the displacements direction. In Fig. 2b, the optical target P6, P3 and P4 have the same evolution, and are located in the same geomorphological unit, Idem the P5 and P7. Between these groups, a discontinuity is necessary to explain the movement heterogeneity and can be interpreted as a slip surface. The interpretation of spatial repartition of the slip surfaces in the map (Fig. 2a) is realized, according to the field geomorphological observations. Three slip surfaces, fitting together, are identified in the area. Out of the sliding mass, the target position evolution records an opening of fractures without elevation decrease, interpreted like trench apertures. The horizontal displacement is greater in the upper part (P3, P4) compared to P2, and suggest a regressive evolution of the landslide to bottom from the top of the slope, with the upper slip surface that cut over the lower one. The geoelectrical cross section (Fig. 2C), presents high resistive superficial zones that correlate exactly with the sliding mass defined with the surface deformation and the geomorphologic structures (Jomard et al., submit). In the upper part, a fourth slip surface is suggested by geo-electrical measurements but do not bear optical target on it.
3/ Methods
The slip surfaces are well defined and spatially located. The methodology presented in this paper is oriented towards the characterization of the hydrogeological behavior of these slip surfaces. On this simple object, ground-water interpretations are validated from geo-electrical and tracer data correlation. The landslide movements, during the injection of water in a slip surface, are monitored with a 0.1 mm accuracy and a 15 min frequency.
3.1/ Protocol of water injection
hours. An artificial tracer (fluorescein) was added to water in the first 15 min of the experiments. Time measurements were realized at the spring S15 that drains the zone. Yield, chemical content and fluorescent tracer content were measured every 15 min.
3.2/ Mapping outflows from the slip surface
During injection, the tacheometer TDA 5005 records with a 15 min frequency measurements the target evolution in the landslide, in aims to observe the reaction induced by the water injection. The data acquisition is similar to the protocol defined by Gunzburger et al. (2005). After the current installation procedure imposed by the constructor (Leica), the position (distance, horizontal and vertical angles) of targets in the moving mass and of reference targets are measured, with four successive iterations.
Data corrections applied to reduce the error range are detailed in Gunzburger et al. (2005). For distance measurements about 150 m, the following corrections are chosen. (i) The internal parameters by conducting both before and after 180° simultaneous rotations of the horizontal and the vertical axes. (ii) External errors are primarily due to the aerial path of the laser beam as its propagation is being influenced by atmospheric conditions which are not homogeneous during the injection. According to the manufacturer’s use instructions, the corrected distance D’p is:
Where and
Dp is the measured distance, p the air pressure (mbar), T the temperature (°C) and h the relative air moisture (%). (iii) The average on four successive measurements decreases the random errors.
3.3/ Tracer test
First, with natural tracing from the 2003 hydrogeological cycle, the natural spatial and temporal variability of the water content was analysed to define the different natural flow way or water type in this slope. (Mudry et al., 1994; Binet et al., 2002) Secondly, water injected has a contrasted water chemical content compared to the chemical content of the spring (Table 1). Water rock or soil interactions are possible with injected water. However, no soil is observed in the injected area and no natural nitrate are observed during the experiment, so nitrate breakthrough is reference. Sulfate and conductivity can increase during underground flow. Both curves will always be compared to nitrates curves to estimate the extant of these reactions.
Thus, injection will induce a dilution at the spring. This dilution enables to estimate the flow velocity within the sliding surface. To determine when a steady state between flow input and output is reached, a chemograph separation was realized. The spring yield can be decomposed as follows (2)
(2) Q = Qs + Qi where Qs is the spring yield before injection and Qi the injected yield (m3/s) Each component has a defined chemical content Cs for the spring and Ci for injected water During the injection, the flux of the spring is expressed by the equation (3).
(3) Q C = Qs Cs + Qi Ci
Computing (2) and (3), Qi arriving to the spring can be expressed (4)
(4) (Mudry, 1987; Massei et al., 2003)
The equation (4) will enable to define the time to reach a steady state and the part of water from aquifer opposed to water from injection outflowing at the spring. Artificial tracers mark the first water molecules arriving at the spring. The interpretation of the breakthrough curves give information about Particular velocity (Vp)
3.4/ Estimations of indirect hydrodynamic parameters
For the estimation, the media is considered as a multi-permeable equivalent porous media with the Darcy law (5) and porosity estimation (6)
(5) where Vd is Darcy velocity (m/s), K Darcy’s hydraulic conductivity (m/s), and I the hydraulic gradient. By definition: Vd = Q / a where Q is the yield (m3/s) at the spring and a the flow section of the spring (m²).
(6) where F is the porosity (%), and Vp (m/s) the velocity of artificial tracer determinated from the time measurements at the inflection point on the rising limb of the breakout curves.
Darcy law (5) and, porosity estimation with equation (7) from data of tracer test are used to estimate global parameters of the entire slope. (Marsily, 1981; Castany, 1982; Gehlin & Hellstrom, 2003; Nelson et al., 2003). The calculated values give an average trend Estimation of hydraulic gradient is realized with geo-electrical data, according to a strong contrast of electrical resistivities between the saturated / unsaturated limit (Fig. 2c). The limit is calibrated with the S15 spring position. The values inferior to 200 ohm m are interpreted like saturated zone and improved with geometric observations.
To validate these methods, data will be compared with hydrogeological literature data estimated with tracer method in the same rocks.
4/ Results
4.1/ Natural spatial variability of the water chemistry
The space variability of the chemical water content around the superficial landslide is presented in Figure. 3. The measurements of magnesium and sulfate (Fig. 3) shows presence of two water families, one with low water content, for the Tinée river and the spring 20, that correspond to superficial water, one with a high chemical content for the spring draining the landslide that correspond to water from the entire slope (Guglielmi et al., 2000). The Time variability of each spring with flood is not enough to explicate such variability. The variability explanation is the presence of two water types. Between these two clusters, the water of piezometers corresponds to a mixing between these two water types. Thus during flood, the G1 temporary spring is also a mixing between deep and superficial water that proves the connection, during flood, between the deep aquifer and the slip surfaces.
4.2/ Outflows after injection
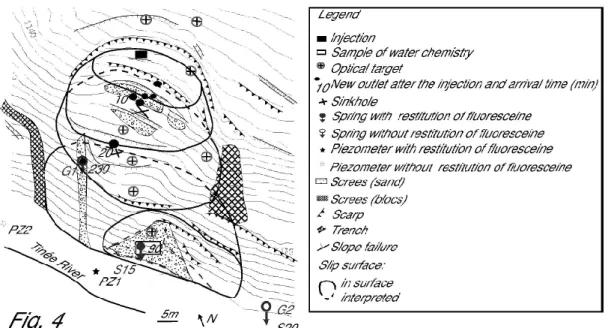
The injection of artificial tracer had created several new outflows of colored water in the landslide. Outflows are located on the slip surface, because spatial correlation is perfect between (i) slip surface outcropping and water outflowing and (ii) water sinkhole and counter- scarps (Fig. 4). The arrival time reveals a quick drainage towards the S15 spring. The water has crossed the landslide in 90 min. Sideways, the flows arrive at the G1 temporal spring 230 min after the injection, displaying a dispersion effect of flows in the slip surface, with a slower velocity of lateral flows.
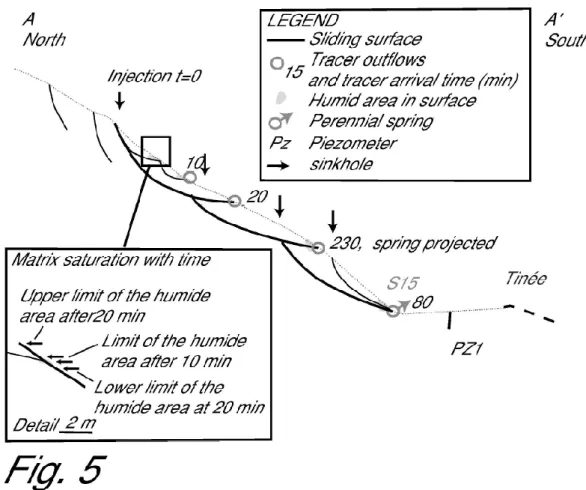
The relation between outflowing and slip surface is confirmed by Fig. 5. Around the slip surface a humid area is developing. This zone increases with time to reach 2 meters upper and lower the slip surface. The matrix is not impermeable and a part of injected water passes in the matrix. This phenomenum occurs after the outflowing in the slip surface. First water arrives from the slip surface, and then humid area, around the slip surface, increases about 1m / 15 min. The slip surface drains the water, but a part of water passes in the matrix. This matrix saturation, around the slip surface, is observed upper the heterogeneity and reveals a
interstitial pressure in the landslide with a local water saturation of the material around the heterogeneity.
4.3/ Time variations after injection
The injected water has a contrasted chemical content compared to water of the slope (Table 1) that enables a hydrograph separation. Thus conductivity and sulfate are natural water tracers of the water from slope and nitrate an injected water tracer. Applying equation (4) the calculated yields of natural water during this artificial flood enables to estimate participation of both water types at the spring. Figure 4 presents the results, for each tracer, that are coherent. The correlation between the three tracers is a proof that the water rock interaction can be neglected with a residence time around 10 hours. The first reaction of the S15 spring is a yield increase due to head transfer. At time t1 (Fig. 6), the injected water reaches the natural saturated zone and creates an increase of yield (pressure transfer). Then at time t2, the tracer arrived at the S15 spring with a velocity (V) and the percentage between slope water
discharge (0.22 L/s) and injected water discharge (2.23 L/s) becomes constant. At t3, the injection is stopped and at t4 the slip surface is drained. From the 38 m3 injected, 24 m3 outflow through the slip surface. The remaining 14 m3 have flowed in alluvial deposits, through the matrix. The environmental tracers enable to calculate, during the pseudo steady-state defined on Fig. 6, that the 0.55 l/s flowing through the S15 spring (Qs) are composed about 0.22 l/s from the injection (Qf), and 0.33l/s from the mixing with natural slope water (Qn). This pseudo-steady state is useful for hydraulic conductivity and porosity estimation. During this pseudo steady state, on the 2.2L/s injected (Qi), 0.22 L/s flow through the slip surface and 0.98 L/s pass in the matrix (Qm).
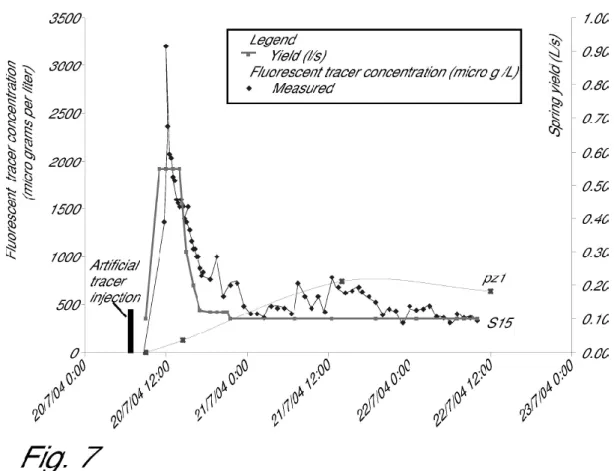
The artificial tracer test proves the connection between the slope aquifer and alluvium aquifer, with presence of tracer in the piezometer 1 and the tracer test breakthrough show a bimodal response (Fig. 7). The first arrivals are the flows in slip surface. The second arrivals are correlated in time with tracer arrival in the borehole and can be attributed to flows in the matrix, with a part outflowing at the spring and the other flowing through the alluviums. The fluorescein restitution shows a mix of water from the fracture and from the matrix and enables to estimate flow velocity in the matrix about 5 10-4m/s and in the slip surface about 3 10-3 m/s.
The restitution ratio of fluorescent tracer is about 15%, compared to the 60 % of restitution ratio for injected water. Like the fluorescent tracer marks the starting of the injection, the first liter injected do not outflow at the spring, but are flowing through the matrix, and highlight the relations between the rock matrix and the slip surface.
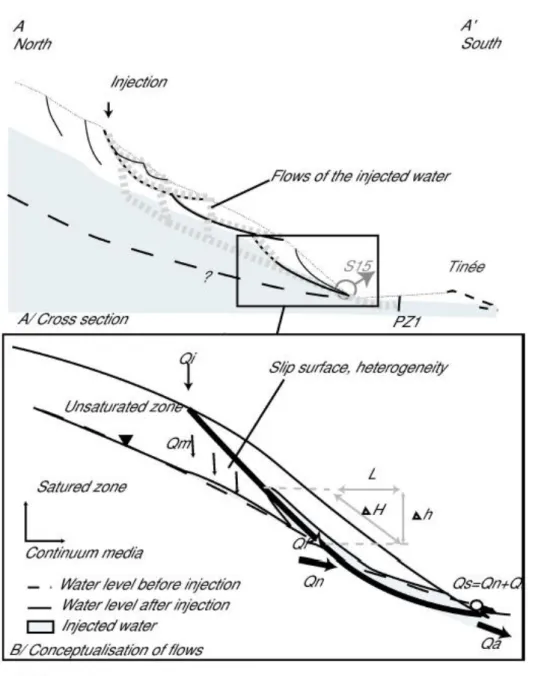
4.4/ Estimation of hydraulic parameters
The obtained results enable to propose a conceptual flow model (Fig. 8) with several flow ways of injected water through slip surfaces and matrix. Yields, estimated with natural tracer, are represented (Fig. 8b) are used to realize an estimation of hydraulic parameters. The method used a hydraulic gradient calculation with the geoelectric cross section. Figure 2c, realized at t3 time (Fig. 6) shows that the 200 Ohm.m limit presents a break when it crosses the slip surface. This observation induces two different hydraulic gradients for flows in the slip surface and in the matrix where the hydraulic gradient is about 32% (±5%) in the sliding mass and about 45% (±5%) in the matrix. During the floods, to connect the slip surface with the slope aquifer, as is observed with the natural tracer (Fig. 3), the hydraulic gradient must equal 45 % and validate the geoelectric data.
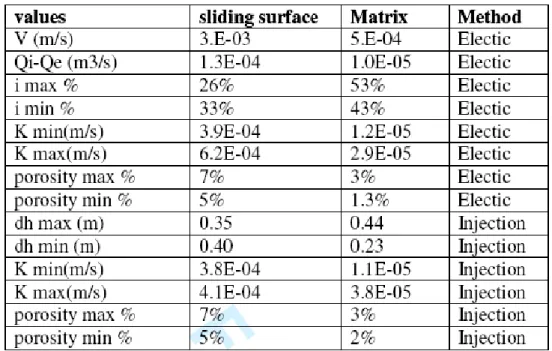
Using flow velocity in matrix and in slip surface and applying equations (6) and (7), the hydrogeological parameters are estimated with a 45% gradient in the matrix and 33 % in the slip area, as presented the Fig. 8B. The section of spring flow is 1.2 m² (±0.1m²) that
corresponds to the humid area observed around the spring S15. The results are presented in table 2 This calculation gives an evolution of hydraulic conductivity about a factor of 20 and a porosity increase about 3%. The results between the two methods are coherent.
5/ Hydro-mechanical behavior of the slip surface 5.1 / Implication for methodology
In such moving zone, local in situ measurements are difficult to perform, because of the durability of boreholes in a moving zone. In the instable fractured slope, the local hydraulic gradient is not representative of the spring flows, because of the heterogeneity of the hydraulic conductivity fields (Guimera & Carrera, 2000). The geoelectrical method, tested to estimate a range of contingent hydraulic conductivity, gives a spatial evolution of the hydraulic gradient and is coherent with literature data on this type of geo-material ranging between 1 and 6 10-5 m/s for the matrix (Guimera & Carrera, 2000; Guglielmi et al., 2005).
5.2/ Estimation of the hydraulic conductivity of the slip surface
The tracer tests demonstrate the existence of two flow types, one in the slip surface and one in the matrix (Fig. 5). The hydraulic conductivity of the slip surface is about 3 104 m/s (±2 10 -4 with head gradient error range) and the matrix hydraulic conductivity is estimated about 2 10-5 m/s (±4 10 -5). The porosity has increased about 2-3% with the slip movement. The slip surfaces are drains. The superficial water after a rainfall flows through the moving mass, and is evacuated by the slip surface. After an important flood at the massif scale, the natural water head increases and can connect the slip surface.
The presence of perched water in the slip surface during the flood, observed with the presence of the G1 temporary springs, can be explained by the hydraulic conductivity contrast, with a ratio about 20. The flows are drained by the heterogeneity that creates a saturated zone around the slip surface, including a part of the matrix that is not impermeable. However, the matrix permeability should be over estimated, because the toppling records with the tacheometer (Fig. 2b) out of the sliding mass reveal a decompressed zone by toppling that modifies the matrix hydraulic parameters with creation of drains for flows.
5.3/ Implication for stability
Infiltration, directly in the slip surface does not induce a movement in this case. The optical target do not record a significant (>0.2 mm) movement during the tracer test injection (Fig. 7), according to the 38 m3 injected on a 500 m² surface. The draining behavior of the fractures evacuates water sufficiently fast to avoid a high pressure increase in the landslide. A local diffuse infiltration in the sliding area can induce an increase of weight by water infiltration in the matrix and can induce movement. At the same time, water in the slip surface can decrease shear parameters. For a superficial landslide, the volume of water infiltrated in the landslide cannot be important, due to the relatively limited surface about 500 m². The last scenario is an infiltration from the upper moving area. Water can induce under pressure in the slip surface that can reactivate this landslide. In this case, the volume of water is clearly bigger, because this zone drains an important part of the slope from 1100 m to 2700 m (Guglielmi et al., 2002). The anisotropic hydraulic conductivity of the slip surface can confine water and increase pressure under the slope. All the presented data here insist on the importance of the global context to make a good risk assessment.
6/ Conclusion
Even if the slip surface is developing in a same material, it plays a role of discontinuity for groundwater flows, with porosity increasing about 3% and permeability about a ratio 20. During injection, a matrix effect is observed around the slip surface, with a saturation of the
matrix. The slip surface drains the flows and diffuses it into the 3D slip surface geometry with a lower velocity. During a flood, the gradient of the slope aquifer, usually around 45%, increases and is connected with the slip surface that brings water under the landslide. However, the slip surface plays a drain role, it evacuated rapidly the interstitial pressures and increases the stability of the slope.
Acknowledgements: We sincerely thanks the French INSU SAMOA program for its financial Support
REFERENCES
Binet, S., Mudry, J. & Guglielmi, Y., 2002. - Toward a methodology to quantify recharge and behaviour of Mediterranean aquifers from ground water measurements. - In: F.Carrasco,
Duran, JJ, Andreo, B (Editor) Symposium: Karst and environnement,Malaga, 115-122.
Bonzanigo, L., Eberhart, E. & Loew, S., 2001. - Hydromechanical factors controlling the creeping Campo Vallemaggia landslide. - Symposium of landslides, Causes, Impacts and
Countermeasures, Davos, 9-12.
Brunsden, D. (1999). - Some geomorphological considerations for the future development of landslide models. - Geomorphology, 30, 13.
Castany, G. (1982). - Hydrogéologie, principes et methodes. -. Dunod, 236.
Cornet, F.H., Li, L., Hulin, J.P., Ippolito, I. & Kurowski, P. (2003). - The hydromechanical behaviour of a fracture: an in situ experimental case study. - International Journal of Rock
Mechanics and Mining Sciences, 40, 1257-1270.
Eberhardt, E., Thuro, K. & Luginbuehl, M. (2005). - Slope instability mechanisms in dipping interbedded conglomerates and weathered marls-the 1999 Rufi landslide, Switzerland. -
Engineering Geology, 77, 35-54.
Gehlin, S.E.A. & Hellstrom, G. (2003). - Influence on thermal response test by groundwater flow in vertical fractures in hard rock. - Renewable Energy, 28, 2221-2238.
Guglielmi, Y., Bertrand, C., Compagnon, F., Follacci, J.P. & Mudry, J. (2000). – Acquisition of water chemistry in a mobile fissured basement massif: its role in the hydrogeological knowledge of the La Clapiere landslide (Mercantour massif, southern Alps, France). - Journal
of Hydrology, 229, 138-148.
Guglielmi, Y., Cappa, F. & Binet, S. (2005). - Coupling between hydrogeology and deformation of mountainous rock slopes: Insights from La Clapière area (Alpes Maritimes). -
Comptes Rendus Geosciences, 337, 1154-1163.
Guglielmi, Y., Vengeon, J.M., Bertrand, C., Mudry, J., Follacci, J.P. & Giraud, A. (2002). - Hydrogeochemistry: an investigation tool to evaluate infitration into large moving rock masses (Case study of the La Clapière and Séchilienne alpine landslides). - Bulletin of
Enginnering Geology and Environnement, 61, 311-324.
Guimera, J. & Carrera, J. (2000). - A comparison of hydraulic and transport parameters measured in low-permeability fractured media. - Journal of Contaminant Hydrology, 41, 261-281.
Gunzburger, Y., Merrien-Soukatchoff, V. & Guglielmi, Y. (2005). - Influence of daily surface temperature fluctuations on rock slope stability: case study of the Rochers de Valabres slope (France). - International Journal of Rock Mechanics and Mining Sciences, 42, 331-342. Jiao, J.J. & Malone, A.W., 2000. - An Hypothesis concerning a confined groundwater zone in slopes of weathered igneous rocks. - In: PCR (Editor) Slope hazards and their prevention, Hong Kong, 165-170.
Jomard, H., Lebourg, T., Binet, S., Tric, E. & Hernandez, M. (submit). - Characterzation of an internal slope movement structure by hydrogeophysical surveying. - Terra Nova.
Keefer, D.K., Wilson, R.C., Mark, R.K., Bradd, E.E., Brown, W.N., Ellen, S.D., Harp, E.L., Wieczoreck, G.F., Alger, C.S. & Zatkin, R.S. (1987). - Real-time landslide warming during heavy rainfall. - Science, 238, 921-925.
Lebourg, T., Binet, S., Tric, E., Jomard, H. & Bedoui, S.E. (2005). - Geophysical survey to estimate the 3D sliding surface and the 4D evolution of the water pressure on a part of a deep seated landslide. - Terra Nova, 17, 399-406.
Marsily, G.d. (1981). - Hydrogéologie quantitative. -. Masson, collection sciences de la Terre. Paris.
Massei, N., Wang, H.Q., Dupont, J.P., Rodet, J. & Laignel, B. (2003). - Assessment of direct transfer and resuspension of particles during turbid floods at a karstic spring. – Journal of
Hydrology, 275, 109-121.
Mudry, J. (1987). - Apport du traçage physico-chimique naturel à la connaissance hydrocinématique des aquifères carbonatés. - Thesis, Université de Franche-Comté, Besançon, 378.
Mudry, J., Lastennet, R., Puig, J. & Blavoux, B. (1994). - Use of natural tracing to understand how an aquifer works. Basic and applied hydrogeological research in French karstic areas. -.
COST 65. Brussels,Belgium, 27-53.
Nelson, N.T., Hu, Q. & Brusseau, M.L. (2003). - Characterizing the contribution of diffusive mass transfer to solute transport in sedimentary aquifer systems at laboratory and field scales. - Journal of Hydrology, 276, 275-286.
Tsao, T.M., Wang, M.K., Chen, M.C., Takeuchi, Y., Matsuura, S. & Ochiai, H. (2005). – A case study of the pore water pressure fluctuation on the slip surface using horizontal borehole works on drainage well. - Engineering Geology, 78, 105-138.
Figures and tables
Fig. 2: activity during the years 2004: identification of the slip surface a/ location of the slip surface, b/ displacement, measured with tacheometer in the (XY) cross section, c/
geophysical cross section at t=0
Fig. 3: Natural tracer variability (2003 hydrological cycle)
Fig. 5: Correlation between slip surface and outflows in cross section
Fig. 8: Conceptualisation of Flows for back-calculation of hydraulics parameters A/ cross section of the slope, B/ conceptualisation