HAL Id: inserm-00726994
https://www.hal.inserm.fr/inserm-00726994
Submitted on 31 Aug 2012
HAL is a multi-disciplinary open access
archive for the deposit and dissemination of
sci-entific research documents, whether they are
pub-lished or not. The documents may come from
teaching and research institutions in France or
abroad, or from public or private research centers.
L’archive ouverte pluridisciplinaire HAL, est
destinée au dépôt et à la diffusion de documents
scientifiques de niveau recherche, publiés ou non,
émanant des établissements d’enseignement et de
recherche français ou étrangers, des laboratoires
publics ou privés.
Clinical and prognostic role of annexin A2 in multiple
myeloma.
Anja Seckinger, Tobias Meiβner, Jérôme Moreaux, Daniela Depeweg, Jens
Hillengass, Katja Hose, Thierry Rème, Angela Rösen-Wolff, Anna Jauch,
Reinhard Schnettler, et al.
To cite this version:
Anja Seckinger, Tobias Meiβner, Jérôme Moreaux, Daniela Depeweg, Jens Hillengass, et al.. Clinical
and prognostic role of annexin A2 in multiple myeloma.. Blood, American Society of Hematology,
2012, 120 (5), pp.1087-94. �10.1182/blood-2012-03-415588�. �inserm-00726994�
doi:10.1182/blood-2012-03-415588
Prepublished online June 15, 2012;
2012 120: 1087-1094
Goldschmidt, Bernard Klein and Dirk Hose
Thierry Rème, Angela Rösen-Wolff, Anna Jauch, Reinhard Schnettler, Volker Ewerbeck, Hartmut
ner, Jérôme Moreaux, Daniela Depeweg, Jens Hillengass, Katja Hose,
β
Anja Seckinger, Tobias Mei
Clinical and prognostic role of annexin A2 in multiple myeloma
http://bloodjournal.hematologylibrary.org/content/120/5/1087.full.html
Updated information and services can be found at:
(1192 articles)
Lymphoid Neoplasia
Articles on similar topics can be found in the following Blood collections
http://bloodjournal.hematologylibrary.org/site/misc/rights.xhtml#repub_requests
Information about reproducing this article in parts or in its entirety may be found online at:
http://bloodjournal.hematologylibrary.org/site/misc/rights.xhtml#reprints
Information about ordering reprints may be found online at:
http://bloodjournal.hematologylibrary.org/site/subscriptions/index.xhtml
Information about subscriptions and ASH membership may be found online at:
Copyright 2011 by The American Society of Hematology; all rights reserved.
Washington DC 20036.
by the American Society of Hematology, 2021 L St, NW, Suite 900,
Blood (print ISSN 0006-4971, online ISSN 1528-0020), is published weekly
personal use only.
For
at UNITE PEDAGOGIQUE MEDICALE on August 31, 2012.
bloodjournal.hematologylibrary.org
LYMPHOID NEOPLASIA
Clinical and prognostic role of annexin A2 in multiple myeloma
Anja Seckinger,1,2Tobias Meiner,1Je´roˆme Moreaux,3,4Daniela Depeweg,5Jens Hillengass,1Katja Hose,1,6
Thierry Re`me,3,4Angela Ro¨sen-Wolff,7Anna Jauch,8Reinhard Schnettler,6Volker Ewerbeck,5Hartmut Goldschmidt,1,2
Bernard Klein,3,4and Dirk Hose1,2
1Medizinische Klinik V, Universita¨tsklinikum Heidelberg, Heidelberg, Germany;2Nationales Centrum fu¨r Tumorerkrankungen, Heidelberg, Germany; 3Centre Hospitalier Universitaire Montpellier, Institute for Research in Biotherapy, Hoˆpital Saint-Eloi, Montpellier, France;4Inserm U1040, Montpellier, France; 5Orthopa¨dische Klinik, Universita¨tsklinikum Heidelberg, Heidelberg, Germany;6Klinik und Poliklinik fu¨r Unfallchirurgie, Universita¨tsklinikum Gieen und Marburg
GmbH, Justus-Liebig-Universita¨t Gieen, Gieen, Germany;7Klinik und Poliklinik fu¨r Kinder und Jugendmedizin, Universita¨tsklinikum Carl Gustav Carus,
Technische Universita¨t Dresden, Dresden, Germany; and8Institut fu¨r Humangenetik, Universita¨t Heidelberg, Heidelberg, Germany
Annexin A2 (ANXA2) promotes myeloma cell growth, reduces apoptosis in my-eloma cell lines, and increases osteoclast formation. ANXA2 has been described in small cohorts of samples as expressed by myeloma cells and cells of the BM microenvironment. To investigate its clini-cal role, we assessed 1148 samples in-cluding independent cohorts of 332 and 701 CD138-purified myeloma cell samples from previously untreated patients to-gether with clinical prognostic factors,
chromosomal aberrations, and gene expression–based high-risk scores, along with expression of ANXA2 in whole BM samples, stromal cells, osteoblasts, oste-oclasts, and BM sera. ANXA2 is ex-pressed in all normal and malignant plasma cell samples. Higher ANXA2 ex-pression in myeloma cells is associated with significantly inferior event-free and overall survival independently of conven-tional prognostic factors and is associ-ated with gene expression–determined
high risk and high proliferation. Within the BM, all cell populations, including osteoblasts, osteoclasts, and stromal cells, express ANXA2. ANXA2 expression is increased significantly in myelomatous versus normal BM serum. ANXA2 exempli-fies an interesting class of targetable bone-remodeling factors expressed by normal and malignant plasma cells and the BM microenvironment that have a significant impact on survival of myeloma patients. (Blood. 2012;120(5):1087-1094)
Introduction
Multiple myeloma is a rarely curable, malignant disease of clonal plasma cells that accumulate in the BM, causing clinical signs and symptoms related to the displacement of normal hematopoiesis, formation of osteolytic bone lesions, and the production of monoclonal protein.1,2 Multiple myeloma cells harbor a high
median number of chromosomal aberrations3-5and multiple changes
in gene expression compared with normal BM plasma cells.6-11The
corresponding myelomatous BM is altered significantly due to factors that are expressed aberrantly by myeloma cells, those that are already expressed by normal plasma cells but present in higher abundance,6,8 and those expressed by a variety of cells of the
(changing) BM microenvironment.9,12-14
One of these factors recently described is annexin A2 (ANXA2), a calcium-dependent, phospholipid-binding member of the annexin family. ANXA2 is interesting in myeloma biology because it has long been known to be be up-regulated in small cohorts of myeloma cell samples compared with normal plasma cells15and in
human myeloma cell lines.16Its receptor, AX2R,17has been shown
recently to be expressed by cell lines and primary myeloma cells, supporting myeloma cell growth and adhesion to stromal cells.18
ANXA2 stimulates angiogenesis,19,20osteoblastic mineralization,21
and proliferation and differentiation of osteoclast precursors.22-24
Despite its seeming biologic relevance in myeloma, nothing is known about the clinical and prognostic significance of ANXA2.
Therefore, in the present study, we investigated the clinical role of ANXA2 in multiple myeloma by assessing its expression and
that of its receptor in 1148 samples, including independent cohorts of 332 and 701 CD138-purified myeloma cells from previously untreated patients, together with clinical prognostic factors, chromo-somal aberrations, and gene expression–based high-risk scores.25-27
We also assessed the expression of ANXA2 in 161 corresponding whole BM samples, 15 mesenchymal stromal cells, 8 osteoblasts, 7 osteoclasts, and 25 BM sera samples.
We found ANXA2 to be expressed in all normal and malignant plasma cell samples. Higher ANXA2 expression in primary myeloma cells was associated with significantly inferior event-free (EFS) and overall survival (OS) independently of conventional prognostic factors and was associated with gene expression– determined high risk (ie, by the University of Arkansas for Medical Sciences score26 and the Intergroupe Francophone du Mye´lome
score25) and proliferation.27Within the BM, all cell populations,
including osteoblasts, osteoclasts, and mesenchymal stromal cells, express ANXA2. On the protein level, ANXA2 expression is increased significantly in myelomatous compared with normal BM serum. As in primary myeloma cells, high ANXA2 expression in the whole BM samples is associated with significantly inferior EFS and OS.
Therefore ANXA2 exemplifies an interesting class of targetable bone-remodeling impacting factors expressed by normal and malignant plasma cells and cells of the BM microenviron-ment, which has a significant impact on survival in multiple myeloma patients.
Submitted March 8, 2012; accepted June 6, 2012. Prepublished online as
Blood First Edition paper, June 15, 2012; DOI 10.1182/blood-2012-03-415588.
The online version of this article contains a data supplement.
The publication costs of this article were defrayed in part by page charge payment. Therefore, and solely to indicate this fact, this article is hereby marked ‘‘advertisement’’ in accordance with 18 USC section 1734.
© 2012 by The American Society of Hematology
1087 BLOOD, 2 AUGUST 2012
䡠
VOLUME 120, NUMBER 5personal use only.
For
at UNITE PEDAGOGIQUE MEDICALE on August 31, 2012.
bloodjournal.hematologylibrary.org
Methods
Patients and healthy donors
Patients presenting with previously untreated multiple myeloma (n⫽ 332) or monoclonal gammopathy of unknown significance (n⫽ 22) at the University Hospitals of Heidelberg and Montpellier and 10 healthy donors were included in the study. The study was approved by the Heidelberg ethics committee (#229/2003 and S-152/2010) after written informed consent in accordance with the Declaration of Helsinki. Patients were diagnosed, staged and response to treatment assessed according to standard criteria.28-30For clinical parameters, see supplemental Table 1 (available on the Blood Web site; see the Supplemental Materials link at the top of the online article). A total of 247 patients underwent frontline high-dose chemotherapy with 200 mg/m2of melphalan and autologous stem cell transplantation. Survival data were validated by an independent cohort of 701 patients treated within the total therapy 2 or 3 protocol, respectively.31,32
Samples
For an overview of samples used, see supplemental Table 2. Normal BM plasma cells and myeloma cells were purified as described previously.6-8 Aliquots of unpurified whole BM of myeloma patients (n⫽ 154) and healthy donors (n⫽ 7) were obtained after NH4lysis.12Alternate aliquots were subjected to FACS sorting (FACSAria; BD Biosciences) in CD3⫹, CD14⫹, CD15⫹, and CD34⫹ cells. Peripheral CD27⫹ memory B cells (n⫽ 11) were FACS sorted as described previously.33The human myeloma cell lines U266, RPMI-8226, LP-1, OPM-2, SK-MM-2, AMO-1, JJN-3, NCI-H929, KMS-12-BM, KMS-11, KMS-12-PE, KMS-18, MM1.S, JIM3, KARPAS-620, L363, and ANBL6 were purchased from the German Collection of Microorganisms and Cell Cultures (Braunschweig, Germany) and ATCC. The XG lines were generated at Inserm U1040 (Montpellier, France).34Polyclonal plasmablastic cells (n⫽ 10), osteoclasts (n ⫽ 7), and mesenchymal stromal cells (n⫽ 15) were generated as described previ-ously.6,35,36Mesenchymal stromal cells (n⫽ 8) were in vitro differentiated into osteoblasts according to published protocols.37
Interphase FISH
For an overview of the FISH probes used (Kreatech Diagnostics), see supplemental Table 2. Analyses were performed on CD138-purified plasma cells as described previously.3The score of Wuilleme et al was used to assess ploidy.38
Gene-expression profiling
Gene-expression profiling was performed as described previously (Heidelberg-Montpellier [HM] group)6-8,27 using U133 Version 2.0 plus arrays according to the manufacturer’s instructions (Affymetrix). Expres-sion data were deposited in ArrayExpress under the accesExpres-sion numbers E-MTAB-317 and E-TABM-1138 and in the Gene Expression Omnibus as GSE24080 (the latter 2 for the Little Rock [LR] group).
Validation of gene-expression profiling using real-time PCR
Expression of ANXA2 (Hs00733393_m1; Applied Biosystems) was as-sessed by real-time PCR using the StepOnePlus Real-Time PCR System (Applied Biosystems) for n⫽ 10 myeloma cell lines and n ⫽ 10 primary myeloma cell samples.
Western blotting
Cell lysates were prepared as described previously.6In brief, after pelleting, supernatants were mixed with loading buffer (Carl Roth), heated for 5 minutes at 95°C, and separated on 10% NuPAGE Bis-tris gels (Invitro-gen). Immunodetection was performed using the Western Breeze Kit (Invitrogen). Membranes were incubated with Abs against ANXA2 (clone: 5), and-actin (clone Ab5; both BD Biosciences) as a loading control.
Flow cytometric analysis of ANXA2
Intracellular ANXA2 expression in 10 myeloma cell lines was assessed using a fixation and permeabilization kit according to the manufacturer’s instructions (NatuTec). Cells were stained with the corresponding primary Ab (see preceding paragraph) and secondary Ab (Vector Laboratories). Analyses were performed by FACSAria and FlowJo Version 7.5.5 software (TreeStar) for obtaining overlays.
ELISA
ANXA2 levels were measured in culture supernatants of myeloma cell lines (n⫽ 10) and primary myeloma cells (n ⫽ 8) and in the BM sera of healthy donors (n⫽ 10) and myeloma patients (n ⫽ 15) using a commercially available ELISA kit (USCN Life Science). For the supernatants, 1⫻ 106cells per milliliter were cultured for 24 hours in serum-free RPMI 1640 medium (Invitrogen).
Assessment of myeloma bone disease
Bone disease as assessed by conventional X-ray and whole-body CT scan in routine diagnostics was graded as 0 (normal bone structure), 1 (osteopenia/ osteoporosis), 2 (1-3 osteolyses), or 3 (major structural damage, ⬎ 3 osteolyses).
Statistical analysis
Gene-expression analyses were performed on GC-RMA39 preprocessed datasets of the B-cell lineage and the whole BM samples. For direct comparison of the expression values of plasma cells and BM microenviron-ment (subpopulations), all samples were preprocessed together. Because of 2 different IVT labeling kits used, batch correction was performed using ComBat.40 To assess the presence or absence of gene expression, the “Presence-Absence calls with Negative Probesets” algorithm41was used. Differences in clinical parameters and cytogenetics and differences between defined groups were investigated by exact Wilcoxon rank-sum test. Correlation was assessed using the Pearson correlation coefficient or the Kendall coefficient (for categorical variables). The relationship between categorical variables was assessed using the Fisher exact test. Differential gene expression was assessed using empirical Bayes statistics in linear models for microarray data.42P values were adjusted for multiple testing controlling the false discovery rate as defined by Benjamini and Hoch-berg.43All computations were performed using R Version 2.14.1 (http:// www.r-project.org/) and Bioconductor Version 2.9 software.44EFS and OS were investigated using the Cox proportional hazard model.7First, ANXA2 expression was taken as a continuous variable. Second, ANXA2 expression was tested in a Cox model together with either serum-2-microglobulin (B2M) or the International Staging System (ISS). Next, 2 groups of patients with high (ANXA2high) and low (ANXA2low) ANXA2 expression were delineated using maximally selected rank statistics as implemented in the maxstat R package (http://cran.r-project.org/web/packages/maxstat/ index.html). For EFS and OS, cutoffs were calculated as the mean cutoff from EFS and OS, respectively. Gene expression–based assessment of risk and proliferation and classifications of myeloma were performed as described previously.27Findings were validated using the same strategy on the independent group of 701 patients from the LR group. An effect was considered to be statistically significant if the P value of its corresponding statistical test was not higher than 5%.
Results
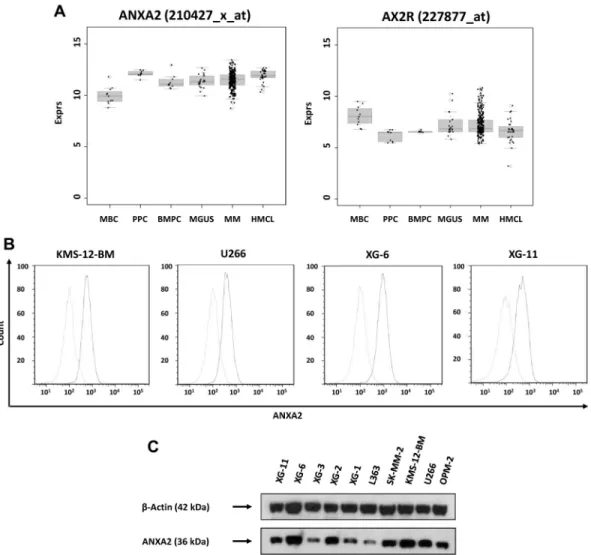
Expression of ANXA2 and AX2R
ANXA2 (located at 15q21-q22) is expressed by all normal and
malignant plasma cells and precursors of the B-cell lineage (Figure 1A). Whereas there was no significant difference in median ANXA2 expression between normal and malignant plasma cells, expression was significantly higher compared with memory B cells
1088 SECKINGER et al personal use only. BLOOD, 2 AUGUST 2012
䡠
VOLUME 120, NUMBER 5For
at UNITE PEDAGOGIQUE MEDICALE on August 31, 2012.
bloodjournal.hematologylibrary.org
(P⬍ .001), but significantly lower compared with proliferating cells, plasmablasts (P⫽ .003), and human myeloma cell lines (P⬍ .001). There was no difference between myeloma cells from early-stage (monoclonal gammopathy of unknown significance and myeloma Durie-Salmon stage I) and advanced-stage (myeloma Durie-Salmon stage II and III) patients.
The ANXA2 receptor AX2R (located at 5p12) was expressed in all normal and malignant plasma cell samples without significant change throughout plasma cell differentiation or between different stages of plasma cell dyscrasias.
Expression of ANXA2 in myeloma cells was validated by real-time PCR. It was expressed in 10 of 10 myeloma cell lines and
10 of 10 primary myeloma cell samples. Results could be confirmed on the protein level using flow cytometry (Figure 1B) and Western blotting (Figure 1C).
In the whole BM, ANXA2 and AX2R were also expressed at a comparable level in healthy and myelomatous (whole) BM samples (Figure 2). Considering cells of the BM microenvironment, ANXA2 expression was significantly higher in osteoblasts and osteoclasts and their corresponding precursors, mesenchymal stromal cells and CD14⫹monocytes/macrophages, respectively, compared with my-eloma cells (P⬍ .001, each; Figure 2). Expression of ANXA2 was significantly higher in differentiated osteoclasts compared with CD14⫹ precursor cells (P⬍ .001) and slightly (1.4-fold) but
Figure 1. Expression of ANXA2 and validation of gene expression by flow cytometry and Western blotting. (A) Expression of ANXA2 and its receptor, AX2R, in memory
B cells (MBCs), polyclonal plasmablastic cells (PPCs), normal plasma cells (BMPCs), myeloma cells (MMCs) and human myeloma cell lines (HMCLs). (B) To validate gene-expression data, the expression of ANXA2 was determined by flow cytometry. Light gray line indicates control without primary Ab; black line, measurement with the corresponding primary and secondary Abs. All cell lines show a consistent expression of ANXA2 by gene-expression profiling, real-time PCR, flow cytometry, and Western blotting (C). For Western blotting,-actin was used as loading control.
Figure 2. Expression of ANXA2 in the whole BM and cells within. Expression of ANXA2 is shown in the
whole BM of myeloma patients (WBM-MM) and normal donors (WBM-ND) as well as osteoclasts (OCs), osteo-blasts (OBs), and their precursors, mesenchymal stro-mal cells (MSCs) and CD14⫹monocytes/macrophages (CD14), respectively, compared with normal (BMPCs) and malignant (MMCs) plasma cells.
ANXA2 IN MYELOMA 1089
BLOOD, 2 AUGUST 2012
䡠
VOLUME 120, NUMBER 5 personal use only.For
at UNITE PEDAGOGIQUE MEDICALE on August 31, 2012.
bloodjournal.hematologylibrary.org
significantly lower in differentiated osteoblasts compared with undifferentiated mesenchymal stromal cells (P⬍ .001).
Secretion of ANXA2
By ELISA, secretion of ANXA2 could be found in supernatants of primary myeloma cells (0.42⫾ 0.55 ng/mL) and in myeloma cell lines (0.14⫾ 0.08 ng/mL; the minimum detectable dose given by the manufacturer is typically less than 0.084 ng/mL). The mean ANXA2 scretion in BM sera from myeloma patients (6.67⫾ 6.47 ng/mL) was significantly higher compared with normal donors (1.4⫾ 1.43 ng/mL; P ⫽ .009).
Association of ANXA2 expression with clinical parameters
We did not find any correlation for clinical parameters (including Durie-Salmon stage, B2M, serum albumin, or ISS) with ANXA2 expression. Using the log-rank–based threshold, we likewise found no difference of the clinical parameters in ANXA2high- compared
with ANXA2low-expressing patients.
Association of ANXA2 expression with genetically defined (sub)entities of multiple myeloma
We found a slightly but significantly higher expression in patient myeloma cells harboring a t(4;14) translocation (P⬍ .001), and a significantly lower expression in those harboring a t(11;14) translo-cation (P⫽ .02). No difference was found for myeloma cell samples of hyperdiploid patients or those harboring a gain of 11q13, 15q22 (the ANXA2-locus), or 5p15, the AX2R locus. Of the aberrations associated with disease progression, deletion of 13q14 (P⫽ .008) and gain of 1q21 (P ⬍ .001), but not deletion of 17p13, showed increased ANXA2 expression. The same held true for losses of 4p16 (P⬍ .001) and 14q32 (P ⫽ .006). If delineated in terms of samples with high and low ANXA2 expression, in the ANXA2highgroup, significantly more patients harbored a t(4;14)
(P⫽ .007) or gain of 1q21 (P ⬍ .001) translocation, as well as a loss of 4p16 (P⫽ .005) or 14q32 (P ⫽ .001).
We also investigated the association of ANXA2 expression, cyclin D expression, and gene expression–based classifications of multiple myeloma.10,11,27Lower CCND1 expression (P⫽ .01) but
higher CCND2 expression (P⫽ .04), respectively, was signifi-cantly associated with a higher ANXA2 expression. This is in agreement with our finding of a significantly lower expression in patients harboring a t(11;14) mutation. However, we did not find any significant association of ANXA2 expression with the molecu-lar classifications.
Association of ANXA2 expression with gene expression–based high-risk scores and proliferation
Although there was no correlation with gene expression–based high-risk scores,25-27all of the respective high-risk groups showed a
slightly but significantly higher ANXA2 expression in primary myeloma cells (1.4-fold; gene expression-based proliferation in-dex, P⬍ .001; University of Arkansas for Medical Sciences score,
P⬍ .001; Intergroupe Francophone du Mye´lome score, P ⬍ .001).
The same was true for the gene expression-based proliferation index on the data of the LR group (2.0-fold; P⬍ .001).
Association of ANXA2 expression with bone disease
We did not find a direct association of ANXA2 expression in primary myeloma cells with the extent of myeloma-induced bone disease, and only a slight tendency in whole BM (P⫽ .2). Likewise, ANXA2 expression was not correlated with Dickkopf-1
(DKK-1) expression, the most prominent myeloma bone disease– associated gene,45nor did the ANXA2high-expressing group show
elevated Dickopf-1 expression values. Prognostic value of ANXA2 and AX2R
Expression in primary myeloma cells. As a single continuous variable, ANXA2 expression in primary myeloma cells was significantly predictive for EFS and OS in both cohorts tested (all
P⬍ .001). Tested with B2M (continuous), both factors were
independent for OS in the HM data (ANXA2, P⬍ .001; B2M,
P⬍ .001) and the LR data (ANXA2, P ⬍ .001; B2M, P ⬍ .001).
The same held true if ANXA2 expression was tested with ISS in the HM data (ANXA2, P⬍ .001; ISS, P ⫽ .002) and the LR data (ANXA2, P⫽ .01; ISS, P ⬍ .001). For EFS, ANXA2 remained an independent prognostic factor if tested with B2M (ANXA2,
P⬍ .001; B2M, P ⫽ .001) or ISS (ANXA2, P ⬍ .001; ISS, P.01) in our data and in the LR data (ANXA2, P⬍ .001;
B2M, P⬍ .001), but not if tested with ISS (ANXA2; P ⫽ .2; ISS P⬍ .001).
In agreement with this, patients with ANXA2high-expressing
versus ANXA2low-expressing myeloma cells showed a
signifi-cantly inferior OS (n⫽ 247; P ⬍ .001, hazard ratio [HR] ⫽ 2.3; 95% confidence interval [95% CI], 1.4-3.6; Figure 3) and EFS (n⫽ 247; P ⫽ .004; HR ⫽ 1.6; 95% CI, 1.2-2.3). Similar observa-tions were found with the patient cohort from the LR group (n⫽ 701; OS, P ⬍ .001; HR ⫽ 2.1; 95% CI, 1.6-2.8 and EFS,
P⬍ .001; HR ⫽ 1.6; 95% CI, 1.2-2.1; Figure 3). The expression of
the ANXA2 receptor AX2R had no prognostic value.
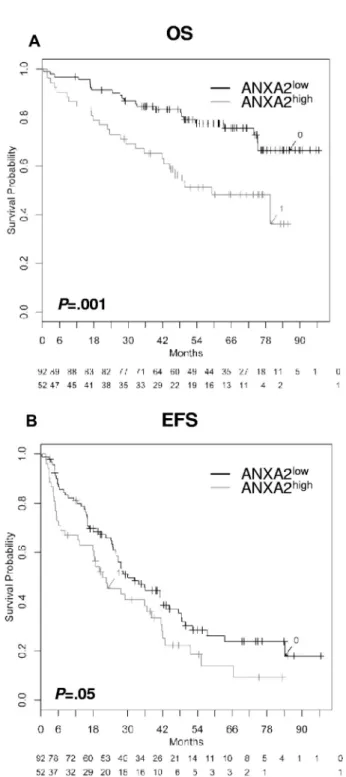
Expression in whole BM. The same prognostic effect for the expression of ANXA2 could be found within the whole BM. Patients with a high ANXA2 expression had a significantly inferior OS (n⫽ 154; P ⫽ .001) and EFS (n ⫽ 154; P ⫽ .05) compared with patients with a low ANXA2 expression (Figure 4). Likewise, there was no correlation with the plasma cell infiltration.
Discussion
Biologic role of ANXA2 and AX2R expression
In the present study, we have shown that ANXA2 and its receptor, AX2R, are expressed in all normal and malignant plasma cell samples and their precursors in a large cohort of myeloma patients (Figure 1), validating earlier data.16,18 ANXA2 expression was
associated with different disease entities, that is, translocation t(4;14) and t(11;14), disease progression (gain of 1q21), prolifera-tion (which is in turn associated with 1q21-gain27), gene expression–
based risk scores, and survival (Figure 3). In addition to normal and malignant plasma cells, ANXA2 and AX2R are expressed by a variety of cell types (Figure 2). In whole BM samples, ANXA2 was likewise significantly associated with patient survival (see next paragraph). These findings are even more remarkable because the variation in expression height within the respective populations was relatively small (Figure 1 and discussion in next paragraph). On the protein level, ANXA2 was present (secreted) in normal BM serum, whereas it was significantly increased in myelomatous BM. Our results mirror the biologic role of ANXA2 that triggered our study: ANXA2 has been shown to stimulate myeloma cell growth and proliferation and to inhibit apoptosis.16,18At least some
of these effects are exerted via the MAPK-dependent activation of the ERK1/2 and AKT pathway,18,24both of which are present in
myeloma cells. ANXA2 has also been shown to increase osteoclast
1090 SECKINGER et al personal use only. BLOOD, 2 AUGUST 2012
䡠
VOLUME 120, NUMBER 5For
at UNITE PEDAGOGIQUE MEDICALE on August 31, 2012.
bloodjournal.hematologylibrary.org
formation by stimulating proliferation and differentiation of oste-oclast precursors.16,18,22-24 Based on these biologic activities, the
presence of secreted ANXA2 in normal BM sera indicates a role in physiologic bone turnover and, eventually, for survival of normal BM plasma cells. Therefore, its pathophysiologic role could mirror its physiologic one. ANXA2 expression in normal plasma cells could therefore mediate the interaction with the microenvironment (eg, during the “niching” of plasma cells in interaction with osteoblasts, their precursors, and osteoclasts as a local “small scale variant” of myeloma induced bone disease). With the increase in ANXA2 level in myelomatous BM, these interactions gain impor-tance in maintaining myeloma cell survival and increased bone turnover, presumably being (at least in part) responsible for myeloma-induced bone disease.
An interesting question can be raised: why are there high levels of ANXA2 present in BM serum samples from myeloma patients compared with normal individuals, but no difference can be found regarding ANXA2 expression in terms of gene expression in whole BM samples and why is there no association with plasma cell
infiltration? The answer lies in what is measured by gene-expression profiling or PCR versus measuring ANXA2-levels in BM sera directly: gene expression is the integral median expression of the populations within the sample because a fixed range of material is used (typically 100 ng of RNA) independently of the total number of cells within the sample. Therefore, this value does not change related to an absolute increase in cellularity and in turn does not mirror the total production of a factor increasingly produced by a higher number of cells. Therefore, an increase in plasma cell infiltration does not lead to a change in the integral median of ANXA2 expression over the mixture of populations in the BM, because the expression level of ANXA2 of myeloma cells is comparable with the expression level of the whole BM (Figure 2). This is in contrast to BMP6 being exclusively expressed by normal and malignant plasma cells only, which correlates significantly with plasma cell infiltration and expression within the whole BM.8 Because plasma cell
accumulation leads to an absolute increase in cellularity, the number of ANXA2-producing cells augments especially the
Figure 3. Effect of ANXA2 expression on EFS and OS. OS (A) and EFS (B) for our patients (HM group; n⫽ 247) and the LR group (n ⫽ 701). All patients were treated with high-dose chemotherapy and autologous stem cell transplantation. Two groups of patients with low (ANXA2low, black curve) and high (ANXA2high, gray curve) ANXA2
expression could be delineated. The OS was significantly superior for low ANXA2 expression (HM group, P⬍ .001 and LR group, P ⬍ .001). The same held true for EFS in the HM group (P⫽ .004) and the LR group (P ⬍ .001).
ANXA2 IN MYELOMA 1091
BLOOD, 2 AUGUST 2012
䡠
VOLUME 120, NUMBER 5 personal use only.For
at UNITE PEDAGOGIQUE MEDICALE on August 31, 2012.
bloodjournal.hematologylibrary.org
number of ANXA2-secreting myeloma cells, because this population has the highest relative and absolute increase in number. Therefore, the total amount of ANXA2 secretion in the whole BM increases because the number of secreting cells is increasing, not the secretion of an individual cell. This situation is comparable with the expression of proangiogenic factors (eg, VEGFA) by normal plasma cells at a similar level to myeloma cells, leading to an absolute increase in the amount of secreted factors by an increase in plasma cell infiltration, and in turn, induction of angiogenesis.6
ANXA2 expression and bone disease
On first view, the lack of a clear association between osteolytic bone disease as detected by conventional and whole-body CT imaging is disappointing and difficult to understand. With a second look, it is not. First, ANXA2-related bone disease is likely driven by the absolute increase in secreted ANXA2 within the BM, not visible in gene expression (as discussed above), making it difficult to discern an association. Second, despite being associated with biologic entities and prognosis, the expression of ANXA2 in myeloma cells does not show a significant up-/down-regulation compared with normal plasma cells (eg, in contrast to DKK1).45
Given our present data and its biologic function, ANXA2 could be involved in normal bone turnover and niching of BM plasma cells. A “highjacking” of these physiologic mechanisms by myeloma cells might accordingly be present in the majority of myeloma patients, giving ANXA2 a special place alongside other aberrantly expressed bone metabolism impacting factors such as DKK1 or IL-6.
ANXA2 expression and survival
In the present study, we show for the first time ANXA2 expression in primary myeloma cells as an adverse prognostic factor in 2 independent cohorts of patients undergoing high-dose chemo-therapy and autologous stem-cell transplantation (Figure 3). Com-pared with other expression-based prognostic factors, such as IGF1 in primary myeloma cells46or heparanase in the BM
microenviron-ment,12it must be emphasized that the median of both ANXA2high
-and ANXA2low-expressing myeloma cells is in the range of
ANXA2 expression in normal plasma cells. In addition, ANXA2 expression in the whole BM is a prognostic factor (Figure 4).
What is the basis for the impact of ANXA2 expression on survival? First, in multivariate analysis, the prognostic impact of ANXA2 expression is independent of conventional prognostic factors, basically mirroring tumor load (eg, B2M and ISS stage). Second, it is associated with molecular entities related to high risk such as 1q21 gain and del13q14 (despite not being significant as a single aberration) and t(4;14) (despite its reduced significance in patients treated with bortezomib).3ANXA2 is also associated with
prognosis-associated gene expression–based high-risk scores25,26
and also with myeloma cell proliferation, one of the strongest independent risk factors in myeloma.27This makes 2
interpreta-tions possible: (1) ANXA2 expression by its biologic funcinterpreta-tions drives part of the adverse prognosis in genetically defined high-risk myeloma, or (2) ANXA2 expression surrogates another factor changing in the same way without any functional relationship between the two. Proliferation could be such a factor: ANXA2 is up-regulated in normally proliferating plasmablastic cells and human myeloma cell lines (Figure 1) and is associated with gene expression–based assessment of proliferation in malignant plasma cells. Part of the adverse biologic impact of genetically defined high-risk myeloma is related to proliferation such as gain of 1q21, deletion of 13q14, and gene expression–based high-risk scores.27
Given the biologic impact on bone turnover and myeloma cell survival, there is at least reason to lean to the first possibility.
In other cancer entities, ANXA2 expression seems to have either beneficial or detrimental effects on patient survival. An increased expression of ANXA2 has been reported as a poor prognostic factor for solid tumors such as pancreatic47and breast
cancer,48being associated with progression, invasion, and
meta-static spread of tumor cells. Conversely, ANXA2 expression is down-regulated in prostate cancer,49promoting (osteoblastic) bone
Figure 4. Effect of ANXA2 expression within the BM on EFS and OS. Shown are
OS (A) and EFS (B; n⫽ 154). Two groups of patients with low (ANXA2low, black
curve) and high (ANXA2high, gray curve) ANXA2 expression. OS was significantly
superior for low ANXA2 expression (P⫽ .001); the same held true for EFS (P ⫽ .05).
1092 SECKINGER et al personal use only. BLOOD, 2 AUGUST 2012
䡠
VOLUME 120, NUMBER 5For
at UNITE PEDAGOGIQUE MEDICALE on August 31, 2012.
bloodjournal.hematologylibrary.org
metastasis.50Therefore, ANXA2 expression seems to be a general
prognostic factor in cancer, but might be associated or surrogate a different pathogenic mechanism in different entities.
ANXA2 as therapeutic target
Given the wide distribution of ANXA2 expression over different cell types (Figure 2) and the concomitant possibility of off-target effects, a therapeutic strategy may lie not in targeting the ANXA2-expressing cell per se, but in directly decreasing the ANXA2-level in myelomatous BM to at least normal levels, for example, by the use of mAbs or “decoy” receptors against ANXA2. Counteracting the biologic functions of ANXA2, this decrease could act in 3 ways: (1) by reducing bone turnover and thus myeloma-induced bone disease as one of the main clinical challenges in myeloma treatment; (2) by hindering the concomitant liberation of myeloma growth and survival factors as IGF1; and (3) by preventing the direct stimulation of myeloma cell proliferation and survival. Taking into account the adverse prognosis of patients with ANXA2high-expressing myeloma cells, it might even be that these
are more dependent on high ANXA2 levels, and therefore anti-ANXA2 treatment is to a certain degree risk adapted.
ANXA2 as one of a novel class of prognostic factors involved in myeloma pathogenesis
We conclude that ANXA2 is a member of a novel class of prognostic factors involved in myeloma pathogenesis with the following characteristics: high expression in normal and malignant plasma cells (no differential expression); comparable expression in several other cell types; clear association with molecular entities and risk (direct and indirect), with adverse prognosis for higher expression (even if “high” is still within the normal range); and an increase in BM serum levels not visible in expression profiling of the BM microenvironment.
In conclusion, ANXA2 exemplifies an interesting class of targetable bone-remodeling impacting factors expressed by normal
and malignant plasma cells and cells of the BM microenvironment with significant impact on survival in multiple myeloma patients.
Acknowledgments
The authors thank Ve´ronique Pantesco, Gabriele Hoock, Maria Do¨rner, and Katrin Heimlich for technical assistance.
This work was supported in part by grants from the Deutsche Forschungsgemeinschaft (SFB/TRR79; Bonn, Germany), the Diet-mar Hopp Foundation (St Leon-Rot, Germany), the University of Heidelberg (Heidelberg, Germany), the Orthopa¨dische Klinik (Heidelberg, Germany), and the Ligue Nationale Contre Le Cancer (Paris, France). Plasma cell purification was supported in part by Novartis Pharma (Nuremberg, Germany).
Authorship
Contribution: A.S. and D.H. designed the research, performed the experiments, analyzed the data, and wrote the manuscript; T.M. and T.R. performed the statistical analysis; J.M. performed the microar-ray experiments; D.D. analyzed the X-microar-rays and whole-body CT scans; J.H. collected BM samples and clinical data; K.H. and R.S. participated in the conceptual work of the SFB/TRR79; A.R.-W. participated in data analysis; A.J. performed the interphase-FISH experiments; V.E. reviewed the manuscript; H.G. collected BM samples and clinical data and reviewed the manuscript; and B.K. analyzed the data and reviewed the manuscript.
Conflict-of-interest disclosure: The authors declare no compet-ing financial interests.
Correspondence: Dr Dirk Hose, Medizinische Klinik V, Univer-sita¨tsklinikum Heidelberg, Im Neuenheimer Feld 410, 69120 Heidel-berg, Germany; e-mail: [email protected].
References
1. Kyle RA, Rajkumar SV. Multiple myeloma. N Engl J Med. 2004;351(18):1860-1873.
2. Barlogie B, Tricot GJ, van Rhee F, et al. Long-term outcome results of the first tandem auto-transplant trial for multiple myeloma. Br J Haema-tol. 2006;135(2):158-164.
3. Neben K, Lokhorst HM, Jauch A, et al. Adminis-tration of bortezomib before and after autologous stem cell transplantation improves outcome in multiple myeloma patients with deletion 17p. Blood. 2012;119(4):940-948.
4. Fonseca R, Barlogie B, Bataille R, et al. Genetics and cytogenetics of multiple myeloma: a work-shop report. Cancer Res. 2004;64(4):1546-1558. 5. Avet-Loiseau H, Attal M, Moreau P, et al. Genetic abnormalities and survival in multiple myeloma: the experience of the Intergroupe Francophone du Myelome. Blood. 2007;109(8):3489-3495. 6. Hose D, Moreaux J, Meissner T, et al. Induction of
angiogenesis by normal and malignant plasma cells. Blood. 2009;114(1):128-143.
7. Hose D, Re`me T, Meissner T, et al. Inhibition of aurora kinases for tailored risk-adapted treatment of multiple myeloma. Blood. 2009;113(18):4331-4340.
8. Seckinger A, Meissner T, Moreaux J, et al. Bone morphogenic protein 6: a member of a novel class of prognostic factors expressed by normal and malignant plasma cells inhibiting proliferation and angiogenesis. Oncogene. 2009;28(44):3866-3879.
9. Caers J, Hose D, Kuipers I, et al. Thymosin beta4 has tumor suppressive effects and its de-creased expression results in poor prognosis and decreased survival in multiple myeloma. Haema-tologica. 2010;95(1):163-167.
10. Zhan F, Huang Y, Colla S, et al. The molecular classification of multiple myeloma. Blood. 2006; 108(6):2020-2028.
11. Bergsagel PL, Kuehl WM. Molecular pathogene-sis and a consequent classification of multiple myeloma. J Clin Oncol. 2005;23(26):6333-6338. 12. Mahtouk K, Hose D, Raynaud P, et al.
Hepara-nase influences expression and shedding of syndecan-1, and its expression by the bone mar-row environment is a bad prognostic factor in multiple myeloma. Blood. 2007;109(11):4914-4923.
13. Mahtouk K, Hose D, Re`me T, et al. Expression of EGF-family receptors and amphiregulin in mul-tiple myeloma. Amphiregulin is a growth factor for myeloma cells. Oncogene. 2005;24(21):3512-3524.
14. Klein B, Seckinger A, Moehler T, Hose D. Molecu-lar pathogenesis of multiple myeloma: chromo-somal aberrations, changes in gene expression, cytokine networks, and the bone marrow mi-croenvironment. Recent Results Cancer Res. 2011;183:39-86.
15. Munshi NC, Hideshima T, Carrasco D, et al. Iden-tification of genes modulated in multiple myeloma using genetically identical twin samples. Blood. 2004;103(5):1799-1806.
16. Bao H, Jiang M, Zhu M, Sheng F, Ruan J, Ruan C. Overexpression of Annexin II affects the proliferation, apoptosis, invasion and production of proangiogenic factors in multiple myeloma. Int J Hematol. 2009;90(2):177-185.
17. Lu G, Maeda H, Reddy SV, et al. Cloning and characterization of the annexin II receptor on hu-man marrow stromal cells. J Biol Chem. 2006; 281(41):30542-30550.
18. D’Souza S, Kurihara N, Shiozawa Y, et al. An-nexin II interactions with the anAn-nexin II receptor enhance multiple myeloma cell adhesion and growth in the bone marrow microenvironment. Blood. 2012;119(8):1888-1896.
19. Sharma MC, Sharma M. The role of annexin II in angiogenesis and tumor progression: a potential therapeutic target. Curr Pharm Des. 2007;13(35): 3568-3575.
20. Ling Q, Jacovina AT, Deora A, et al. Annexin II regulates fibrin homeostasis and neoangiogen-esis in vivo. J Clin Invest. 2004;113(1):38-48. 21. Gillette JM, Nielsen-Preiss SM. The role of
an-nexin 2 in osteoblastic mineralization. J Cell Sci. 2004;117(3):441-449.
22. Menaa C, Devlin RD, Reddy SV, Gazitt Y, Choi SJ, Roodman GD. Annexin II increases os-teoclast formation by stimulating the proliferation of osteoclast precursors in human marrow cul-tures. J Clin Invest. 1999;103(11):1605-1613. 23. Takahashi S, Reddy SV, Chirgwin JM, et al.
Clon-ing and identification of annexin II as an auto-crine/paracrine factor that increases osteoclast
ANXA2 IN MYELOMA 1093
BLOOD, 2 AUGUST 2012
䡠
VOLUME 120, NUMBER 5 personal use only.For
at UNITE PEDAGOGIQUE MEDICALE on August 31, 2012.
bloodjournal.hematologylibrary.org
formation and bone resorption. J Biol Chem. 1994;269(46):28696-28701.
24. Li F, Chung H, Reddy SV, et al. Annexin II stimu-lates RANKL expression through MAPK. J Bone Miner Res. 2005;20(7):1161-1167.
25. Decaux O, Lode´ L, Magrangeas F, et al. Predic-tion of survival in multiple myeloma based on gene expression profiles reveals cell cycle and chromosomal instability signatures in high-risk patients and hyperdiploid signatures in low-risk patients: a study of the Intergroupe Francophone du Mye´lome. J Clin Oncol. 2008;26(29):4798-4805.
26. Shaughnessy JD, Zhan F, Burington BE, et al. A validated gene expression model of high-risk mul-tiple myeloma is defined by deregulated expres-sion of genes mapping to chromosome 1. Blood. 2007;109(6):2276-2284.
27. Hose D, Reme T, Hielscher T, et al. Proliferation is a central independent prognostic factor and target for personalized and risk adapted treat-ment in multiple myeloma. Haematologica. 2011; 96:87-95.
28. Greipp PR, Miguel JS, Durie BGM, et al. Interna-tional staging system for multiple myeloma. J Clin Oncol. 2005;23(15):3412-3420. 29. Durie BG. Staging and kinetics of multiple
my-eloma. Semin Oncol. 1986;13(3):300-309. 30. Blade´ J, Samson D, Reece D, et al. Criteria for
evaluating disease response and progression in patients with multiple myeloma treated by high-dose therapy and haemopoietic stem cell trans-plantation. Myeloma Subcommittee of the EBMT. European Group for Blood and Marrow Trans-plant. Br J Haematol. 1998;102(5):1115-1123. 31. Barlogie B, Tricot G, Rasmussen E, et al. Total
therapy 2 without thalidomide in comparison with total therapy 1: role of intensified induction and posttransplantation consolidation therapies. Blood. 2006;107(7):2633-2638.
32. van Rhee F, Szymonifka J, Anaissie E, et al. Total therapy 3 for multiple myeloma: prognostic impli-cations of cumulative dosing and premature
dis-continuation of VTD maintenance components, bortezomib, thalidomide and dexamethasone, relevant to all phases of therapy. Blood. 2010; 116:1220-1227.
33. Moreaux J, Cremer FW, Reme T, et al. The level of TACI gene expression in myeloma cells is as-sociated with a signature of microenvironment dependence versus a plasmablastic signature. Blood. 2005;106(3):1021-1030.
34. Zhang XG, Gaillard JP, Robillard N, et al. Repro-ducible obtaining of human myeloma cell lines as a model for tumor stem cell study in human mul-tiple myeloma. Blood. 1994;83(12):3654-3663. 35. Corre J, Mahtouk K, Attal M, et al. Bone marrow
mesenchymal stem cells are abnormal in multiple myeloma. Leukemia. 2007;21(5):1079-1088. 36. Fuhler GM, Baanstra M, Chesik D, et al. Bone
marrow stromal cell interaction reduces syndecan-1 expression and induces kinomic changes in myeloma cells. Exp Cell Res. 2010; 316(11):1816-1828.
37. Wagner W, Wein F, Seckinger A, et al. Compara-tive characteristics of mesenchymal stem cells from human bone marrow, adipose tissue, and umbilical cord blood. Exp Hematol. 2005;33(11): 1402-1416.
38. Wuilleme S, Robillard N, Lode´ L, et al. Ploidy, as detected by fluorescence in situ hybridization, defines different subgroups in multiple myeloma. Leukemia. 2005;19(2):275-278.
39. Wu Z, Irizarry RA, Gentleman R,
Martinez-Murillo F, Spencer F. A model-based background adjustment for oligonucleotide ex-pression arrays. J Am Stat Assoc. 2004;99:909-917.
40. Johnson WE, Li C, Rabinovic A. Adjusting batch effects in microarray expression data using em-pirical Bayes methods. Biostatistics. 2007;8(1): 118-127.
41. Warren P, Taylor D, Martini PGV, Jackson J, Bienkowska J. PANP–a new method of gene de-tection on oligonucleotide expression arrays. 2007 BIBE 2007 Proceedings of the 7th IEEE
In-ternational Conference on Bioinformatics and Bioengineering. 2007;108-115.
42. Smyth GK. Linear models and empirical bayes methods for assessing differential expression in microarray experiments. Stat Appl Genet Mol Biol. 2004;3:Article3.
43. Benjamini Y, Hochberg Y. Controlling the false discovery: a practical and powerful approach to multiple testing. J R Stat Soc Series B. 1995;57: 289-300.
44. Gentleman RC, Carey VJ, Bates DM, et al. Bio-conductor: open software development for com-putational biology and bioinformatics. Genome Biol. 2004;5(10):R80.
45. Tian E, Zhan F, Walker R, et al. The role of the Wnt-signaling antagonist DKK1 in the develop-ment of osteolytic lesions in multiple myeloma. N Engl J Med. 2003;349(26):2483-2494. 46. Sprynski AC, Hose D, Caillot L, et al. The role of
IGF-1 as a major growth factor for myeloma cell lines and the prognostic relevance of the expres-sion of its receptor. Blood. 2009;113(19):4614-4626.
47. Esposito I, Penzel R, Chaib-Harrireche M, et al. Tenascin C and annexin II expression in the pro-cess of pancreatic carcinogenesis. J Pathol. 2006;208(5):673-685.
48. Sharma MR, Koltowski L, Ownbey RT, Tuszynski GP, Sharma MC. Angiogenesis-associated protein annexin II in breast cancer: selective expression in invasive breast cancer and contribution to tumor invasion and progres-sion. Exp Mol Pathol. 2006;81(2):146-156. 49. Liu J-W, Shen J-J, Tanzillo-Swarts A, et al.
An-nexin II expression is reduced or lost in prostate cancer cells and its re-expression inhibits pros-tate cancer cell migration. Oncogene. 2003; 22(10):1475-1485.
50. Shiozawa Y, Havens AM, Jung Y, et al. Annexin II/annexin II receptor axis regulates adhesion, migration, homing, and growth of prostate cancer. J Cell Biochem. 2008;105(2):370-380.
1094 SECKINGER et al personal use only. BLOOD, 2 AUGUST 2012
䡠
VOLUME 120, NUMBER 5For
at UNITE PEDAGOGIQUE MEDICALE on August 31, 2012.
bloodjournal.hematologylibrary.org