Publisher’s version / Version de l'éditeur:
Vous avez des questions? Nous pouvons vous aider. Pour communiquer directement avec un auteur, consultez la première page de la revue dans laquelle son article a été publié afin de trouver ses coordonnées. Si vous n’arrivez pas à les repérer, communiquez avec nous à [email protected].
Questions? Contact the NRC Publications Archive team at
[email protected]. If you wish to email the authors directly, please see the first page of the publication for their contact information.
https://publications-cnrc.canada.ca/fra/droits
L’accès à ce site Web et l’utilisation de son contenu sont assujettis aux conditions présentées dans le site LISEZ CES CONDITIONS ATTENTIVEMENT AVANT D’UTILISER CE SITE WEB.
Oligonucleotide Array Sequence Analysis, pp. 421-440, 2008
READ THESE TERMS AND CONDITIONS CAREFULLY BEFORE USING THIS WEBSITE. https://nrc-publications.canada.ca/eng/copyright
NRC Publications Archive Record / Notice des Archives des publications du CNRC :
https://nrc-publications.canada.ca/eng/view/object/?id=ea9161ea-ede6-4c8c-8794-afca7eac4710 https://publications-cnrc.canada.ca/fra/voir/objet/?id=ea9161ea-ede6-4c8c-8794-afca7eac4710
Archives des publications du CNRC
Access and use of this website and the material on it are subject to the Terms and Conditions set forth at
Positional weight matrix as a sequence motif detector
Council Canada Institute for Information Technology de recherches Canada Institut de technologie de l'information
Positional weight matrix as a sequence motif
detector *
Pan, Y., Phan, S.
October 2008
* published in Nova Science Publishers, Inc., October 2008. pp. 421-440. ISBN: 978-1-60456-542-3. Editors: M.K. Morettie and L.J. Rizzo. NRC 50391.
Copyright 2008 by
National Research Council of Canada
Permission is granted to quote short excerpts and to reproduce figures and tables from this report, provided that the source of such material is fully acknowledged.
Editors: M.K. Moretti and L.J. Rizzo, pp. 421-440 © 2008 Nova Science Publishers, Inc.
Chapter 14
POSITIONAL WEIGHT MATRIX AS A SEQUENCE
MOTIF DETECTOR
*
Youlian Pan and Sieu Phan
Institute for Information Technology, National Research Council Canada 1200 Montreal Road, Ottawa, Ontario, Canada K1A 0R6
A
BSTRACTIn biological sequence research, the positional weight matrix (PWM) is often used for motif signal detection. A set of experimentally verified oligonucleotides known to be functional subsequences, which can be bound by a transcription factor (TF), as translational initiation sites or pre-mRNA splicing sites, are collected and aligned. The frequency of each nucleotide A, C, G, or T at each column of the alignment is calculated in the matrix. Once a PWM is constructed, it can be used to search from a nucleotide sequence for the subsequences that possibly perform the same function. The match between a subsequence and a PWM is usually described by a score function, which measures the closeness of the subsequence to the PWM as compared with the given background. However, selection of threshold scores that legitimately qualify a functional subsequence has been a great challenge. Many laboratories have attempted tackling this problem; but there is no significant breakthrough so far. In this chapter, we discuss the characteristics of a PWM and factors that affect motif predictions and propose a new score function that is tied into information content and statistical expectation of a PWM. We also apply this score function in the PWMs from public databases and compare it favorably with the broadly used Match method.
1.
I
NTRODUCTIONThe term motif is broadly used to describe a conserved pattern, which include a conserved domain (Pérez-Arellano et al., 2007), a functional structure (Schreiter and Drennan, 2007; Kiedzierska et al., 2007), a specific architecture in biological networks (Zhu et al., 2007) and a string pattern in protein or nucleotide sequences (Pan, 2006). A nucleotide sequence motif often refers to a short functional pattern in the DNA or RNA sequence and is
*
often used to characterize the interaction between a DNA and a protein, such as the binding sites of nucleases and transcription factors. Others at RNA levels are involved in translation, such as ribosome binding, and mRNA processing, such as splicing between exons and introns. Some motifs are involved in transcription termination, such as microRNAs binding. These motifs are usually conserved in the nucleotide sequence pattern.
Many proteins are able to bind to a DNA subsequence with alternative nucleotides at one or more positions in a motif. Among a set of functional subsequences that are known to have the same function, the most dominant ones are called consensus for that function. The term of consensus has later been relaxed to include degenerate, yet functional subsequences that match all example sites closely, but not necessarily exactly. A consensus describes statically the interaction between a protein and a DNA, but is unable to describe precisely the significance of one nucleotide over the others at certain position of a motif. In this regard, a positional weight matrix (PWM) is often more powerful to express a motif (Stormo, 2000). In the literature, a PWM is also referred as frequency matrix, position specific weight matrix, and positional probability matrix (see Pan, 2006 and refs there in).
A PWM is a probabilistic description of a binding motif for a given protein. Due to its nature of pattern conservation, many similar subsequences could be discovered through computational pattern recognitions. A significant number of such subsequences have been experimentally validated in the biology laboratories across the world. Through the multiple alignments of a set of short nucleotide sequences that are known to perform the same function, probability of each nucleotide appears at certain position of the motif is derived simply by counting its occurrences and can be expressed either in the form of motif logo (Schneider and Stephens, 1990) or a probability matrix (Stormo, 2000).
Over the past two decades, many computational approaches are developed to discover conserved motifs with certain degree of success. Computational motif discovery process can be considered in two categories, unsupervised de novo motif discovery and supervised known motif prediction (Pan, 2006). In the unsupervised de novo motif discovery processes, numerous DNA subsequences of a given length w are locally aligned. The idea behind these methods is that each sequence in the input dataset contains one or more subsequences that could be instances of a conserved motif, but there is no prior knowledge with regard to their binding agent, motif pattern structure, or probability of each nucleotide at certain position. The conserved motifs are iteratively evolved through various optimization algorithms.
The optimization algorithms in de novo motif discovery can be subdivided into three distinct approaches: deterministic optimization, stochastic optimization, and enumeration (Pan, 2006, D’haeseleer, 2006). Information content is one of the objective functions applied to measure the quality of a local alignment (see Section 2). Optimization of the information content of a matrix for a fixed number of occurrences has been widely used in matrix-based motif discovery.
While performing local alignment, deterministic optimization methods simultaneously optimize a positional weight matrix describing a motif and probabilities of its associated sites. Expectation maximization (EM, Lawrence and Reilly, 1990) is one of such methods. The EM algorithms are named for their two iterative steps, expectation and maximization, which are repeated until a convergence criterion is satisfied. The expectation step evaluates the likelihood of each subsequence of length w to fit the PWM profile with respect to the background of the input sequence. A likelihood value Zij is computed for each position i of
value) from each input sequence j and builds a new alignment PWM profile. A popular implementation of these algorithms is in MEME software (Bailey and Elkan, 1994). However, the result of the EM algorithm is sensitive to the initial subsequence selection from each input sequence and, therefore, it could be trapped by local maxima.
Stochastic optimization applies stochastic sampling instead of exhaustive survey of all subsequence of length w. Initially, one such subsequence is selected randomly from each of the k input sequences and a 4 × w PWM profile is built on subsequences from k-1 input sequences. Similar to the EM algorithm, the likelihood value of each possible w-mer (Zi) from
the remaining sequence is evaluated to represent how well the mer fits to the model. A w-mer is sampled stochastically according to the relative likelihood values (
i i i Z Z / , Lawrence et al 1993). This relative likelihood value indicates that a w-mer that fits well (with high Zi value) is more likely sampled. This procedure is repeated for each sequence until all
input sequences have been sampled. The whole procedure is repeated until a convergence criterion is satisfied. Theoretically, the relative information is maximized only after an infinite number of cycles. Practically, this algorithm often converges very quickly (Zhang, 2002). Similar to the EM approach, stochastic sampling could be locked to a local maximum. Inserting another step into the algorithm solves this problem. After a specific number of cycles, one can automatically shift (called a phase shift) all aligned subsequences to the left or right by a certain number of nucleotides and a 4 × w PWM profile is built after the shift. The iterative sampling is repeated. This approach has been implemented in the Gibbs Sampling family of tools that are very popular in motif discovery (Liu et al 1995; Hughes et al, 2000; Liu et al., 2001; Thijs et al, 2001; Thompson et al., 2003, 2007; Favorov et al, 2005).
Enumerative algorithms search exhaustively for all possible combinations of nucleotides and select statistically the top few overrepresented motifs from a set of input sequences. Subsequently, motif discovery is treated as a feature selection problem; a motif is treated as a feature of input sequences that discriminate the potential motifs from background sequences (Sinha, 2003). Instead of counting the frequency of overall occurrences of the motifs in a set of sequences, information about motif distribution in individual sequences is used to evaluate motif overrepresentation. This kind of methods has been considered too slow due to the fact that their time complexity grows exponentially with the length of the motif. Given a motif length w, these methods need to evaluate 4w candidate patterns before an optimal solution is found. However, by indexing the input sequences with a suffix tree, the execution time becomes exponential with respect to the number of allowed substitutions, which is usually small, instead of motif length (Pavesi et al, 2004). These methods are guaranteed to find the globally most overrepresented motifs (Sinha and Tompa, 2002). Some of these methods compare favorably with others with regard to accuracy (Tompa et al., 2005).
Biological methods for motif discovery also become significant and more reliable. These include “photofootprinting” (Becker and Wang, 1984), chromatin immunoprecipitation (ChIP, Solomon and Varshavsky, 1985), and a combination of a modified version of the ChIP procedure (Orlando, 2000) with DNA microarray technology (chip) called ChIP-chip (Horak and Snyder, 2002), protein binding microarray (Bulyk et al, 2001; Mukherjee et al., 2004) and others reviewed in Pan (2006). These methods brought the motif discovery to a new stage and many computationally discovered motifs are validated.
Additionally, motif discovery are being advanced through phylogenetic footprinting. Mainly, two phylogenomic approaches have been considered. The first is to find motifs that
are common from multiple orthologous sequences. Footprinter (Blanchette and Tompa, 2002) and OrthoMEME (Prakash et al., 2004) are two examples in this category. The second approach is to globally align the promoter sequences of the orthologous genes and then identify conserved windows. For example, EMnEM (Moses et al, 2004), CompareProspector (Liu et al., 2004), PhyME (Sinha et al, 2004), and PhyloGibbs (Siddharthan et al, 2005), Phylo-HMMs (Siepel and Haussler, 2005), phylogenetic Gibbs sampler (Newberg et al, 2007) and others reviewed in Pan (2006) falls into this category.
Through both computational and biological approaches, or through a combination of both approaches, many motif profiles in the form of PWM became known and validated. Many (trained) PWMs are available in public databases, such as TRANSFAC (Matys et al, 2006) and JASPAR (Sandelin et al, 2004). Such PWMs are extensively used for supervised prediction of putative motifs. Many PWM-based motif prediction tools have been developed over the past decades. These include Match (Kel et al., 2003), P-Match (Chekmenev, 2005), MatInspector (Cartharius et al, 2005) and GAPWM (Li et al, 2007).
The main challenge in supervised PWM-based motif prediction methods is the objective score function and determination of a threshold score. The score functions usually depend on PWM parameters such as its length and information content. Therefore, a threshold scores that legitimately qualify a functional motif is very hard to select without subjectivity. This chapter is to discuss the characteristics of a PWM, the existing score functions, the factors that affect motif predictions and finally propose a new score function that is tied into information content and statistical expectation of a PWM. We also apply this score function in the PWMs from public databases and compare it with the broadly used Match method.
In the following sections, we describe the existing objective functions, their strengths and weaknesses in Section 2, and ways to improve the score functions based on the existing ones in Section 3. We apply the proposed score function in two datasets in Section 4, discuss the result in Section 5, and finally conclude in Section 6.
2.
E
XISTINGO
BJECTIVE(
SCORE)
F
UNCTIONSBefore describing a score function, it is necessary to review the information theory (Schneider et al, 1986) that is the backbone of most score functions. Information theory describes the uncertainty of a discrete random variable X = {x1, x2, …, xk} as
= =
−
=
=
k b b b k b b bp
p
p
p
X
H
1 2 1 2(
1
/
)
log
(
)
log
)
(
(bit) (1),where pb is the probability of xb and =
=
kb 1
p
b1
. One bit of information resolves theuncertainty of choice between 2 equally likely symbols. For a nucleotide sequence, there are 4 bases (X= {A, C, G, T}, k = 4). The maximum uncertainty corresponds to the case that all 4 bases have equal probability, pb= 0.25; thus the maximum uncertainty is 2 bits. If only one
base, say G, appears at certain position of a PWM, we have pA = 0, pC = 0, pG = 1, pT = 0. The
uncertainty of that column is 0 bit (0 log 0 = 0 and 1 log 1 = 0). Therefore the uncertainty value for each column of a PWM is between 0 and 2.
The information content at column i of a PWM can be measured by a Kullback-Leibler (Kullback and Leibler, 1951) distance (or relative entropy), which is defined as
b b i b b i i
f
p
p
I
2 , 4 1 ,log
==
(2) or b i b b i b b b i ip
f
p
p
I
2 , 4 1 , 2 4 1 ,log
log
= =+
−
=
(3),where pi,b is the probability of nucleotide b found at position i of the site, and fb is the
probability of nucleotide b on sequences other than the sites (i.e. background). With the assumption of equally probable background model in a DNA sequence, Equation (3) becomes
b i b b i b i b b i b b i b i
f
p
p
p
p
p
I
2 , 4 1 , , 2 4 1 , 4 1 , 2(
)
log
(
2
)(
1
)
log
log
= = =+
−
−
=
+
−
=
.This special version of Equation (3) is the traditional Shannon distance (Shannon, 1948)
b i b b i i
p
p
I
2 , 4 1 ,log
2
=+
=
(4).Information content of a PWM is the summation of information on each column:
=
=
w i i matrixI
I
1 (5).Based on information content in each column of a PWM, the PWM can also be expressed graphically as sequence logo (Schneider and Stephens, 1990). An objective function of each PWM-based motif discovery method is to discriminate a subsequence between a background model and the PWM model. There are mainly six categories of the objective functions, log-odd score (also called log-likelihood ratio). MAP score, relative information, Z score, specificity score, and positional bias scores.
The log-odd score is to measure the relative likelihood of a subsequence s being an instance of the PWM against the given background model. It is the summation of the score on each base and can be expressed as:
∏
= ==
=
w i i i w i i i sb
f
b
p
b
f
b
p
V
1 2 1 2)
)
(
)
(
(
log
)
)
(
)
(
(
log
(6).The log-odd score has been extensively used in various domains. It is the core of Viterbi algorithm that is extensively used in sequence alignment, hidden Markov model (Krogh et al,
1994) and many motif finding tools. However, the log-odd score is dependent on length of the motifs and PWM models.
The MAP (maximum a posteriori probability) score combines the information content of the PWM and the rareness of PWM with regard to the background model (Liu et al, 2002):
]
)
(
log
1
)
(
log
[
)
(
log
1 2 1 1 , 2 , 2 = = =−
=
n j j w i k b b i b if
s
n
p
p
w
n
MAP
(7),where n is the number of sites used to construct the PWM and sj is an individual site
The relative information measures the relative information of a site S based on PWM
i b i w i i
p
I
S
Score
, 1)
(
==
(8),where bi is nucleotide i in the site. The relative information score does not consider
background information and applied by MatInspector (Cartharius et al., 2005), Match (Kel et al., 2003) and P-Match (Chekmenev et al., 2005). These applications take a max score and then take a ratio between a site score and the max score:
(max)
)
(
Score
S
Score
R =
(9),but Match (Kel et al., 2003) scales between the maximum score and minimum score and then takes the ratio
(min)
(max)
(min)
)
(
)
(
Score
Score
Score
S
Score
Match
R
−
−
=
(10).The Z-score measures the significance of a prediction based on its over-representation and is expressed as
)
(
)
(
)
(
)
(
s
s
E
s
obs
s
Z
σ
−
=
(11),where obs(s) is the predicted number of PWM instances s, E(s) is the expected number of s in the background model and (s) is the standard deviation. However, the statistical over-representation as measured by Z-score does not necessarily mean binding preference (Li and Tompa, 2006).
The group specificity score measures the goodness of a given motif that is localized to the set of input sequences as compared to the background. The rational is that the true motif is a subsequence that is clearly more frequent in the selected sequence set than in all sequences. This score is used in AlignACE (Hughes et al, 2000).
The sequence specificity score measures the likelihood of the set of input sequence potentially contains a functional motif. A prediction having multiple motifs in one sequence is less significant than a prediction having a balanced number of motifs in each sequence (Li and Tompa, 2006). This score is applied in ANN-Spec (Workman and Stormo, 2000) and Weeder (Pavesi et al, 2004).
Due to the uneven distribution of certain motifs (Pan et al, 2004, Smith et al, 2007), positional bias (Hughes et al, 2000) and local positional bias (Friberg et al, 2005) scores are being used to measure the concentration of the motifs within certain local regions of the input sequence set.
Most of the above described objective functions are exclusively used for finding a PWM representing a motif, such as MAP score and group specificity. Great effort has been placed in discovering PWMs through both biological and computational approaches and hundreds of known PWMs became available. The question is how to make use of these resources in predicting new instances of known PWMs. There is always an issue of a threshold selection for each PWM in predicting the new instance of the PWM. In Match and P-Match, three threshold values (minimum false positive value (minFP), minimum false negative value (minFN), and minimum of FP+FN) are generated for each PWM to satisfy users with different perspectives based on the sequences used to construct the PWM. This chapter investigates this problem by incorporating various sources of available information.
3.
P
ROPOSAL OF ANI
NTEGRATEDA
PPROACH THATH
AST
HREEC
OMPONENTS3.1. The Log Odd Score
The log odd score as described by Equation (6) is motif length dependent. For a consensus motif c of the PWM, the log-odd score
=
=
w i ci i c cb
f
b
p
V
1 , , 2)
)
(
)
(
(
log
(12).Vc is the best possible log-odd score of the PWM. For a subsequence s,
V =
sV
c means sis a best fit with the PWM and most likely a TFBS that the PWM specifies, while a
V
s=
0
means s is identical to the background and very unlikely to be a TFBS that the PWM specifies. Thus, we defined the goodness (G, Pan and Phan, 2008) of fit between s and the PWM as: c s
V
V
, whileV
s≥
0
0
, whileV
s<
0
(13). G =The value of G is between 0.00 and 1.00 since Vs Vc and is independent of pattern
length. From the G value, one could easily tell the confidence level of the putative TFBS that is found by a PWM regardless of the length of the subsequence.
3.2. Statistical Expectation
For a given PWM of length w, the theoretical number of motif variants is
4
w based on background model. Each motif variant has a probability of4
−w×
(
L
−
w
+
1
)
to appear in a sequence S of length L. We can enumerate each motif variants in the PWM space and calculate its log odd-score and G value. At a given threshold, assume n motif variants satisfy the threshold, thus the probability of the PWM appearing on S is)
1
(
4
×
−
+
=
−w
L
n
p
w (14).3.3. Information Content of the PWM
MAP score measures relative information content as compared with background and has been widely used and maintains a good balance between PWM specificity and diversity (Liu et al., 2002). However, the MAP score, as we can see from Equation (7), takes average information of all columns in the PWM. This simplistic averaging effect implicitly penalizes longer PWMs that usually have higher proportion of degraded columns that have lower information content. Overall information content on the other hand, as described by Equation (5), captures all information in the PWM.
3.4. Proof of Concept
For proof of concept, we retrieved 107 PWMs from JASPAR core database (Sandelin et al., 2004) on September 19, 2007. Since these PWMs are trained from different organisms ranging from yeast, insects to human and other mammals, we set the background probability as default (fb = 0.25, b= {A, C, G, T}) and calculated best log-odd score, statistical
expectation at different thresholds of G, MAP score, and information content of the PWM. For a given G threshold gt, we are interested to know the statistical expectation of finding
a motif variant having a G value higher than gt. This probability is called p_value associated
with the given gt. Theoretically, we calculate the probability density function, e(g), over the
entire g span (from 0 to 1). It is established by counting the number of motif variants found in a given interval g. The probability distribution function, E(g), is then determined by
=
ge
d
g
E
0(
)
)
(
τ
τ
(15).And the p_value is determined by
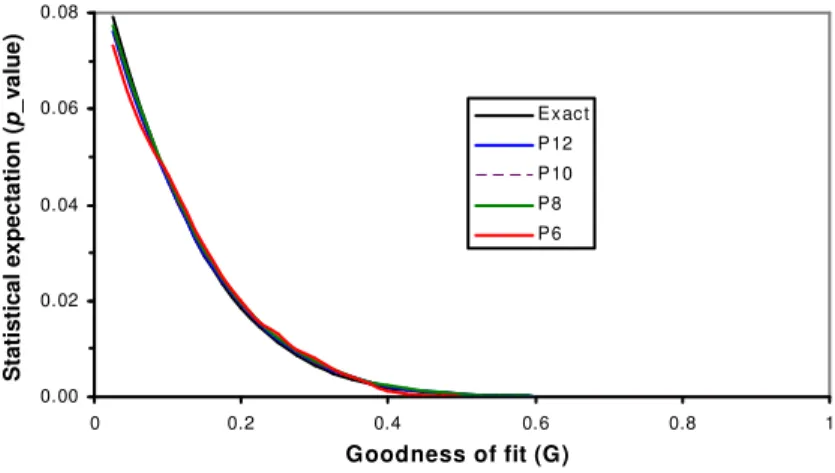
Figure 1 shows the p-value function of the human PWM PAX2_01 (from TRANSFAC). With knowledge of p_value, we can now select a proper threshold with a desired level of confidence. This in turn suggests that for every PWM, we establish an accompanying p_value table. The G threshold can be selected from the table according to the desired confidence level.
0.00 0.02 0.04 0.06 0.08 0 0.2 0.4 0.6 0.8 1 S im ilarity p _ v a lu e Exact P12 P10 P8 P6 Goodness of fit (G) S ta ti s ti c a l e x p e c ta ti o n ( p _ v a lu e ) 0.00 0.02 0.04 0.06 0.08 0 0.2 0.4 0.6 0.8 1 S im ilarity p _ v a lu e Exact P12 P10 P8 P6 Goodness of fit (G) S ta ti s ti c a l e x p e c ta ti o n ( p _ v a lu e )
Figure. 1. p_value function of human PWM PAX2_01. Exact: all instances in the PWM space are evaluated, Px: 4x instances from the PWM space are sampled.
The establishment of the p-value function for a lengthy PWM is computationally expensive. For example, a PWM of 24 columns would take more than 100 days to complete the calculation under the current state of technology. To alleviate this problem, we devised a random sampling scheme to perform the calculation. Intuitively,
)
(
)
(
g
lim
e
g
e
n N n→=
(17),
where n is the number in the sampling subspace from the entire PWM space of N = 4w (w is the length of PWM) and en(g) is the density function obtained by evaluating the G value of
Equation (13) over the selected n variants. We verified that our random sampler and ensured distinct motif variants with no single repeat within the PWM space before it was used for random sampling. The p_value functions based on random sampling were verified to be technically identical as if the entire PWM space is sampled as long as sampling size was over 410 (Fig. 1). It is feasible to perform exact calculation for a PWM of w <= 18. For a PWM of w > 18, we applied the random sampling scheme to perform the computation.
The result indicates that the statistical expectation is highly correlated (p < 0.0001) with PWM length (w), information content, and the best log-odd score (Table 1). It appears that MAP score is not able to reveal the statistical expectation of a PWM since MAP score implicitly penalized longer PWM as described above. In this regard, we conducted the correlation analysis for the 19 PWMs that have equal length of 10. The correlation (MAP for L=10) appears to increase as result of this selection, but still not comparable with others such as best log-odd score, information content and PWM length. Additionally, in order to eliminate the effect of PWM length, we also calculated the cumulative information of 5 columns in the PWM that have the highest information content and named it as core
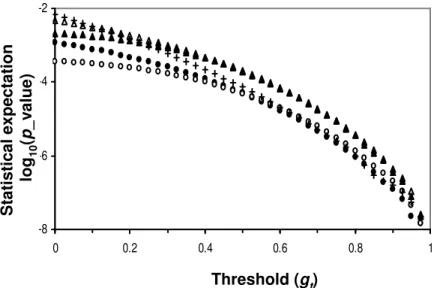
information and analyzed its correlation with p_value regardless of the length of PWM. This correlation appears to be significant at lower G threshold and is not helpful in selection of a threshold value. Thus, the core information is not considered further. At a given length of PWM, the p_values significantly correlated with threshold G values (Fig. 2).
Table 1. Correlation between the statistical expectations values and various properties of the 107 PWMs from JASPAR core database at a given threshold of G value.
G> 0 0.1 0.2 0.3 0.4 0.5 0.6 0.7 0.8 0.9 0.95 Length 0.57 0.56 0.65 0.71 0.77 0.83 0.88 0.91 0.95 0.97 0.98 Information 0.93 0.95 0.97 0.98 0.99 0.98 0.96 0.93 0.88 0.83 0.80 Core Info 0.73 0.72 0.70 0.66 0.61 0.53 0.46 0.39 0.30 0.22 0.19 Best Log-odd 0.78 0.81 0.84 0.89 0.93 0.97 0.99 1.00 0.99 0.98 0.96 MAP score 0.10 0.09 0.08 0.05 0.00 0.12 0.12 0.19 0.28 0.39 0.44 MAP(L=10) 0.23 0.29 0.36 0.43 0.52 0.58 0.64 0.68 0.61 0.45 0.06
Note: The underlined correlation coefficients are at p < 0.0001. The italicized correlation coefficients are at p < 0.05. The row of "MAP (L=10)" has n = 19. All other rows have n = 107.
-8 -6 -4 -2 0 0.2 0.4 0.6 0.8 1 Threshold (gt) P ro b a b il it y (l o g v a lu e ) Threshold (gt) S ta ti s ti c a l e x p e c ta ti o n lo g1 0 (p _ v a lu e )
Figure 2. Relationship between probability and threshold G value of the 5 PWMs (MA0010, MA0017, MA0046, MA0069, MA0082). w = 14.
3.5. Integration
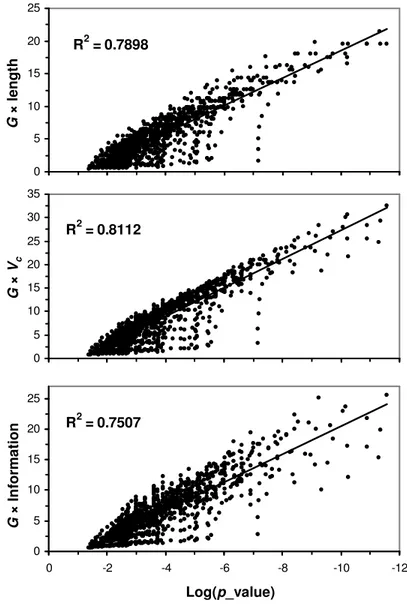
It is obvious that a selection of threshold should be based on a selection of G value in combination of either of PWM length (w), information content, or the best log-odd score. Since length factor implicitly incorporated in both information content and the log-odd score, we select the better one between information content and the best log-odd score. Figure 3
indicates that a combination of G values with the best log-odd scores performs better in representing the statistical expectation than the combination of G values with information contents. Thus, a combination of G values with the best log-odd scores is used as a guide to selecting a G threshold. The combination simply revert G values back to log-odd score.
R2 = 0.7898 0 5 10 15 20 25 -12 -10 -8 -6 -4 -2 0
Probability (log value)
G * l e n g th R2 = 0.8112 0 5 10 15 20 25 30 35 -12 -10 -8 -6 -4 -2 0
Probability (log value)
G * b e s t_ s c o re G × le n g th G × Vc R2 = 0.7507 0 5 10 15 20 25 -12 -10 -8 -6 -4 -2 0
Probability (log value)
G * I n fo rm a ti o n Log(p_value) G × In fo rm a ti o n
Figure 3. Correlation between statistical expectation and the combination of G value with various properties of the PWM.
4.
A
PPLICATIONSWe applied the above method to generate the statistical expectation function (over G) for each of the 585 vertebrate PWMs and 56 yeast PWMs from TRANSFAC database (Matys et al., 2006). The background probabilities are generated from enumeration of the nucleotides in
all known genes’ promoters of each species. We also searched for the putative binding sites of yeast transcription factors GCN4 and ROX1 using the TRANSFAC yeast PWMs, GCN4_C and ROX1_Q6, respectively. Finally, we searched for putative binding sites of the human tumor suppressor HIC-1 using the two vertebrate PWMs, HIC1_02 and HIC1_03, from TRANSFAC. In order to keep simplicity in calculation, no pseudo-count is applied in these applications. Therefore, all subsequences that contain a nucleotide with a 0.00 probability in the PWM are not considered in this study.
4.1. Vertebrate and Yeast PWMs
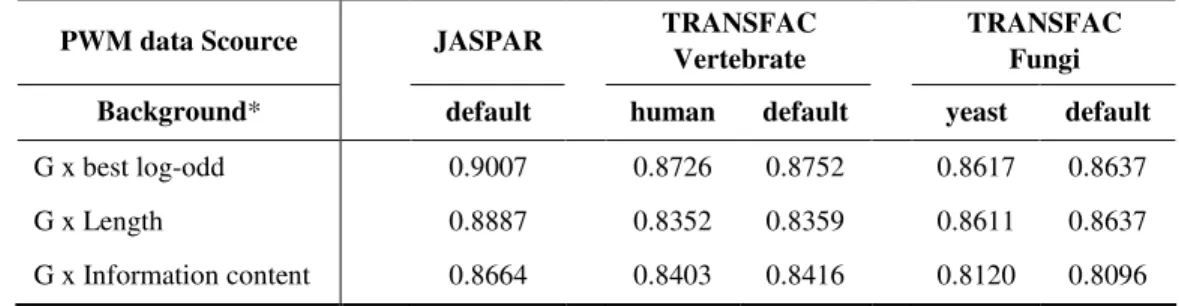
We used both species specific background and default background for comparison. The results indicate there is no perceivable difference between the two with regard to correlation between a combination of G value with PWM length, best log-odd score, or information content on one hand and the statistical expectation on the other (Table 2). Both vertebrate and yeast data confirms that a combination of G value with best log-odd score is the best in representing the statistical expectation.
Table 2. Correlation between the statistical expectations with various properties of PWMs from three different databases
PWM data Scource JASPAR TRANSFAC
Vertebrate
TRANSFAC Fungi
Background* default human default yeast default
G x best log-odd 0.9007 0.8726 0.8752 0.8617 0.8637 G x Length 0.8887 0.8352 0.8359 0.8611 0.8637 G x Information content 0.8664 0.8403 0.8416 0.8120 0.8096 * Background: default = {0.25, 0.25, 0.25, 0.25}; human = {0.2259, 0.2716, 0.2767, 0.2258}; yeast = {0.3096, 0.1932, 0.1893, 0.3079}.
4.2. Yeast Genes
Among the available data, the yeast genome (Saccharomyces cerevisiae) is best studied. From the TRANSFAC database (Version 10.4), we retrieve two PWMs (GCN4_C and ROX1_Q6), which model the binding sites for transcription factors GCN4 and ROX1, respectively. The promoter sequences of all 5769 genes from SGDgene table were retrieved from the UCSC Genome Browser (http://genome.ucsc.edu/). The promoter sequences contain 600 bp upstream of the transcription start site (TSS). In order to validate the result, we retrieved the known (documented) associations between the transcription factors and their respective target genes from YEASTRACT database (Teixeira et al., 2006).
We searched the promoter sequences by using the two PWMs and setting different thresholds of G values ranging from 0.40 to 1.00. At each threshold, we considered a putative association between a TF and a target gene if a putative binding site of the TF is found in the
promoter sequence of this gene. The result of such putative association is validated by known associations obtained from the YEASTRACT database.
For the purpose of comparison, we apply the terminology of Sensitivity (Sn) and Positive Predictive Value (PPV) as defined in (Altman and Bland, 1994a, 1994b). Sensitivity is the proportion of all known associations (TP+FN) that are accurately predicted (TP); and the Positive Predictive Value is the proportion of predicted associations (TP+FP) that are true (TP). Traditionally, Specificity (proportion of negatives that are predicted false) is used in the evaluation of a method. In genomic sequences, true negative (TN) is predominately higher than any of FP, TP or FN. Specificity as defined in Altman and Bland (1994a) would not be able to reveal signals effectively as its value would be very close to 1.00 in almost all instances (Burset and Guigo, 1996). Therefore, we adopted the Positive Predictive Value instead of Specificity in this study so that the signals can be comparable.
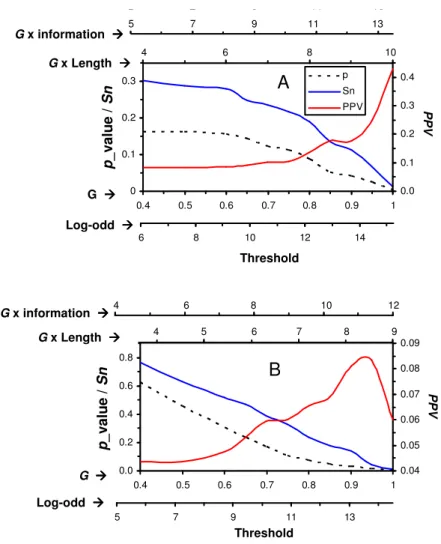
5 7 9 11 13 5 7 9 11 13 0 0.1 0.2 0.3 0.4 0.5 0.6 0.7 0.8 0.9 1 p / S n 0.0 0.1 0.2 0.3 0.4 p Sn PPV 6 8 10 12 14 4 6 8 10 4 6 8 10 Log-odd G G x Length G x information
A
p _ v a lu e / S n P P V Threshold 0.0 0.2 0.4 0.6 0.8 0.4 0.5 0.6 0.7 0.8 0.9 1 p / S n 0.04 0.05 0.06 0.07 0.08 0.09 5 7 9 11 13 3 5 7 9 3 4 5 6 7 8 9 4 6 8 10 12 4 6 8 10 12 Log-odd G G x Length G x informationB
p _ v a lu e / S n P P V ThresholdFigure 4. Performance evaluation on yeast data application case. The plot legends in panel A (GCN4_C) also apply to panel B (ROX1_Q6). Sn: sensitivity, PPV: positive predictive value, p: probability.
By decreasing the threshold, more known associations between TFs and their targets are found by the corresponding PWM as reflected by the Sensitivity values (Fig. 4). However, the number of false positives increases as reflected by the Positive Predictive Values. Based on the p_value, users will be able to find a corresponding threshold. For example, the log-odd threshold (p 0.05) should be 13 for GCN4_C and 12.25 for ROX1_Q6.
4.3. Human Cancer Genes
We retrieved 406 cancer gene entries from the CancerGenes Resequencing Resource (Higgins et al., 2006). These 406 entries represent 385 distinct genes. We retrieved promoter sequences of these cancer genes from the UCSC Genome Browser (http://genome.ucsc.edu/). The promoter sequences cover the range of 1000 bp upstream and 200 bp downstream of TSS with a total length of 1200 bp. We included the 200bp downstream sequences in this study to account for potential alternative TSS annotations that way appear in some genes. We retrieved two PWMs (HIC1-02, HIC1_03) for a tumor suppressor gene HIC-1 from the TRANSFAC database and searched the promoter sequences for putative TFBSs that fit the two PWMs over the G threshold between 0.40 and 0.90. There is no similar database to YEASTRACT for known associations between the transcription suppressor and its target genes in the human genome.
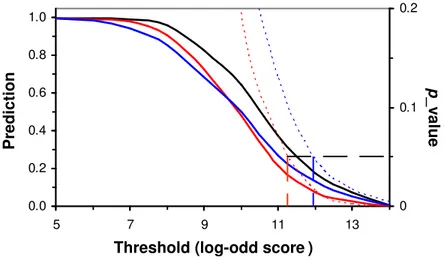
We searched promoters of human cancer genes and predicted about 20% of these cancer gene have potential association with the transcription suppressor HIC-1 (Fig. 5, p 0.05). Since our promoter sequences are from a normal human individual (not a cancer patient), it is not unreasonable that 20% of the cancer genes are associated with the transcription suppressor. 0.0 0.2 0.4 0.6 0.8 1.0 5 7 9 11 13 0 0.1 0.2
Threshold (log-odd score )
P re d ic ti o n p _ v a lu e
Figure 5. Prediction of association of transcription factor HIC1 with target human cancer genes. Red: predicted by HIC1_02, Blue: predicted by HIC1_03, Black: union prediction of HIC1_02 and HIC1_03. Solid curves: predicted percentage, Doted curves: variation of p_values. Broken lines: marks of significant levels (p<0.05).
4.4. Comparison with Match
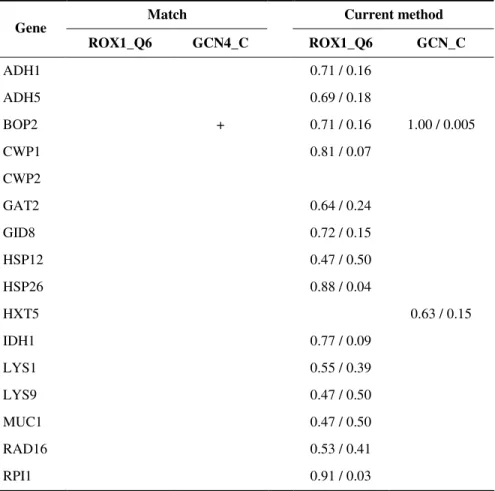
We identified 16 yeast genes (Table 3) that are known to be associated with both transcription factors GCN4 and ROX1 (YEASTRACT database, Teixeira, et al., 2006) and used them to validate our method and compared it with Match (Kel et al., 2003). While using the default similarity threshold, Match could only find one of the 32 known associations. All associations are found by Match when decrease the threshold because it considers pseudo-count, which would guarantee to find all instance at a low threshold and to have very high false positive predictions. Without knowing their statistical expectation, we did not include those misleading predictions in Table 3. Our method found 16 of the 32 associations, of which 3 are significant (p < 0.05).
Table 3. Validation and comparison with Match (Kel.et al., 2003). The values in the current method columns indicate that the associations are found at threshold of G /
p_value.
Match Current method
Gene ROX1_Q6 GCN4_C ROX1_Q6 GCN_C ADH1 0.71 / 0.16 ADH5 0.69 / 0.18 BOP2 + 0.71 / 0.16 1.00 / 0.005 CWP1 0.81 / 0.07 CWP2 GAT2 0.64 / 0.24 GID8 0.72 / 0.15 HSP12 0.47 / 0.50 HSP26 0.88 / 0.04 HXT5 0.63 / 0.15 IDH1 0.77 / 0.09 LYS1 0.55 / 0.39 LYS9 0.47 / 0.50 MUC1 0.47 / 0.50 RAD16 0.53 / 0.41 RPI1 0.91 / 0.03
5.
D
ISCUSSIONSPositional weight matrix has been extensively used in discovery of sequence motifs, such as transcription factor binding sites. The main challenge in using PWM is to find a threshold
for various objective functions. There is no substantial breakthrough so far in solving this problem. Match (Kel et al, 2003) appears more appealing than the others and widely used. Match takes the maximum and minimum score and scales them between 0.00 and 1.00 and it also takes into consideration five consecutive nucleotides whose maximum score is the best in any region of the PWM space. P-Match (Chekmenev et al., 2005) combines pattern matching and weight matrix approaches and claimed to be more accurate. We tried to search for the GCN4_C and ROX1_Q1 motifs using P-Match, but unable to find any by the threshold setting defined by those authors. It is expected to find all associations at a lower threshold same as those predicted by Match. However, those potential associations would be buried in a large amount of false positive predictions. Without prior knowledge of these associations, it would be nearly impossible to distinguish them from false positives. For the methods such as Match and P-Match, without an indication of statistical expectation of the predicted motifs, users would be skeptical on the result.
Nucleotide frequency varies across different genomes, for example, the frequencies of A, C, G, T in human promoter sequences are 0.23, 0.27, 0.27 and 0.23, respectively, which are not too much different from the default frequency (0.25 for each nucleotide). But in the yeast promoter sequences, they are 0.31, 0.19, 0.19 and 0.31, respectively. For this reason, we use genome specific nucleotide frequency. Additionally, the nucleotide frequencies vary over various regions of genomics sequences (Pan et al., 2004, Smith et al., 2007). For more precise prediction, regional nucleotide frequencies should be applied.
Occasionally, the log-odd score of a motif could be dominated by one or a few positions because of their extremely high or low frequency values for certain nucleotide(s). Probably, one could argue that a log-odd value of 0.00 for a subsequence might not represent its identity with the background model because the influence of one or more high value(s) of the high frequency nucleotide(s) at certain position(s) is neutralized by the influence of one extremely low value derived from a low frequency nucleotide at another position. Nevertheless, because the overall log-odd score is close to 0.00, no matter whether it is caused by the neutralization of frequencies across various positions or by overall values close to 0.00, this subsequence is not likely a true TFBS. Therefore, a 0.00 log-odd score indicates the subsequence is most unlikely a TFBS.
It is important to consider the statistical expectation of a predicted motif instance. With the density function that we generated for each PWM, it is convenient to find the statistical expectation of each predicted motif instance base on its G value. This G value can easily be reverted back to log-odd score or relative information as can be seen in Fig. 4. Since log-odd value is closely related with statistical expectation as indicated in this study, people would question the necessity of going through the step of G value. The necessity of G value step is demonstrated through the generation of p_value distribution and through its value in measuring the distance between the generated log-odd value and the PWM as compared to the background.
A transcription factor usually binds on a DNA sequence through several positions. Numerous previous studies indicated that the positions inside a motif are somewhat interdependent. For this reason, PWMs are converted to high order hidden Markov models (Krogh et al, 1994). The log-odd score of a motif instance can be calculated based on the state transition probability (e.g. Viterbi score) of the high order hidden Markov model. The same calculation proposed in Equation (13) can be applied to scale the log-odd scores derived from hidden Markov models and statistical expectations can be calculated accordingly.
Many biological problems can not be easily revealed by simply measuring statistical expectation. For example, in our application of yeast genome, too stringent threshold would exclude many potential candidates, such as the threshold set in Match for the two yeast PWMs (Table 3) and our work in ROX1_Q6 (Fig. 4B). With varying threshold incorporating both the G values and the distribution function of statistical expectation, we are able to find more motifs using the method proposed in this paper.
Generally, a less stringent threshold would incur higher false positive prediction (Fig. 4). This can be complemented by incorporating other information such as microarray gene expression data (Hertzberg et al., 2007) or through comparative genomic approaches (e.g. Newberg et al., 2007). Incorporating gene expression data is certainly a boost in motif finding. However, such data are not always available. With comparative genomics approach, it is arguable even though some successes were shown. Our recent study indicates that promoters of most human genes are significantly different from their orthologues in mice or rats. Similarly, the divergence in the binding sites of the pseudohyphal regulators Ste12 and Tec1 among three closely related yeasts, Saccharomyces cerevisiae, S. mikatae, and S. bayanus, is significant (Borneman et al., 2007). In that case, substantial number of functional motifs in one organism may not appear in the promoter of orthologous genes in another organism, even if both are closely related. Such motifs could be excluded during the prediction process.
Based on the application cases, we suggest taking consideration of both objective function scores and statistical expectation in selecting a threshold. In choosing a threshold, log-odd score appears to be a good objective function as compared with other functions. It is highly correlated with statistical expectation.
In the application of cancer genes, we predicted 20% of the 385 cancer genes are subjected to transcription suppression of HIC-1. Since the promoter sequences are from normal human genome, one would expect all cancer genes are suppressed one way or another. We need to realize that many other cancer gene suppressors are not included in this study. For example, the popular cancer suppressor gene P53 is one among many others.
6.
C
ONCLUSIONSIn prediction of a sequence motif using positional weight matrix, it is important to find a statistically meaningful threshold. In this chapter, we described an approach to find a threshold that incorporates the goodness-of-fit of a subsequence to a PWM, statistical expectation, and information content. We demonstrated the strength of this approach through various application cases and compared the method favorably with the broadly used Match method using 16 yeast genes of known association with two transcription factors. We also predicted that 20% of the known cancer genes have association with the tumor suppressor gene HIC-1.
R
EFERENCESAltman DG, Bland JM, 1994a. Statistics Notes: Diagnostic Tests 1 - sensitivity and specificity. British Medical Journal 308: 1552.
Altman DG, Bland JM, 1994b. Statistics Notes: Diagnostic Tests 2 - Predictive Values. British Medical Journal 309: 102.
Bailey EL, Elkan C, 1994. Fitting a mixture model by expectation maximization to discovery motifs in biopolymers. In: Proceeding of the Second International Conference on intelligent System for Molecular Biology. AAAI Press, pp. 28-38.
Becker MM, Wang JC, 1984. Use of light for footprinting DNA in vivo. Nature 309: 682-687.
Blanchette M, Tompa M, 2002. Discovery of regulatory elements by comparative method for phylogenetic footprinting. Genome Res 12: 739-748.
Borneman AR, Gianoulis TA, Zhang ZD, et al., 2007. Divergence of transcription factor binding sites across related yeast species. Science 317: 815-819.
Bulyk ML, Huang X, Choo Y, Church GM. Exploring the DNA-binding specificities of zinc fingers with DNA microarrays. PNAS 98: 7158-7163.
Burset M, Guigo R, 1996. Evaluation of gene structure prediction programs. Genomics 34: 353–367.
Cartharius K, Frech K, Grote K, et al, 2005. MatInspector and beyond: promoter analysis based on transcription factor binding sites. Bioinformatics 21: 2933-2942.
Chekmenev DS, Haid C, Kel AE, 2005. P-Match: transcription factor binding site search by combining patterns and weight matrices. Nucleic Acids Res 33: W432-437.
D’haeseleer P, 2006. How does DNA sequence motif discovery work? Nature Biotechnology
24: 959-961.
Favorov AV, Gelfand MS, Gerasimova AV, Ravcheev DA, Mironov AA, Makeev VJ, 2005. A Gibbs sampler for identification of symmetrically structured, spaced DNA motifs with improved estimation of the signal length. Bioinformatics 21: 2240-2245.
Friberg M, von Rohr P, Gonnet G, 2005. Scoring functions for transcription factor binding site prediction. BMC Bioinformatics 6: 84.
Hertzberg L, Izraeli S, Domany E, 2007. STOP: searching for transcription factor motifs using gene expression. Bioinformatics 23: 1737-1743.
Higgins ME, Claremont M, Major JE, Sander C, Lash AE, 2006. CancerGenes: a gene selection resource for cancer genome projects. Nucleic Acids Res 35: D721-726.
Horak CE, Snyder M, 2002. ChIP-chip: A genomic approach for identifying transcription factor binding sites. Methods In Enzymology 350: 469-483.
Hughes JD, Estep PW, Tavazoie S, Church GM, 2000. Computational identification of cis-regulatory elements associated with groups of functionally related genes in Saccharomyces cerevisiae. J Mol Biol 296: 1205-1214.
Kel AE, Gossling E, Reuter I, et al, 2003. MATCH: A tool for searching transcription factor binding sites in DNA sequences. Nucleic Acids Res 31: 3576-3579.
Kiedzierska A, Smietana K, Czepczynska H, Otlewski J, 2007. Structural similarities and functional diversity of eukaryotic discoidin-like domains. Biochim Biophys Acta
1774:1069-1078.
Krogh A, Brown M, Mian IS, Sjolander K, Haussler D, 1994. Hidden Markov models in computational biology: application to protein modeling. J Mol Biol 235: 1501-1531. Kullback S, Leibler RA, 1951. On information and sufficiency. Ann Math Stat 22: 79-86. Lawrence CE, Reilly AA, 1990. An expectation maximization (EM) algorithm for the
identification and characterization of common sites in unaligned biopolymer sequences. Proteins Struct funct Genet 7: 41-51
Lawrence CE, Altschul SF, Boguski MS, Liu JS, Neuwald AF, Wootton JC, 1993. Detecting subtle sequence signals: a Gibbs sampling strategy for multiple alignments. Science 262: 208-214.
Li L, Liang Y, Bass RL, 2007. GAPWM: a genetic algorithm method for optimizing a position weight matrix. Bioinformatics 23: 1188-1194.
Li N and Tompa M, 2006. Analysis of computational approaches for motif discovery. Algorithms for Molecular Biology 1:8.
Liu JS, Lawrence CE, Neuwald A, 1995. Bayesian models for multiple local sequence alignment and its Gibbs sampling strategies. J Amer Statist Assoc 90: 1156-1170.
Liu X, Brutlag DL, Liu JS, 2001. BioProspector: discovering conserved DNA motifs in upstream regulatory regions of co-expressed genes. Pac Symp Biocomput 2001: 127-138. Liu X, Brutlag DL, Liu JS, 2002. An algorithm for finding protein-DNA binding sites with
applications to chromatin-immunoprecipitation microarray experiments. Nature Biotech
20: 835-839.
Liu Y, Liu XS, Wei L, Altman RB, Batzoglou S, 2004. Eukaryotic regulatory element conservation analysis and identification using comparative genomics. Genome Res 14: 451-458.
Matys V, Kel-Margoulis OV, Fricke E, et al, 2006. TRANSFAC and its module TRANSCompel: transcriptional gene regulation in eukaryotes. Nucleic Acids Res 34: D108-110.
Moses AM, Chiang DY, Eisen MB, 2004. Phylogenetic motif detection by expectation-maximization on evolutionary mixtures. Pac Symp Biocomput 2004: 324-35.
Mukherjee S, Berger MF, Jona G, et al, 2004. Rapid analysis of the DNA-binding specificities of transcription factors with DNA microarrays. Nat Genet 36: 1331-1339. Newberg LA, Thompson WA, Conlan S, Smith TM, McCue LA, Lawrence CE 2007. A
phylogenetic Gibbs sampler that yields centroid solutions for cis-regulatory site prediction. Bioinformatics 23:1718-1727
Orlando V, 2000. Mapping chromosomal proteins in vivo by formaldehyde-crosslinked-chromatin immunoprecipitation. Trends Biochem Sci 25: 99-104.
Pan Y, 2006. Advances in the Discovery of cis-Regulatory Elements. Curr Bioinfo 1:321-336 Pan Y, Phan S, 2008. Guide to Threshold Selection for Motif Prediction Using Positional
Weight Matrix. Proceedings of the IAENG International Conference in Bioinformatics (ISBN: 978-988-98671-8-8), March 19-21, 2008, Hong Kong; pp 151-156.
Pan Y, Smith B, Fang H, Famili FA, Sikorska M, Walker PR, 2004. Selection of putative cis-regulatory motifs through regional and global conservation. In: Proceedings of the 2004 IEEE Computational System Bioinformatics Conference (CSB2004), 16-19 August 2004, Stanford, CA, USA 2004; pp 684-685.
Pavesi G, Mereghetti P, Mauri G, Pesole G, 2004. Weeder web: discovery of transcription factor binding sites in a set of sequences from co-regulated genes. Nucleic Acids Res 32: W199-203.
Prakash A, Blanchette M, Sinha S, Tompa M, 2004. Motif discovery in heterogeneous sequence data. Pac Symp Biocomput 2004; 248-259.
Sandelin A, Alkema W, Engstrom P, Wasserman WW, Lenhard B, 2004. JASPAR: an open-access database for eukaryotic transcription factor binding profiles. Nucleic Acids Res 32: D91-94.
Schneider TD and Stephens RM, 1990. Sequence logos: a new way to display consensus sequences. Nucleic Acids Res. 18: 6097-6100.
Schneider TD, Stormo GD, and Gold L, 1986. Information content of binding sites on nucleiotide sequences. J Mol Biol 198: 415-431.
Schreiter ER, Drennan CL, 2007. Ribbon-helix-helix transcription factors: variations on a theme. Nat Rev Microbiol. 5:710-720.
Shannon CE, 1948. A mathematical theory of communication. Bell System Tech J 27: 379-423, 623-656.
Siddharthan R, Siggia ED, van Nimwegen E, 2005. PhyloGibbs: a Gibbs sampling motif finder that incorporates phylogeny. PLoS Comput Biol 2005; 1: 534-56.
Siepel A. Haussler D, 2005. Phylogenetic hidden Markov models. In: Nielsen R Ed, Statistical Methods in Molecular Evolution. Springer, New York 2005; pp 325–351. Sinha S. Discriminative motifs, 2003. J Comput Biol 10: 599-615.
Sinha S, Blanchette M, Tompa M, 2004. PhyME: a probabilistic algorithm for finding motifs in sets of orthologous sequences. BMC Bioinformatics 5: 170.
Sinha S, Tompa M, 2002. Discovery of novel transcription factor binding sites by statistical overrepresentation. Nucleic Acids Res 30: 5549-5560.
Smith B, Fang H, Pan Y, Walker PR, Famili AF, Sikorska M, 2007. Evolution of motif variants and positional bias of the cyclic-AMP response element. BMC Evol Biol. 7: S15. Solomon MJ, Varshavsky A, 1985. Formaldehyde-mediated DNA-protein crosslinking: a
probe for in vivo chromatin structures. PNAS 82: 6470-6474.
Stormo GD, 2000. DNA binding sites: representation and discovery. Bioinformatics 16: 16-23.
Teixeira MC, Monteiro P, Jain P, et al. 2006. The YEASTRACT database: a tool for the analysis of transcription regulatory associations in Saccharomyces cerevisiae. Nucleic Acids Res. 34: D446-451.
Thijs G, Lescot M, Marchal K, et al, 2001. A higher order background model improves the detection of regulatory elements by Gibbs Sampling. Bioinformatics 17: 1113-1122. Thompson W, Rouchka EC, Lawrence CE, 2003. Gibbs recursive sampler: finding
transcription factor binding sites. Nucleic Acids Res 31: 3580-3585.
Thompson WA, Newberg LA, Conlan S, McCue LA, and Lawrence CE 2007. The Gibbs Centroid Sampler. Nucleic Acids Res 35: W232-237.
Tompa M, Li N, Bailey TL, et al, 2005. Assessing computational tools for the discovery of transcription factor binding sites. Nat Biotech 23: 137-144.
Workman CT and Stormo GD, 2000. ANN-Spec: a method for discovering transcription factor binding sites with improved specificity. Pac Symp Biocomput 2000: 467-478. Zhang MQ, 2002. Computational methods for promoter recognition. In: Jiang T, Xu Y,
Zhang MQ Eds, Current Topics in Computational Molecular Biology. MIT Press, Cambridge, Massachusetts. pp 249-268.
Zhu X, Gerstein M, Snyder M, 2007. Getting connected: analysis and principles of biological networks. Genes & Dev 21: 1010-1024.