XV. COMMUNICATIONS BIOPHYSICS
Prof. W. A. Rosenblith
Dr. T. T. Sandel
G. E. Forsen
Prof. M.
H. Goldstein,
Jr.
Dr.
W.
Storm van Leeuwenttt Margaret Z.
Freeman
Dr.
J.
S. Barlowf
W.
A. Clark, Jr. tt
C. D. Geisler
Dr.
M. A. B. Braziert
O.
C. Gutierrez$$J
J.
L.
Hall II
Dr.
Eda Berger$
Aurice V. Albert
H. J. Krauer
Dr.
Murray Eden"-*
J. Allen***
C.
E.
Molnar
Dr.
B. G. Farley--
R. M. Brown
D.
F. O'Brien
Dr.
G. L. Gerstein$$
J.
D. Cowantttt
W.
T.
Peake
Dr.
N. Y-S. Kiang
A. H. Crist
D. A.
Sclafani
Dr. J.
W. Kuiper***
G. H. Cronin II
T. F. Weiss
A.
QUANTITATIVE METHODS IN THE ANALYSIS OF NEUROELECTRIC
ACTIVITY (1)
The ease with which "new" neurophysiological phenomena can be discovered and
observed stands in marked contrast to the practical difficulties that are encountered
when one attempts to quantify neuroelectric activity with a view towards formulating
related theoretical models that are both descriptive and predictive in character.
Four
major obstacles to such quantification are: (i) Neuroelectric events, though in
prin-ciple definable, are not always visually detectable.
(ii) Even clearly detectable
neuroelectric events exhibit considerable variability, especially when one records from
the higher neural centers of unanesthetized animals; it is this variability that renders
the description of the "typical" event so hazardous.
(iii) It is seldom possible to
describe meaningfully these spatio-temporal patterns of neural activity by a single
number.
(iv) Often, measured characteristics become significant only as they are
related to neuroanatomical data, to studies of physiological background activity, or
even to psychophysical judgments.
The inherent variability of the electrical activity of the nervous system forces us
to choose procedures that result in statistical estimates of the quantities of interest to
This work was supported in part by the U.S.
Air Force under Contract
AF19(604)-4112.
tFrom the Neurophysiological Laboratory of the Neurology Service of the Massachusetts General Hospital. SPostdoctoral Fellow of the National Institute of Mental Health.
Research Associate on leave from the National Heart Institute. tStaff Member, Lincoln Laboratory, M. I. T.
"Postdoctoral Fellow of the National Institute of Neurological Diseases and Blindness. Sloan Postdoctoral Fellow of School for Advanced Study, M. I. T.
Research Associate in Communication Sciences; also, Research Fellow in Neurology, Massachusetts General Hospital (Visiting Fulbright Fellow from Electro-Neurological Department, Academisch Ziekenhuis, Leiden).
InDoherty Foundation Fellow.
Ramo-Wooldridge Fellow in Systems Engineering.
tttGraduate Fellow of British Tabulating Machine Company, Ltd.
(XV. COMMUNICATIONS BIOPHYSICS)
us. The reliability and validity of these statistical estimates depends clearly on the number of events that compose the sample population from which the estimates are derived. If the variability of the observed events is great, the number of samples required in order to draw valid inferences is also large - a circumstance that makes the application of many established neurophysiological techniques impractical.
We have attempted to solve this problem by using digital and analog computers for the reduction of electrophysiological data. The types of events that we have attempted to quantify are (i) responses evoked by sensory stimuli, and (ii) time patterns of activity in electroencephalographic records.
Using computers, we have averaged the amplitudes of a number of responses evoked by identical stimuli at discrete instants in time following stimulus presentation. In order to obtain a measure of dispersion around the averages, sample variances have also been computed.
Using a correlator, we have analyzed EEG recordings to obtain estimates of the spectral composition and temporal relationships seen in the data. In this paper, these analysis techniques are described and results obtained through the use of these techniques are presented.
T. T. Sandel, C. E. Molnar, T. F. Weiss, J. S. Barlow, R. M. Brown, M. H. Goldstein, Jr., W. A. Rosenblith
References
1. Abstract of a paper presented at the International Conference on Medical Electronics, Paris, June 24, 1959.
B. COMPARISON OF EEG ACTIVITY RECORDED FROM HOMOLOGOUS LOCATIONS ON THE SCALP BY MEANS OF AUTOCORRELATION AND CROSSCORRELATION ANALYSIS
That there is a great degree of similarity and synchrony in the EEG activity recorded from homologously located scalp electrodes on human subjects has been well known since the early days of electroencephalography (1-3) and there has been much speculation on the underlying nature of this effect. Among the possible neuronal struc-tures that might operate to synchronize the activity on the hemispheres are the corpus callosum (4) and the reticular formation together with the diffuse thalamic projection system (5). In order to study the similarity of activity from the two sides of the head in normal subjects, and of the departures from normal activity that appear in patients with unilateral cerebral lesions, autocorrelations and crosscorrelation analyses were performed on magnetic tape recordings of EEG's.
As a standard against which to compare the results of the analysis of EEG
SINE WAVE (400 CPS) Delay T (msec) 0
.I 5 II 10 I15 20 I 25 I.
-NOS
3050CS
NOISE (300-500 CPS)
SINE WAVE * NOISE (Same r. m. s. amplitudes)
Fig. XV-1.
A
B
Autocorrelograms of a sine wave, filtered noise, and an equal amplitude
mixture of both. Duration of sample, T = 1. 5 seconds.
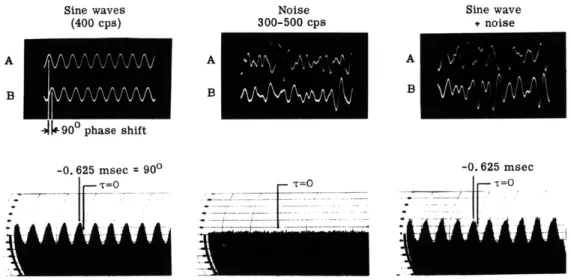
Sine waves (400 cps) Noise 300-500 cps Sine wave + noise -If 90" phase shift -0. 625 msec = T=0 900 T=O
Fig. XV-2.
Crosscorrelogram of two sine waves shifted in phase 90 and mixed with
two independent noise sources of the same rms amplitude. Duration of
sample, T = 1.5 seconds.
174
ALAI
-0. 625 msectr=O
I)-
-
I
----41 - I--- - - -----
C--- -- ~-_--(XV. COMMUNICATIONS BIOPHYSICS)
recordings, some data for signals of known properties are illustrated first. In Fig. XV-1 the autocorrelogram for a 400-cps sine wave, filtered noise of 300-500 cps bandwidth (with 18 db per octave roll-off outside these limits), and an equal amplitude mixture of these two signals are shown. The heavily damped sinusoidal form of the correlogram for the filtered noise (in contrast to the persistently uniform shape for the sine wave) simply illustrated the fact that the average correlation, or degree of coherence between any given wave in the noise (illustrated on the left side of Fig. XV-1) and the waves immediately following it are rapidly lost with increasing delay. The bottom photograph represents another property of autocorrelation functions, that of superposition, representing as it does the simple addition of the two autocorrelograms above it. The length of the sample used for these correlograms was so chosen that these results would be comparable with those for 1-minute recordings of EEG's with a dominant frequency of 10 cps.
In Fig. XV-2 some of the properties of the crosscorrelation analysis of two signals are illustrated. On the lower left, the crosscorrelogram of two 400-cps sine waves, the second of which is 90 ° out of phase with the first (see Fig. XV-1), is shown. The first peak in the center of the crosscorrelogram appears not at zero delay - which would have been tne case had there been no phase shift - but at -0. 625 msec, which indicates 900 phase shift for the 2.5-msec period of a 400-cps sine wave. On the lower right, the crosscorrelogram for a mixture of these same two sine waves with two independent noise signals of 300-500 cps bandwidth is shown, and the same shift in the first peak nearest zero delay is evident. The crosscorrelogram for the two noise signals alone is shown in the center; the essentially flat base line indicates that there is no coherence between these two signals when they are averaged. This irregularity is indicative of short-time correlation errors for the 1.5-sec sample that was used; the longer the sample, the less irregular the baseline. Figures XV-1 and XV-2 show the results of computations for 1-minute samples, so that they would normally be comparable with those for 1-minute EEG recordings.
In Fig. XV-2 the detection, by means of crosscorrelation, of a sinusoid common to two signals is illustrated; in Fig. XV-3 the converse is shown, that is, the ability of distinguishing (by this method of analysis) between two sinusoids that are very close but not identical in frequency. Two sine waves, differing in frequency by only 1 per cent, were crosscorrelated, and the result is essentially zero. The autocorrelograms, determined at the same gain settings of the machine, are also shown in Fig. XV-3. Had the sine waves been identical in frequency, the amplitude of the crosscorrelogram would have been sinusoidal in form and of an amplitude equal to that of the
autocorrelo-grams. It should be emphasized that the corresponding length of recording for an EEG with a dominant frequency of 10 cps may not be sufficiently long for comparable accu-racy, particularly for subjects whose EEG's are characterized by the appearance of rhythmic activity in trains that are separated by appreciable intervals of time, and hence
AUTOCORRELOGRAMS
CROSSCORRELOGRAM 400, 404 cps.
Fig. XV-3.
Autocorrelograms and crosscorrelogram of two sine waves differing in
frequency by 1 per cent. Duration of sample, T = 1.5 seconds.
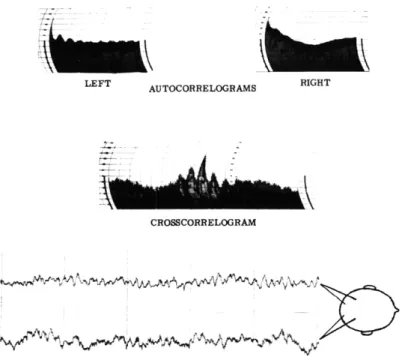
10.0 cps. ] LEFT AUTOCORRELOGRAMS 10. 0 cps. RIGHT 10. 0 Cps.r r=0 CROBSCORRELOGRAM 41
Second-Fig. XV-4.
Autocorrelograms and crosscorrelogram for a 1-minute simultaneous left
and right parieto-occipital recording from a normal human subject.
176
400 cps. 404 cps.
-- - ~ - -- 4
--(XV. COMMUNICATIONS BIOPHYSICS)
the length of the recording to be used for analysis must be appropriate for the particular determination that is being made.
Autocorrelograms and crosscorrelograms for simultaneous EEG recordings from bipolar parieto-occipital scalp electrodes for a normal human subject are shown in Fig. XV-4. The gain settings for the correlator were approximately 20 per cent higher for the crosscorrelogram than for the mean of the autocorrelograms. It is evident that the crosscorrelation is quite symmetrical about the point of zero delay, and this fact, together with the consideration of the gain settings for the crosscorrelogram in com-parison with those for the autocorrelograms, indicates that there is a great degree of similarity between the activity on the two sides. Moreover, the occurrence at zero delay of the peak deflection of the crosscorrelogram indicates that the activity recorded from these two electrode locations is synchronous, on the average, for the 1-minute recording that was analyzed.
Autocorrelograms and the crosscorrelogram for a 1-minute recording from similarly placed electrodes for another normal subject are shown in Fig. XV-5, and, again, a great degree of similarity between the activity on the two sides is apparent. A measure of the degree to which the activity on the two sides is independent, or asynchronous, can be obtained by comparison of the gain settings of the correlator for the autocorrelograms with those for the crosscorrelograms; in the example illustrated in Fig. XV-5, they were identical.
The symmetry of the crosscorrelogram about the point of zero delay, as illustrated in Figs. XV-4 and XV-5 has been a characteristic finding from all of the EEG recordings of normal subjects that have been examined thus far with these techniques, whether or not the activity is of the predominantly rhythmic type shown by these two subjects.
In contrast to the results for normal subjects, analysis of the recordings from similarly placed electrodes for a small number of patients with unilateral cerebral lesions has shown an asymmetry with respect to the point of zero delay in the crosscorrelogram, although the peak deflection in the crosscorrelogram is still found at zero delay. Such a result is illustrated in Fig. XV-6, for a preoperative recording from a patient with a tumor of the right cerebral hemisphere. The autocorrelogram for the abnormal side is different from that for the normal side, in that it shows a consid-erably greater content of slow-wave activity in comparison with the rhythmic activity at a rate of 10/sec on the normal side.
An even more marked asymmetry of the crosscorrelogram with respect to zero delay is apparent in Fig. XV-7, in which the results for another patient with a tumor of the right cerebral hemisphere are shown. On the left side, normal 10/sec activity is apparent in the autocorrelogram, but this activity is not present on the right side. The crosscorrelogram of the activity on the two sides shows maximum amplitude at zero delay, despite the marked asymmetry for positive, as compared with negative, values
RIGHT AUTOCORRELOGRAMS
CROSSCORRELOGRAM
Fig. XV-5.
Autocorrelograms and crosscorrelogram for a 1-minute simultaneous left
and right parieto-occipital recording from a normal human subject.
LEFT
AUTOCORRELOGRAMS RIGHT
4
CROSSCORRELOGRAM
MlJhu VA *A
Fig. XV-6.
Autocorrelograms and crosscorrelogram for a 1-minute recording from a
patient with a tumor of the right cerebral hemisphere. (R. A.).
178
4"E" Mw mhk
___
(XV. COMMUNICATIONS BIOPHYSICS)
LEFT AUTOCORRELOGRAMS muT
CROBSCORRELOGRAM
Fig. XV-7. Autocorrelograms and crosscorrelogram for a 1-minute recording from a
patient with a tumor of the right cerebral hemisphere.
(P. C.).
of the delay. It is unlikely that the peak in the crosscorrelogram at zero delay simply
represents spread of electric fields across the midline because the forms of the
auto-correlograms for the two sides are quite different. The possibility that the asymmetry
in the crosscorrelogram about the point of zero delay might result from an artefact of
sampling (for the 1-minute sample used) is one that must be further explored from the
analyses of longer recordings.
These results, both for normal subjects and for the two patients, indicate that there
is a good deal in common between the activity recorded from homologous locations on
the two sides of the head in the parieto-occipital region. It would be of interest to know
to what extent the activity on the two sides would still be similar when all of the neuronal
connections are severed that might serve a synchronizing function.
Not only
trans-callosal and transcommissural influences, but also common influences from single
mid-line structures in the brain stem (for example, the reticular formation), would be
included.
As a physiological approximation to the experiment of complete functional isolation
of the two hemispheres, Fig. XV-8 shows the results of an experiment in which
simul-taneous recordings of two normal subjects whose resting EEG tracings showed similar
dominant (alpha) frequencies were made.
Recordings were made at rest and also while
both subjects were being flashed simultaneously at a flash rate of 10/sec by means of
179
e~ I cl
-1~----~- --- --
--(XV.
COMMUNICATIONS BIOPHYSICS)
RESTING N S CcG r o IO/SEC FLASHING c.O, sI
Fig. XV-8. Autocorrelograms and crosscorrelograms for simultaneous recordings from two normal subjects at rest, and during 10/sec photic stimulation. Right parieto-occipital electrodes; 1-minute recording.
two synchronously triggered Grass stroboscopes. The autocorrelograms and the cross-correlogram for the resting recording are shown in the upper half of Fig. XV-8; it is evi-dent that the resting activity of both subjects was quite close in frequency, for both it was approximately 10.7/sec. Despite this similar dominant frequency for both subjects, the crosscorrelogram of the simultaneous recordings between the two subjects is everywhere essentially zero. However, in response to 10/sec flashing, the activity of both subjects was entrained at the flash frequency, as is apparent from the autocorrelograms in the lower part of Fig. XV-8, and with this common component now appearing in the EEG's of both subjects, the crosscorrelogram also shows a pronounced component at 10 cps.
These results confirm and enhance those obtained by other workers whose methods of study of the degree of similarity of the EEG activity for the two hemispheres, as recorded with scalp electrodes, are different. We plan to investigate, by means of experiments with simulated signals transformed in various ways (for example, by rectification), the nature of the asymmetry that appears in the crosscorrelogram for some patients with unilateral cerebral lesion.
J. S. Barlow, Margaret Z. Freeman
180
----1
__ I
il I-- -- ~---i ~~YewrQL\
.
I/LI
--^---(XV. COMMUNICATIONS BIOPHYSICS)
References
1. E. D. Adrian and K. Yamagiwa, The origin of the Berger rhythm, Brain 58, 323-351 (1935).
2. H. H. Jasper, Cortical excitatory state and synchronism in the control of bio-electric autonomous rhythms, Cold Spring Harbor Symposia on Quantitative Biology, Vol. IV, 1936, pp. 320-338.
3. H. H. Jasper and H. H. Andrews, Human brain rhythms: I. Recording tech-niques and preliminary results, J. Gen. Psychol. 14, 98-126 (1936).
4. F. Bremer and N. Stoupel, Etude des m6chanismes de la synergie bioelectrique des hemispheres cer(ebraux, Acta Physiol. Pharmacol. Neerlandica 6, 487-496 (1957).
5. B. Garoutte and R. B. Aird, Studies on the cortical pacemaker; synchrony and asynchrony of bilaterally recorded alpha and beta activity, EEG Clin. Neurophysiol. 10, 259-268 (1958).
C. PSYCHOACOUSTIC STUDY OF THE MECHANISM OF BINAURAL FUSION (1)
1. Introduction
When binaurally presented acoustic stimuli are sufficiently similar, the listener hears a single virtual source. The signals are then said to be fused. When the sounds reaching the two ears are sufficiently different, either in time of arrival, intensity or spectral composition, fusion fails and the listener hears two sources, one at each ear. When the stimuli fuse, the location of the virtual source is determined by the manner in which the stimuli are administered. In a free-field situation, the virtual source is located
somewhere outside the listener. If the stimuli are administered through earphones, the listener judges the source to be located inside his head. Our studies concern the latter phenomenon. It is likely that these two phenomena employ the same mechanism of binaural fusion.
David, Guttman, and van Bergeijk (2), and Deatherage and Hirsch (3), have shown in a series of psychoacoustic experiments that, for impulsive stimuli, time and intensity can be "traded" in fusion. If trains of electric pulses of 100- Isec duration (clicks) are fed to the subject through earphones, the apparent source of the clicks can be moved to the left side of the head, either by making the click on the left more intense than the click on the right or by making the click on the left precede the click on the right. If the click on the left is more intense than the click on the right, the apparent source can be moved back to the center of the head by making the click on the right arrive sooner
than the click on the left. These psychophysical results have been discussed in terms of latencies of the characteristic peaks in the electrophysiological response of the
auditory nerve to click stimuli.
Goldstein and Kiang (4) have conducted a series of neurophysiological experiments to investigate synchrony of responses to transient stimuli. Their recording was from
(XV. COMMUNICATIONS BIOPHYSICS)
gross electrodes placed at the round window and on the auditory cortex of cats. When
the stimulus was a. click, if enough masking noise was added to eradicate the
character-istic neural response to the click at the round window (the N
1, N
Zpeak configuration),
the neural response at the auditory cortex was also eradicated.
When the stimulus was
the sudden onset of wideband Gaussian noise (the beginning of a noise burst), more
masking noise was required to eradicate the neural response at the auditory cortex than
to eradicate the N
1, N
2peaks at the round window.
Their explanation of this was that
masking noise desynchronized the response to the noise burst, but not to the click, and
that desynchronization destroyed the response at the round window, but not at the
audi-tory cortex.
Their experimental results can be explained in terms of a simple mathematical
model (5).
According to this model, the response recorded by gross electrodes
is the summated response of a large population of mathematically postulated
"neural units."
The units contributing to the round-window response produce a
sharp spike-like waveform, but those contributing to the response at the auditory
cortex produce a broader waveform.
If the times of firing of the units at both
round window and cortex are desynchronized by an amount that is small
com-pared with the duration of the response at the cortex but large comcom-pared with
the duration of the response at the round window, the summated response at the
round window will be reduced much more than the summated response at the
auditory cortex.
The addition of masking noise to a noise burst produces this
desynchronization.
The addition of masking noise sufficient to mask the round
window response to a click does not (according to the model) produce
desyn-chronization, but rather, by a "line-busy" effect, prevents units from responding
to the click.
Although Goldstein and Kiang presented stimuli monaurally, their experiments
indicate that there is a way of controlling two parameters of the neural response
to impulsive stimuli:
The times of firing of responding neural units can be
desynchronized by adding masking noise to a noise burst, or the number of
units responding to the stimulus can be reduced without desynchronizing the
response by adding masking noise to a click.
This suggested that a series
of psychoacoustic experiments similar to those performed by David, Guttman, and
van Bergeijk could be conducted, in order to determine the importance of synchrony of
neural discharges in binaural fusion by using as stimuli clicks and noise bursts in the
presence of masking noise.
The apparent trading relationship between time difference
and intensity difference provides a measure of the strength of a signal for fusion because
time difference can be measured directly.
Three experiments were conducted with three subjects who had not had
previous experience in psychoacoustic experiments.
(XV. COMMUNICATIONS BIOPHYSICS)
2. Experiment 1. Effect of Masking Noise on Fusion of a Click with a Noise Burst a. Procedure
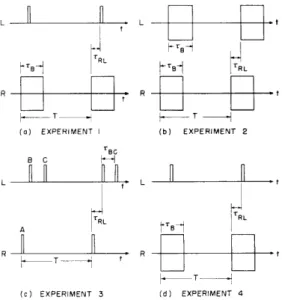
The stimulus consisted of a train of clicks in the left ear, a train of noise bursts in the right ear, and steady masking noise in either or both ears. See Fig. XV-9a. The burst lengths and repetition rates investigated were 50-msec, 20-msec, and 10-msec noise bursts at 5 pps, and 10 msec noise bursts at a rate of 20 pps. Thresholds were determined monaurally by the method of limits. We determined thresholds at 5 pps, using a 50-msec noise burst. The intensity at which a noise burst or a click is just audible depends on the noise-burst length and on the repetition rate, but we did not compensate for this when we changed the stimuli. We kept the intensity of the stimuli unchanged for all conditions, to provide a stable reference level.
The subject sat in a soundproof room, wearing a matched pair of PDR-8 earphones. On the arm of his chair was an unmarked control with which he could control the rela-tive time of arrival of the click and noise burst. He was instructed to adjust the control until the apparent source was in the center of his head, and notify the experimenter by
means of a buzzer. If he could not get a centered image, he was to notify the experi-menter.
b. Results
With masking noise only in the ear receiving noise bursts, the level of masking noise
L L t
B RL B RL
---
T L- -T(a) EXPERIMENT I (b) EXPERIMENT 2
TBC 8 C L t., TRL TRL A (c) EXPERIMENT 3 (d) EXPERIMENT 4
Fig. XV-9. Schematic representation of stimuli used in experiments. Repetition rate, 1/T; noise-burst duration, TBC; interaural time delay (right ear leading),
T RL
(XV. COMMUNICATIONS BIOPHYSICS)
that was necessary to prevent fusion (in 50 per cent of the presentations) was, on the average, 7 db less than the level of masking noise that was necessary to make the noise burst inaudible (in 50 per cent of the presentations). With masking noise only in the ear receiving clicks, the level of masking noise necessary to prevent fusion was, on the average, l db less than the level necessary to make the clicks inaudible. With masking noise in both ears, the level of masking noise necessary to prevent fusion was 1 or 2 db greater than with masking noise only in the ear receiving bursts of noise.
In every case, with masking noise at 0-db sensation level in both ears the subject put the noise burst from 2 to 4 msec ahead of the click for a centered image. As masking noise was added to the noise burst this gap increased. When masking noise was added to the click it was necessary to present the click earlier relative to the noise burst to obtain centering.
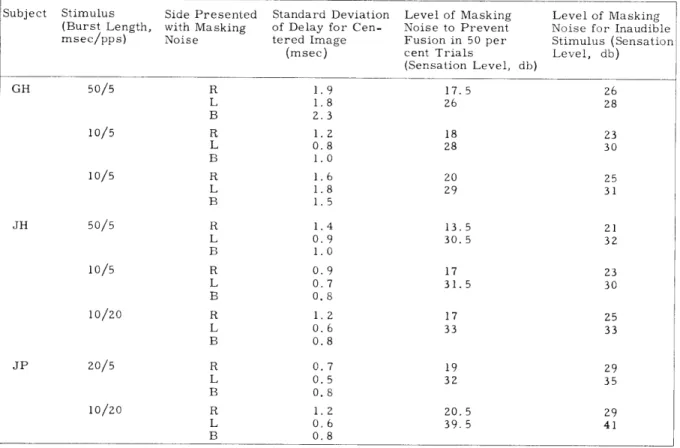
Table XV-1 lists the standard deviation of delay between click and noise burst for a centered image. Each point represents the average of 15 trials (12 for subject JP).
Table XV-1. Experiment 1. Train of clicks
bursts in right ear. in left ear, train of noise Stimulus (Burst Length, msec/pps) 50/5 10/5 10/5 50/5 10/5 10/20 20/5 10/20 Side Presented with Masking Noise R L B R L B R L B R L B R L B R L B R L B R L B Standard Deviation of Delay for Cen-tered Image (msec) 1.9 1.8 2.3 1.2 0.8 1.0 1.6 1.8 1.5 1.4 0.9 1.0 0.9 0.7 0.8 1.2 0.6 0.8 0.7 0.5 0. 8 1.2 0.6 0.8
Level of Masking Level of Masking Noise to Prevent Noise for Inaudible Fusion in 50 per Stimulus (Sensation cent Trials Level, db)
(Sensation Level, db) 17.5 26 26 28 13.5 30.5 17 31.5 20.5 39.5
This standard deviation is the average over
all levels of masking noise considered.
In
184
Subject
GH I
(XV. COMMUNICATIONS BIOPHYSICS)
general, it increased as masking noise approached the level that would prevent fusion. Table XV-1 also lists the level of masking noise for which the subject could get a fused image in 50 per cent of the trials, and the level of masking noise necessary to make the
stimulus inaudible monaurally.
3. Experiment 2. Effect of Masking Noise on Fusion of a Noise Burst with a Noise Burst
a. Procedure
The stimulus consisted of 20-msec noise bursts at 20-db sensation level in both ears, and masking noise in either or both ears. See Fig. XV-9b. The noise bursts were pre-sented at a rate of 20 pps. All noise sources were uncorrelated. The experimental pro-cedure and instructions to the subject were otherwise the same as in Experiment 1.
b. Results
Averaging over all trials for all subjects, with masking noise in one ear, the level of masking noise necessary to make fusion impossible was 2 db below the level of masking that would make either noise burst inaudible monaurally. With masking noise in both ears, the level of masking noise necessary to prevent fusion increased in some trials and decreased in others. We do not consider the change to be significant.
4. Experiment 3. Effect of Masking Noise on Fusion of a Click to One Ear with Two Closely Spaced Clicks to the Opposite Ear
a. Procedure
The stimulus consisted of a repetitive train of single clicks (click A) in the right ear, and a train of two closely spaced clicks (clicks B and C) plus masking noise in the left ear. See Fig. XV-9c. In each trial, the subject attempted to get centered images by varying TRL, the relative timing, of click A. If the B-C separation, TBC, was suffi-ciently large, there were two relative positions of click A that resulted in centering. If the separation was too small, only one relative position of click A resulted in centering. The experimenter varied TBC in 0. 5-msec steps from an interval for which the subject was consistently able to get centering with two positions of click A to an interval for
which the subject was able to get centering with two positions of click A in less than 25 per cent of the trails.
The clicks were held at a level of 20-db sensation level throughout the experiment. The experiment was performed for subject JP at a repetition rate of 8 pps, with masking noise at sensation levels of -40 db, 15 db, and 20 db, and for subject JH at 20 pps and 8 pps, with masking noise at -40 db sensation level and 20 db sensation level.
(XV. COMMUNICATIONS BIOPHYSICS)
b. Results
In every case, the addition of masking noise to the pair of clicks resulted in a reduc-tion of the average value of TBC for which the subject was able to get two centering positions of click A in 50 per cent of the trials. This interval for the various conditions is listed in Table XV-2.
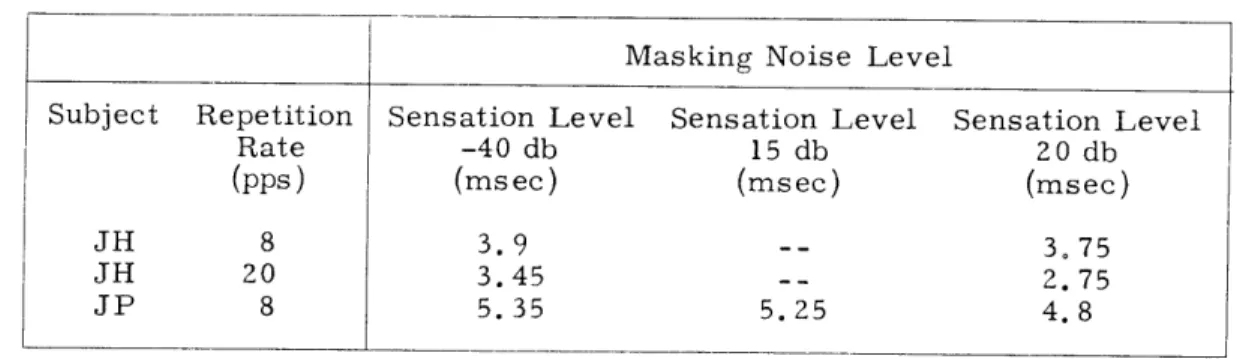
Table XV-2. Experiment 3. Train of single clicks in right ear, train of pairs of clicks in left ear. Interval in which subject can get two centering positions of single click in 50 per cent of trials.
Masking Noise Level
Subject Repetition Sensation Level Sensation Level Sensation Level
Rate -40 db 15 db 20 db
(pps)
(msec)
(msec)
(msec)
JH 8 3.9 -- 3. 75
JH 20 3.45 -- 2.75
JP 8 5.35 5.25 4.8
5. Interpretation of Results
We interpret the results of these experiments as supporting evidence for the following model: The acoustic stimulus arriving at the ear evokes a timing signal. The strength of this timing signal is determined by the short-term integrated neural response. The timing signals from the two sides travel to a centrally located fusion mechanism, which compares the timing signals from the two sides and under the proper conditions produces the subjective impression of a fused virtual image. Over a limited range, a decrease in strength of one timing signal can be compensated for by making that timing signal arrive earlier. If the discrepancy in the strength of the timing signals from the two ears is too great, fusion is impossible. Fusion also is impossible if the timing signals become too weak.
With the noise burst masked, there is approximately a 7-db range of masking noise level for which the noise burst is audible but fusion is impossible. If we accept Goldstein and Kiang's proposition that noise masking a noise burst desynchronizes the neural response, we may conclude that mechanisms determining audibility of the stimulus integrate neural activity over a longer period than mechanisms of fusion. Just as desynchronization of the neural response did not eliminate the cortical response in cats but did eliminate the cochlear response, desynchronization of the neural response did not make the stimulus inaudible, but did make fusion impossible.
With both the click and the noise burst at 20-db sensation level, and with masking
(XV. COMMUNICATIONS BIOPHYSICS)
noise at 0-db sensation level in both ears, the subject placed the noise burst from 2 to 4 msec ahead of the click for a centered image. According to David's time-intensity trading relationship, this means that the timing signal from the click was stronger than the timing signal from the noise burst. Here again, this is what we would expect if audibility of the stimulus is determined by a relatively long integration of neural activ-ity, and strength of the timing signal is determined by a relatively short integration.
Since the noise burst lasted longer than the click, it did not have to be as intense as the click in order to be just audible. The timing signal was not strengthened by the increased duration of the noise burst, because its strength is determined only by the short-term response. Since the click was more intense than the noise burst, the click evoked a
stronger timing signal.
Masking the noise burst weakened the timing signal from the noise burst, so that the interval between noise burst and click for a centered image increased. Masking the click weakened the timing signal from the click, so that the interval for a centered image
decreased.
With a masked noise burst in one ear, the range of masking noise levels for which the noise burst was still audible, but fusion was impossible, was only approximately 2 db when the stimulus in the opposite ear was another noise burst, as compared with approx-imately 7 db when the stimulus in the opposite ear was a click. These results indicate that the difference in strength between the timing pulses from the two sides is a factor in determining whether or not fusion is possible. Putting the weak timing signal from another noise burst in place of the strong timing signal from the click decreased the difference in strength between the timing signals from the two sides, so that fusion was possible with higher levels of masking noise than before.
When noise bursts were presented to both ears, addition of masking noise to both sides prevented fusion at nearly the same level as masking noise added to only one side. Apparently, for fusion to be possible, the timing signals from the two sides must both be stronger than some absolute minimum, and not differ too widely in intensity.
The reduction of the minimum perceptible interval between two clicks by the addition of masking noise was exactly the result we predicted on the basis of the model of neural activity proposed by Goldstein and Kiang. We interpret it as follows: Neural units are refractory for some time after they fire. That is, they exhibit a raised threshold. In the absence of masking noise, many units are fired by click B and are refractory for some time thereafter, and hence if click C follows too closely after click B, the response to click B is much stronger than the response to click C, and drowns it out. When mask-ing noise is added to the pair of clicks, however, it continually renders neural units refractory. Some units that are refractory at the onset of click B recover enough to fire by the onset of click C. The effect of masking noise is to even out the responses to
the two clicks, and, in this way, to reduce the minimum perceptible interval.
(XV. COMMUNICATIONS BIOPHYSICS)