HAL Id: hal-01868923
https://hal.sorbonne-universite.fr/hal-01868923
Submitted on 6 Sep 2018
HAL is a multi-disciplinary open access
archive for the deposit and dissemination of
sci-entific research documents, whether they are
pub-lished or not. The documents may come from
teaching and research institutions in France or
abroad, or from public or private research centers.
L’archive ouverte pluridisciplinaire HAL, est
destinée au dépôt et à la diffusion de documents
scientifiques de niveau recherche, publiés ou non,
émanant des établissements d’enseignement et de
recherche français ou étrangers, des laboratoires
publics ou privés.
Distributed under a Creative Commons Attribution| 4.0 International License
GABAergic interneurons
Elodie Fino, Marie Vandecasteele, Sylvie Pérez, Frédéric Saudou, Laurent
Venance
To cite this version:
Elodie Fino, Marie Vandecasteele, Sylvie Pérez, Frédéric Saudou, Laurent Venance. Region-specific
and state-dependent action of striatal GABAergic interneurons. Nature Communications, Nature
Publishing Group, 2018, 9, pp.3339. �10.1038/s41467-018-05847-5�. �hal-01868923�
Region-speci
fic and state-dependent action of
striatal GABAergic interneurons
Elodie Fino
1,2,3,4
, Marie Vandecasteele
1,2
, Sylvie Perez
1,2
, Frédéric Saudou
3,4,5
& Laurent Venance
1,2
Striatum processes a wide range of functions including goal-directed behavior and habit
formation, respectively encoded by the dorsomedial striatum (DMS) and dorsolateral
stria-tum (DLS). GABAergic feedforward inhibition is known to control the integration of cortical
information by striatal projection neurons (SPNs). Here we questioned whether this control is
specific between distinct striatal functional territories. Using activation and
opto-inhibition of identi
fied GABAergic interneurons, we found that different circuits are engaged
in DLS and DMS, both ex vivo and in vivo: while parvalbumin interneurons ef
ficiently control
SPNs in DLS, somatostatin interneurons control SPNs in DMS. Moreover, both parvalbumin
and somatostatin interneurons use a dual hyperpolarizing/depolarizing effect to control
cortical input integration depending on SPN activity state: GABAergic interneurons potently
inhibit spiking SPNs while in resting SPNs, they favor cortical activity summation via a
depolarizing effect. Our
findings establish that striatal GABAergic interneurons exert efficient
territory-speci
fic and state-dependent control of SPN activity and functional output.
DOI: 10.1038/s41467-018-05847-5
OPEN
1Center for Interdisciplinary Research in Biology (CIRB), College de France, CNRS UMR7241, INSERM U1050, Paris 75005, France.2Université Pierre et Marie Curie, ED 158, Paris Sciences et Lettres, Paris 75005, France.3INSERM U1216, Grenoble 38000, France.4Grenoble Institute of Neuroscience, Université Grenoble Alpes, Grenoble 38000, France.5CHU Grenoble Alpes, Grenoble 38000, France. Correspondence and requests for materials should be addressed to E.F. (email:elodie.fino@univ-grenoble-alpes.fr)
123456789
C
erebral cortex and basal ganglia are tightly interconnected
structures involved in goal-directed behavior and
proce-dural learning
1–3. Striatum, the main input nucleus of
basal ganglia, receives massive convergent glutamatergic inputs
from the whole cortex and distinct inputs from the different
cortical areas form distinct functional territories within the
striatum
4–7. Two major functional territories are the dorsomedial
striatum (DMS), responsible for cognitive function and
goal-directed behavior, and the dorsolateral striatum (DLS), which
corresponds to the sensorimotor territory and is involved in habit
formation
3,8. The two territories also interact with each other
since in the same behavioral task involving procedural learning,
DMS and DLS neurons are both activated, but preferentially at
different phases of the task and at different stages of the
learning course
9,10. Both territories then relay the information
toward the output structures of basal ganglia (internal part
of the globus pallidus and the substantia nigra pars reticulata
(SNr)).
DMS and DLS are functionally distinct, although the
compo-sition and the properties of their microcircuits appear similar.
Since striatum has no evident anatomical boundaries, functional
differences of the distinct striatal regions could arise from their
distinct incoming cortical inputs. The composition of the striatal
circuits could also define specific functional regions. Striatal
neuronal circuits are composed of a majority of striatal projection
neurons (SPNs), and a variety of GABAergic interneurons, which
are also efficiently recruited by cortical afferents
11–14and exert a
strong feedforward inhibition on SPNs
15–17. The role of striatal
interneurons is highlighted by the consequences of global
alteration
in
GABAergic
circuits,
which
alters
synaptic
plasticity
18,19and leads to severe motor deficits that are
parti-cularly exemplified in the context of dystonia or Tourette
Syn-drome
20. The two most extensively described interneuron
subtypes in striatum are the parvalbumin (PV)-expressing cells
(fast-spiking interneurons) and the somatostatin/neuropeptide Y/
nitric oxide synthase (SOM/NPY/NOS)-expressing cells
(persis-tent and low-threshold spiking cells).
Here we questioned whether PV and SOM interneurons could
play a role in the distinct properties of DMS and DLS. Using
in vivo multi-channel recordings associated with optogenetics, we
found that opto-inhibition of PV or SOM cells in DMS or DLS
differentially control SNr activity. We explored this functional
dichotomy within the striatum and found that PV cells control
the activity of SPNs in DLS while SOM cells control SPNs in
DMS. This dichotomy is based on a marked heterogeneity in the
anatomical distribution, connectivity and electrophysiological
properties of PV and SOM cells in DLS and DMS. Interestingly,
our results show that the territory specificity of GABAergic
microcircuits translates to the trans-striatal transfer of
informa-tion of cortical inputs to the nigral output of the striatum. We
also described that both PV and SOM interneurons mediate a
dual hyperpolarizing/depolarizing control of SPNs that depends
on SPN activity state, with the depolarizing effect favoring cortical
integration. Our
findings therefore demonstrate that the selective
feedforward control of cortical inputs by GABAergic
inter-neurons is specific to the striatal functional territories and to the
SPN activity state.
Results
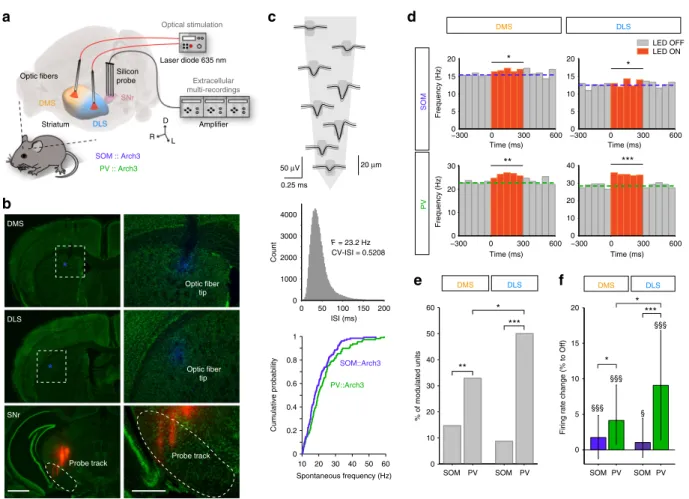
SOM and PV cells in DMS and DLS differentially affect SNr
spontaneous activity. SPNs act as coincidence detectors of
coherent cortical activity, extract pertinent information from
background noise and relay signals towards the main basal
ganglia output structure, the SNr. We used SNr spontaneous
activity as a readout of striatal output modulation by striatal
interneurons. We
first examined the effect of an opto-inhibition
of SOM and PV interneurons in DMS or DLS onto SNr
spon-taneous activity (Fig.
1
a). To do so, we recorded extracellular
activity of SNr units in vivo in urethane-anesthetized SOM::Arch3
and PV::Arch3 mice that selectively express Arch3 in SOM and
PV cells, respectively (Fig.
1
a, b and Supplementary Fig. 1). SNr
units were identified by their high spontaneous spiking frequency
(median (interquartile range (IQR)): 18.7 (10.3) Hz, n
= 239
units) and their regularity (coefficient of variation of the
inter-spike intervals (CV-ISI), median (IQR): 0.41 (0.22)) (Fig.
1
c). In
control conditions (i.e., without opto-inhibition), no difference
was found between the distribution of the spontaneous
firing
rates of SNr units recorded in SOM::Arch3 vs. PV::Arch3 mice (n
= 130 units from 17 SOM::Arch3 mice, n = 109 units from 13
PV::Arch3 mice, p
= 0.2044, Fig.
1
c). Using optic
fibers implanted
in the DMS or DLS, we tested the effect of opto-inhibition of
SOM and PV cells in the two striatal territories (Fig.
1
a, b). We
found that all conditions (SOM and PV in DMS and DLS) could
efficiently increase SNr activity (Fig.
1
d–f and Supplementary
Fig. 2). However, we found a selective contribution of SOM and
PV opto-inhibition to SNr activity depending on the targeted
striatal territory (Fig.
1
d, e). First, the proportion of modulated
SNr units was significantly higher when opto-inhibiting PV
interneurons than SOM interneurons in both DLS and DMS
(50.0% of significantly modulated units in PV-DLS, n = 68 vs.
8.7% in SOM-DLS, n
= 69, p = 0.0001; 32.9%, n = 79 in PV-DMS
vs. 14.7%, n
= 109 in SOM-DMS, p = 0.0079), suggesting a
stronger weight of PV interneurons compared to SOM
inter-neurons. Second, we found a stronger impact of PV
opto-inhibition in DLS than in DMS (p
= 0.0422) (Fig.
1
d–f),
sug-gesting a territory specificity in the modulation of SNr activity.
These effects were confirmed at the population level (Fig.
1
f and
Supplementary Fig. 2), where silencing PV or SOM striatal
interneurons induced an overall increase in SNr activity in all
conditions (SOM-DMS: median (IQR) change
+1.7 (6.1)%, p =
0.0001; PV-DMS:
+4.1 (8.3)%, p < 0.0001: SOM-DLS: +1.0
(5.5)%, p
= 0.0196; PV-DLS: +9.1 (15.4)%, p < 0.0001). The
comparison of effects of opto-inhibition between striatal
inter-neurons and territories on the SNr
firing rate confirmed the
stronger effect of silencing PV compared to SOM interneurons in
both territories (DMS: p
= 0.0208; DLS: p < 0.0001), and the
stronger effect of PV interneurons in the DLS compared to the
DMS (p
= 0.0087) (Fig.
1
f). These differential effects did not
result from an anatomical bias in the DMS or DLS connectivity of
the targeted SNr region since we did not observe a segregation of
significantly modulated units or an effect depending on the
recording location (Supplementary Fig. 2).
Together, these in vivo data suggest that SOM and PV
interneurons of the dorsal striatum exert differential effects on the
spontaneous activity of the SNr. In addition, these effects depend
on their location in striatal territories (DMS vs. DLS).
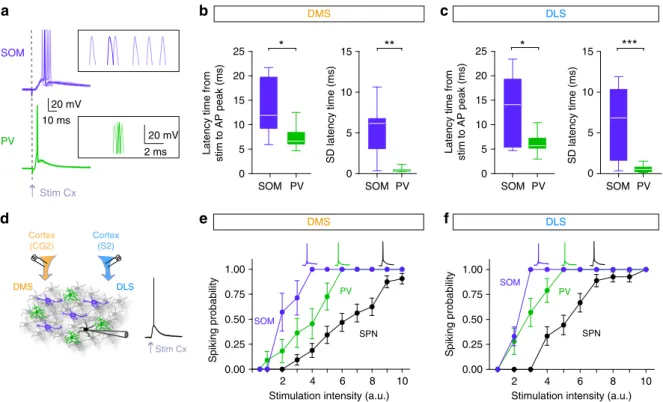
Selective inhibitory weight on spiking SPNs in DMS and DLS.
To investigate the cause of this differential effect, we dissected the
effects of SOM and PV interneuron opto-inhibition onto the
SPNs in DMS and DLS. To this aim, we characterized the effect of
striatal GABAergic circuits locally in the striatum by performing
ex vivo experiments using brain slices preserving layer 5 cortical
connections from cingulate cortex to DMS or from
somatosen-sory cortex to DLS (see Methods). We
first confirmed that cortical
layer 5 pyramidal cells directly contact both types of striatal
interneurons as previously described
11–14,21(Fig.
2
). We found
that PV cells are tightly locked to the timing of cortical
stimu-lations and display reproducible evoked responses, while SOM
cells show more variability in their responses to cortical inputs in
both territories (Fig.
2
a–c). We built input/output curves for SOM
and PV interneurons and for SPN evoked responses by gradually
increasing the stimulation of cortical afferents (Fig.
2
d–f). In the
two territories, 100% of PV and SOM interneurons were
effi-ciently activated by cortical inputs and, in both DMS and DLS,
SOM and PV cells are recruited before SPNs since they
dis-charged for lower cortical activation than SPNs (F
2, 20= 20.19, p
< 0.0001 for DMS and F
2, 18= 11.17, p = 0.0025 for DLS)
(Fig.
2
d–f). These properties place both SOM and PV cells in a
strategic position to mediate efficient feedforward inhibition in
both DMS and DLS.
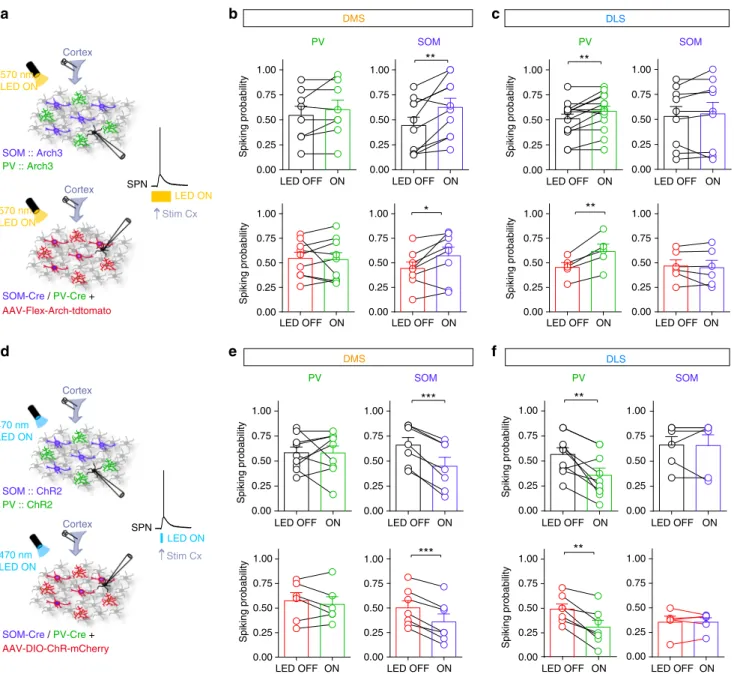
Based on our in vivo observations, we next investigated
whether PV and SOM cells would mediate selective feedforward
inhibition in DMS and DLS. We therefore quantified the weight
of the feedforward inhibition mediated by SOM and PV cells on
the integration of cortical inputs by SPNs in DMS and DLS. To
do so, we opto-inhibited SOM or PV cells during cortical activity
using either transgenic SOM::Arch3 and PV::Arch3 (in which
most PV or SOM interneurons in the brain express Arch3; Fig.
3
a
and Supplementary Figs. 1 and 3) or virally with
AAV-Flex-Arch-tdtomato injected in DLS or DMS in SOM-Cre or PV-Cre mice.
The viral approach allowed us to restrict the expression of Arch3
to only striatal interneurons either in DMS or DLS (Fig. 3a
and Supplementary Fig. 4) to exclude any eventual external
sources of PV or SOM inputs (from cortex or globus pallidus for
example) and to study only the effect of local microcircuits. We
analyzed SPN spiking activity evoked by a single cortical
stimulation during opto-inhibition of interneurons and compared
the effect of SOM and PV cells in DMS and DLS. We found that
SOM cell opto-inhibition significantly increased the spiking
a
b
SNr tip Probe track DMS SOM :: Arch3 PV :: Arch3 Probe trackd
*
*
tip 0.25 ms 50 μV Amplifier Optic fiber Time (ms) Frequency (Hz) Frequency (Hz) Time (ms) DLS 0 50 100 150 200 0 1000 2000 3000 4000 ISI (ms) F = 23.2 Hz CV-ISI = 0.5208 Count *** Spontaneous frequency (Hz) Cumulative probability SOM::Arch3 PV::Arch3 20 μm DLS PV SOM −300 0 300 600 0 10 20 30 40 −300 0 300 600 0 5 10 15 20 * LED OFF LED ON −300 0 300 600 0 5 10 15 20 * −3000 0 300 600 10 20 30 **e
DMS DLS *** % of modulated units ** SOM PV SOM PV 0 10 20 30 40 50 60Firing rate change (% to Off)
f
DMS DLS *** §§§ §§§ §§§ § * SOM PV SOM PV 0 5 10 15 20 * * 10 20 30 40 50 60 0 0.2 0.4 0.6 0.8 1 Time (ms) Time (ms) DMSc
Striatum Silicon probe SNr Laser diode 635 nm Optical stimulation Extracellular multi-recordings DMS DLS R L D Optic fibers Optic fiberFig. 1 Differential modulation of basal ganglia output activity by SOM and PV cells of DMS and DLS. a Experimental set up: in vivo multi-channel extracellular recordings of SNr unit activity using 4-shank 32-site silicon probe while PV or SOM interneurons are opto-inhibited using two opticfibers implanted in the DMS and DLS.b Post-hoc histological confirmation of the location of the recording probe (shanks painted with DiI before the implantation, red) in the SNr (delineated) and the two opticfibers (tips painted with DAPI, blue) in DMS and DLS, observed in Nissl-stained (green) coronal slices. Scale bars: 1 mm (left), 500µm (right). c Top: Mean ± SD (black and gray lines) waveform of a clustered SNr unit represented atop the corresponding recording sites of the probe (sketch of 1 shank, the 8 recording sites in dark gray). Middle: Distribution of the interspike interval (ISI) of the same unit, displaying the high frequency and low CV-ISI typical of SNr units. Bottom: the distribution of SNr spontaneousfiring rates is similar in SOM::Arch3 mice (n = 130 units from 17 mice) andPV::Arch3 mice (n = 109 units from 13 mice) (Kolmogorov–Smirnov test, p = 0.2044). d Spontaneous firing activity of representative SNr units significantly activated by opto-inhibition (300 ms, 10 mW, 50 trials) of SOM (top) or PV (bottom) light in DMS (left) or DLS (right). The colored dashed lines represent the median of the 300 ms-OFF period before the stimulation.e Proportion of SNr units displaying a significant modulation of their firing in response to opto-inhibition of PV or SOM interneurons in DMS or DLS (total n = 109 units for SOM::Arch3 in DMS, n = 69 in DLS, n = 79 units for PV::Arch3 mice in DMS, n = 68 in DLS). f Median (IQR) change in firing rate of all recorded SNr units in response to opto-inhibition of PV (green) and SOM (purple) interneurons in the DMS and DLS.§§§Indicates a significant effect across the population of recorded SNr units for PV-DLS ($p < 0.05,$$$p < 0.001, Wilcoxon signed rank test corrected for multiple comparisons). Ine and f, results in the 4 conditions were compared using a generalized linear (e) or a linear (f) model (see Methods) followed by post-hoc tests, *p < 0.05, **p < 0.01, ***p < 0.001. For the 3D images in a, brain and brain structures are captured from the Allen Institute for Brain Science’s Mouse Brain Atlas74(© 2004 Allen Institute for Brain Science, Allen Mouse Brain Atlas available
probability of SPN-DMS (p
= 0.005, n = 10), whereas the spiking
probability of SPN-DLS remained unaffected (p
= 0.1571, n = 9).
The picture was reversed for PV cells since their opto-inhibition
led to an increase in spiking probability of SPNs in DLS (p
=
0.0087, n
= 14) but not in DMS (p = 0.4040, n = 8) (Fig.
3
b, c).
These results were confirmed with the opposite strategy, by
activating SOM and PV interneurons while stimulating cortical
afferents using SOM::ChR2 or PV::ChR2 mice (Fig.
3
d and
Supplementary Figs 5 and 6) or virally expressed with
AAV-DIO-ChR2-mCherry injected in SOM-Cre or PV-Cre mice (Fig. 3d
and Supplementary Figs 4, 5 and 6). We found that SOM
opto-activation decreased spiking probability in DMS (p
= 0.0002, n =
7) but not in DLS (p
= 0.9114, n = 6), while PV cell
opto-activation decreased the spiking probability of SPNs in DLS (p
=
0.0059, n
= 9) but not in DMS (p = 0.9816, n = 9) (Fig.
3
e, f).
These results show that PV and SOM interneurons efficiently
modulate cortically evoked SPN
firing in selective territories, with
a stronger impact of SOM cells in DMS and of PV cells in DLS.
Interestingly, we obtained similar results with transgenic mice or
virally expressed opsins, which shows that only local PV and
SOM striatal interneurons have a role in the effects we observed.
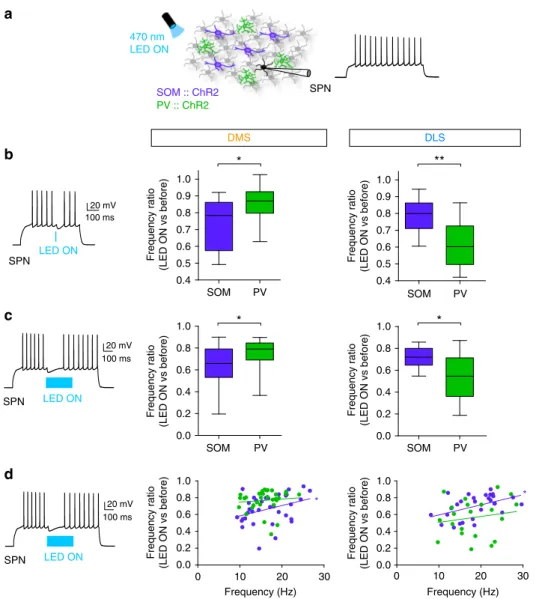
To further explore this differential effect, we investigated the
local inhibitory control of the two GABAergic interneuron
subtypes on SPN
firing in DMS and DLS (Fig.
4
a). Using SOM::
ChR2 or PV::ChR2 mice (or virally expressed with
AAV-DIO-ChR2-mCherry in SOM-Cre and PV-Cre mice, Supplementary
Fig. 4), we compared the inhibitory weight of SOM and PV cells
on SPN
firing (induced by suprathreshold depolarizing current
steps) in DMS and DLS (Fig.
4
b, c; Supplementary Fig. 6).
We mimicked brief (a single spike induced by 5 ms light pulse,
Fig.
4
b) or long (bursts of spikes induced by 300 ms light pulse,
Fig.
4
b, c) activation of GABAergic circuits. We found that SPN
firing frequency was significantly decreased by brief
opto-stimulation of both SOM and PV cells in DMS and DLS (F
3, 54= 9.151, p < 0.0001) but with different magnitudes depending on
the striatal territories. In DMS, SOM cell activation exerted
stronger inhibition than PV cell activation (SOM
opto-stimula-tion, normalized frequency before vs. during opto-stimulation
was 0.75 ± 0.04, n
= 16, PV opto-stimulation, normalized
fre-quency was 0.85 ± 0.03, n
= 16, p = 0.0258). In DLS, PV cells
induced a stronger decrease in frequency in SPNs than SOM cells
(PV: 0.61 ± 0.04, n
= 12, SOM: 0.78 ± 0.03, n = 14, p = 0.0014)
(Fig.
4
b). Using the viral infection strategy, we observed similar
results, indicating that only local GABAergic circuits are
responsible for the inhibitory weight specificity (Supplementary
Fig. 7). These
findings were confirmed using longer duration
(300 ms) opto-stimulation of both PV and SOM cells in DMS and
DLS (F
3, 54= 9.108, p < 0.0001). SOM-DMS cells exerted a
stronger inhibition onto SPN
firing frequency than PV-DMS
cells (frequency ratio before vs. during opto-stimulation,
Stimulation intensity (a.u.)
Spiking probability 2 4 6 8 10 0.00 0.25 0.50 0.75 1.00
Stimulation intensity (a.u.)
Spiking probability 2 4 6 8 10 0.00 0.25 0.50 0.75 1.00 SPN PV SOM SPN PV SOM DMS DLS
d
e
f
SD latency time (ms) PV SOM 10 ms 20 mV PV SOM 0 5 10 15 20 25 0 5 10 15 0 5 10 15 20 25 0 5 10 15Latency time from
stim to AP peak (ms) Latency time from stim to AP peak (ms) SD latency time (ms)
**
*
*
PV SOM PV SOM PV SOM 20 mV 2 ms Stim Cx Stim Cxa
b
DMSc
DLS Cortex (CG2) Cortex (S2) DMS DLS***
Fig. 2 SOM and PV cells are differentially recruited by cortical inputs in DMS and DLS. a Six superimposed APs evoked in either SOM or PV cells for a given cortical stimulation intensity.b, c Whisker boxes representing the latency, and the standard deviation (SD) of the latency, between the stimulation artifact and the peak of the AP in PV cells (green) and SOM cells (purple), in DMS and DLS. In both territories, PV interneurons display much shorter latency and SD than SOM cells, (DMS,p = 0.0148 for latency and p = 0.0019 for SD; DLS, p = 0.0334 for latency and p = 0.0004 for SD). PV cells display a short latency (6.38 ± 0.38 ms,n = 30) and a remarkable small SD of the latency (0.53 ± 0.07 ms, n = 30), and this with no significant difference between DMS and DLS (p = 0.1127 for latency and p = 0.4641 for SD latency), accounting for a very time-locked PV cells recruitment. In contrast, APs evoked in SOM cells by cortical stimulation exhibited longer latency (13.31 ± 1.77 ms,n = 17) and a higher latency SD (5.75 ± 0.93 ms, n = 17), with no difference in DMS and DLS (p = 0.8884 for latency and p = 0.7430 for SD latency, Mann–Whitney unpaired t-test). d Schematic representation of the experimental set up: electrical stimulations were applied in the cortex (CG2 for DMS slices and S2 for DLS slices) and evoked APs were recorded in SPNs, PV and SOM cells. e, f Input/output relationship (mean ± SEM) is plotted for different neuronal subtypes, SPN (black), PV cells (green) and SOM cells (purple) in DMS (e) and DLS (f). Insets represent APs evoked in the different cell types after cortical stimulation. In both DLS and DMS, PV and SOM cells discharge for much lower cortical activation than SPNs (F2, 20= 20.19, p < 0.0001 for DMS, SPN n = 33, PV n = 11, SOM n = 8 and F2, 18= 11.17, p = 0.0025 for DLS, SPN
SOM,
0.65 ± 0.03,
n
= 14 and PV, 0.75 ± 0.02, n = 16;
p
= 0.0129). In contrast, SOM-DLS cells had a weaker weight
than PV-DLS cells (PV, 0.54 ± 0.05, n
= 12, SOM, 0.66 ± 0.02, n
= 14; p = 0.0011) (Fig.
4
c).
These data demonstrate that SOM cells have a stronger
inhibitory weight in DMS while PV cells control more efficiently
SPN
firing rate in DLS. Remarkably, in both DMS and DLS, the
inhibitory effect of PV cells was independent on the initial SPN
DMS DLS
a
b
LED OFF ON
Spiking probability Spiking probability
PV SOM PV SOM
c
0.00 0.25 0.50 0.75 1.00 0.00 0.25 0.50 0.75 1.00 0.00 0.25 0.50 0.75 1.00 0.00 0.25 0.50 0.75 1.00LED OFF ON LED OFF ON LED OFF ON
Spiking probability
LED OFF ON LED OFF ON LED OFF ON LED OFF ON
570 nm LED ON SOM :: Arch3 PV :: Arch3 SPN
d
SOM :: ChR2 PV :: ChR2 SPN DMS DLS PV SOM PV SOM 470 nm LED ONe
f
0.00 0.25 0.50 0.75 1.00 0.00 0.25 0.50 0.75 1.00 0.00 0.25 0.50 0.75 1.00 0.00 0.25 0.50 0.75 1.00 Spiking probability LED ON LED ON 0.00 0.25 0.50 0.75 1.00 Spiking probability 0.00 0.25 0.50 0.75 1.00 0.00 0.25 0.50 0.75 1.00 Spiking probability 0.00 0.25 0.50 0.75 1.00 *** ** * AAV-Flex-Arch-tdtomato 0.00 0.25 0.50 0.75 1.00 Spiking probability 0.00 0.25 0.50 0.75 1.00 0.00 0.25 0.50 0.75 1.00 Spiking probability 0.00 0.25 0.50 0.75 1.00 AAV-DIO-ChR-mCherryLED OFF ON LED OFF ON LED OFF ON LED OFF ON
Cortex Stim Cx Cortex Stim Cx Cortex Cortex
LED OFF ON LED OFF ON LED OFF ON LED OFF ON
570 nm LED ON 470 nm LED ON SOM-Cre /PV-Cre + SOM-Cre /PV-Cre + ** ** ** *** **
Fig. 3 Selective modulation of cortically-evoked spiking activity by SOM and PV cells. a Experimental set up: electrical stimulations were applied in the cortex and evoked APs were recorded in SPNs, in control or with specific opto-inhibition of PV cells or SOM cells in transgenic mice PV::Arch3 and SOM:: Arch3 (top) or PV-Cre and SOM-Cre mice virally infected with AAV-Flex-Arch-tdtomato (bottom) (Arch3 activation for 300 ms with a 570 nm LED). b, c The spiking probability of SPNs was compared between interleaved control and opto-inhibition conditions in DMS (b) and DLS (c) using transgenic mice (top, black) or virally infected interneurons (bottom). Individual experiments and averaged (mean ± SEM) normalized spiking probability are represented. Opto-inhibition of SOM cells leads to a significant increase in spiking probability in DMS (n = 15, p = 0.0063 for transgenic and n = 8, p = 0.033 for virus experiments) and no difference in DLS (n = 10, p = 0.2567 for transgenic and n = 6, p = 0.55479 for viruses). For PV cells, the effect is opposite, opto-inhibition of PV cells significantly increase the spiking probability in DLS (n = 16, p = 0.0288 for transgenic and n = 5, p = 0.0063 for viruses), while their opto-inhibition has no effect in DMS (n = 7, p = 0.1854 for transgenic and n = 9, p = 0.8007 for viruses). d Experimental set up: electrical stimulations were applied in the cortex and evoked APs were recorded in SPNs, in control or with specific opto-activation of PV cells or SOM cells with ChR2 activation in transgenic micePV::ChR2 and SOM::ChR2 (top) or PV-Cre and SOM-Cre mice virally infected with AAV-Flex-ChR-mCherry (bottom) (for 5 ms using a 470 nm excitation LED).e, f The spiking probability of SPNs was compared between the control and opto-activation conditions in DMS (e) and DLS (f) using transgenic mice (top, black) or virally infected interneurons (bottom, red). Individual experiments and averaged normalized spiking probability are represented. SOM opto-activation leads to a significant decrease in spiking probability in DMS (n = 7, p = 0.0002 for transgenic mice and n = 7, p = 0.0002 for viral experiments) and no difference in DLS (n = 6, p = 0.9114 for transgenic and n = 5, p = 0.9980 for viruses). Opto-activation of PV cells significantly decrease the spiking probability in DLS (n = 9, p = 0.0059 for transgenic and n = 7, p = 0.0023 for viruses) but not in DMS (n = 9, p = 0.9816 for transgenic andn = 6, p = 0.4518 for viruses). Paired tests, *p < 0.05, **p < 0.01, ***p < 0.001
firing rate (p = 0.5973 for DMS and p = 0.4509 for DLS), whereas
the effect of SOM cells was negatively correlated to the SPN initial
firing rate (p = 0.0437 for DMS and p = 0.0127 for DLS) (Fig.
4
d).
These results show that PV cells have a constant inhibitory weight
regardless of the level of SPN spiking activity, whereas
feedforward inhibition exerted by SOM cells decreases with
increasing SPN spiking activity.
GABAergic microcircuits have distinct properties in DMS and
DLS. We next investigated whether the difference in local
inhi-bitory weight of SOM and PV interneurons in DMS and DLS
reflected anatomical and/or functional specificities of these
microcircuits in both territories. Because enrichment of one
population in a specific region could account for a stronger
inhibitory weight on SPNs, we
first examined the anatomical
distribution of SOM and PV interneurons in DMS and DLS
(Fig.
5
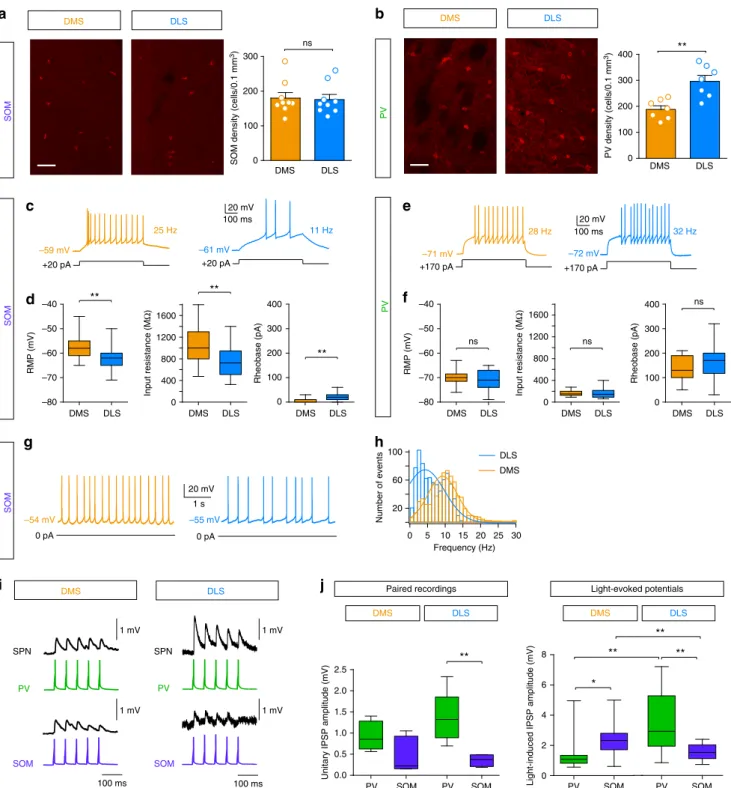
a, b). Immunostaining for somatostatin and parvalbumin
revealed a heterogeneous distribution of interneurons (p < 0.0001,
F
3, 24= 22.79). SOM cells were equally distributed in DMS and
DLS (179.9 ± 16.2 in DMS and 175.7 ± 14.8 in DLS, p
= 0.8510, n
= 9 mice) (Fig.
5
a) and their density was similar to PV cells in
DMS (p
= 0.7253 for DMS and p = 0.5715 for DLS). In contrast,
PV cells were particularly enriched in the DLS when compared to
the DMS (+160%, 296.0 ± 23.2 cells per 0.1 mm
3in DLS vs.
187.9 ± 14.2 in DMS, p
= 0.0018, n = 7 mice) (Fig.
5
b). This
heterogeneous distribution was observed in 1–2-month-old
ani-mals (Fig.
5
a, b) and was maintained in adult animals as well
(Supplementary Fig. 8).
a
LED ON 20 mV 100 ms LED ON 20 mV 100 ms Frequency (Hz) Frequency (Hz) 0 10 20 30 0.0 0.2 0.4 0.6 0.8 1.0 0 10 20 30 0.0 0.2 0.4 0.6 0.8 1.0 Frequency ratio(LED ON vs before) Frequency ratio (LED ON vs before)
b
SPN SPNc
d
SPN 470 nm LED ON DMS DLS * SOM :: ChR2 PV :: ChR2 LED ON 20 mV 100 ms SPN 0.4 0.5 0.6 0.7 0.8 0.9 1.0 0.0 0.2 0.4 0.6 0.8 1.0 0.4 0.5 0.6 0.7 0.8 0.9 1.0 0.0 0.2 0.4 0.6 0.8 1.0 Frequency ratio (LED ON vs before) Frequency ratio (LED ON vs before) PV SOM PV SOM Frequency ratio (LED ON vs before) Frequency ratio (LED ON vs before) PV SOM PV SOM*
*
**
**
Fig. 4 Differential local inhibitory weight of SOM and PV cells onfiring SPNs. a In the DMS and DLS, SPNs are recorded while either PV cells or SOM cells are opto-activated with ChR2 with a 470 nm excitation LED. Effect of PV or SOM cells on SPNs was evaluated in active SPNs, i.e., while inducing spiking activity in SPNs by depolarizing current steps (500 ms inb or 1 s in c and d). b Left: Representative trace of discharge frequency inhibition by a brief (5 ms) opto-activation of PV-DLS cells. Right: Frequency inhibition ratio (frequency during LED ON vs. before LED ON, mean ± SEM) in SPNs induced by 5 ms light pulse. Frequency decrease was significantly higher for SOM cell (purple) activation in DMS territory (p = 0.0258, n = 16 SOM cells and n = 16 PV cells), while this decrease was significantly higher for PV cells (green) activation in DLS territory (p = 0.0014, n = 14 SOM cells and n = 12 PV cells). c Left: Representative trace of discharge frequency inhibition by long opto-activation of PV-DLS cells. Right: Frequency inhibition ratio (frequency during LED ON vs. before LED ON) induced by 300 ms light pulses. The ratio is significantly higher for SOM-DMS than PV-DMS cells (p = 0.0129, n = 14 SOM cells and n = 16 PV cells) and in PV-DLS cells has a stronger weight than SOM-DLS cells (p = 0.0011, n = 14 SOM cells and n = 12 PV cells). d Correlation of PV (green) and SOM (purple) cell inhibitory weight (discharge frequency ratio) and initial SPN discharge frequency. There is a significant correlation for SOM cells in both DMS (r2= 0.3481, Pearson's correlation, p = 0.0437, n = 14) and DLS (r2= 0.4648, p = 0.0127, n = 14), and there was no significant correlation for PV cells (r2= 0.097 for DMS and r2= 0.1739 for DLS); *p < 0.05, **p < 0.01
Frequency (Hz) Number of events 100 60 20 30 25 20 15 10 5 0
a
d
b
0 pA 0 pA 20 mV 100 ms 20 mV 100 ms +20 pA +20 pA +170 pA +170 pA 20 mV 1 s DLS DMS 28 Hz 25 Hz 11 Hz 32 Hz PV PV SOMc
DMS DLS DMS DLS SOM SOMg
f
e
h
0 100 200 300 0 100 200 300 400 DMS DLS PV density (cells/0.1 mm 3) ns DMS DLSSOM density (cells/0.1 mm
3) –59 mV –61 mV –55 mV –54 mV –71 mV –72 mV PV SOM DMS DLS PV SOM 0.0 0.5 1.0 1.5 2.0 2.5
Unitary IPSP amplitude (mV)
Paired recordings Light-evoked potentials
i
DMS DLS 1 mV 100 ms 1 mV 100 ms PV SOM PV SOM SPNj
SPN DMS DLS PV SOM 0 2 4 6 8Light-induced IPSP amplitude (mV) PV SOM 1 mV 1 mV 0 100 200 300 400 0 400 800 1200 1600 –80 –70 –60 –50 –40 –80 –70 –60 –50 –40 0 400 800 1200 1600 0 100 200 300 400 DMS DLS ns RMP (mV) Input resistance (M Ω ) DMS DLS DMS DLS Rheobase (pA) ns ns DMS DLS DMS DLS DMS DLS Rheobase (pA) RMP (mV) Input resistance (M Ω ) ** ** ** ** ** ** ** * **
Fig. 5 Heterogeneous distribution, electrical properties and connectivity of SOM and PV cells in DMS and DLS. a, b Confocal microscopy images showing a representative overview of SOM (a) and PV (b) interneuron expression in DMS and DLS (scale bars: 50µm), identified following immunostainings. On the right panels, quantification of SOM (a) and PV (b) interneurons in DMS and DLS is represented by the cell density (number of cells per 0.1 mm3) of SOM and PV interneurons in each territory (n = 9 mice for SOM interneurons and n = 7 mice for PV interneurons). c Representative responses of SOM cells to identical current steps (+20 pA) in DLS and DMS. d Membrane and electrical properties of SOM cells in DMS (orange, n = 20) and DLS (blue, n = 27) (mean ± SEM). e Representative responses of PV cells to identical current steps (+170 pA) in DLS and DMS. f Membrane and electrical properties of PV cells in DMS (orange, n = 17) and DLS (blue,n = 30). There is no significant difference in rheobase (p = 0.2761), RMP (p = 0.6030) and input resistance (p = 0.3260) of PV cells in DMS or in DLS.g Representative spontaneous activity of SOM cells in DMS and DLS. h Distribution and Gaussianfits of the discharge frequency in DLS (100 action potentials per cell,n = 8) and DMS (n = 6): the frequency is significantly higher in DMS (p < 0.0001).
i Representative connections between of PV-SPN and SOM-SPN connections in DMS and DLS in response to 20 Hz single AP trains evoked in PV and SOM cells with current injections.j Amplitude of unitary IPSPs in a SPN (single AP with paired patch-clamp recordings) in DMS and DLS. For PV-SPN connections the unitary IPSP was median (interquartile range (IQR)): 0.9 (0.6) mV (n = 5) in DMS and 1.3 (0.7) mV in DLS (n = 6) and for SOM-SPN connections 0.3 (0.8) mV (n = 6) in DMS and 0.4 (0.2) mV in DLS (n = 4). They were not statistically different in DMS (p = 0.0648) but much stronger from PV in DLS (p = 0.0094). Concerning light-induced IPSP amplitudes, SOM cell opto-activation induced significantly stronger IPSPs in DMS (p = 0.0158) and PV cells in DLS (p = 0.0019) (SOM-DMS: 2.3 (1.1) mV,n = 19, PV-DMS: 1.1 (0.5) mV, n = 16, SOM-DLS: 1.5 (1.1) mV, n = 14, and PV-DLS: 2.9 (3.2) mV, n = 15). *p < 0.05, **p < 0.01, ns not significant
Because a heterogeneous anatomical distribution could not
fully account for the functional dichotomy between DMS and
DLS (the distribution of SOM interneurons is homogeneous,
Fig.
5
a), we next examined whether SOM and PV cells exhibited
different electrophysiological properties in DMS and DLS. For
this purpose, we performed whole-cell recordings of SOM and PV
cells targeted thanks to the green
fluorescent protein/yellow
fluorescent protein (GFP/YFP) of the Arch/ChR2 constructs. All
recorded
fluorescent neurons exhibited typical basic properties
and spiking activity of SOM or PV interneurons (Supplementary
Table 1). We
first cross-compared the electrophysiological
properties of SOM and PV cells. We observed that, in both
DMS and DLS, SOM interneurons display more depolarized
resting membrane potential (RMP) (p < 0.0001 for both DMS and
DLS), higher input resistance (Ri) (p < 0.0001 for both DMS and
DLS) and lower rheobase (p < 0.0001 for both DMS and DLS)
than PV cells, suggesting that SOM cells are more excitable than
PV cells. We then compared the membrane properties of SOM
and PV cells according to their location in DMS and DLS. We
found no difference in RMP (n
= 30 in DLS and n = 18 in DMS,
p
= 0.6030), Ri (p = 0.3260) and rheobase (p = 0.2761) between
PV-DMS and PV-DLS (Fig.
5
e, f). In contrast, we observed a
marked difference in the properties of SOM cells since those
located in DMS exhibit a higher excitability than those located in
DLS: lower rheobase (n
= 27 in DLS and n = 20 in DMS, p =
0.0011), depolarized RMP (p
= 0.0059) and higher Ri (p =
0.0049) (Fig.
5
c, d). Although PV cells were not spontaneously
active (in ex vivo conditions), spontaneous activity was recorded
in half of SOM cells in both territories (14/22 cells in DMS and
DLS). We observed that the spontaneous
firing frequency of
active SOM cells was significantly higher in the DMS (DMS 11.7
± 0.3 Hz, n
= 6 vs. DLS 6.3 ± 0.1 Hz, n = 8, p < 0.0001) (Fig.
5
g,
h), which is in accordance with the higher excitability of SOM
cells observed in DMS (Fig.
5
c, d).
Another explanation could be that the unitary synaptic weight of
PV-SPN and SOM-SPN connections are not the same in DMS and
DLS. To go deeper in the origin of the differential effect of PV and
SOM cells, we thus performed paired patch-clamp recordings to
measure the unitary synaptic weight of PV-SPN and SOM-SPN
connections. We observed that unitary inhibitory postsynaptic
potential (IPSP) amplitudes induced with a single presynaptic
action potential (AP) were not significantly different between PV
and SOM in DMS but significantly higher for PV-SPN connections
in DLS (p
= 0094) (Fig.
5
i, j). The comparison with light-induced
IPSPs indicate that about 3 to 4 interneurons are recruited by the
opto-activation in our conditions for SOM-DLS and PV-DLS, 1 to 2
interneurons for PV-DMS and 8 to 10 interneurons for SOM-DMS.
Therefore, when comparing PV and SOM cells in each territory,
there is a higher amplitude for SOM cell opto-activation in DMS
and PV cell opto-activation in DLS (p
= 0.0158 for DMS and p =
0.0019 for DLS). These data show that, for each GABAergic
population, there is no significant difference in the weight of
their unitary connections in DMS and DLS. The differences of
global inhibitory weight would thus result from the recruitment of
more PV cells in DLS (due to their higher density in DLS) and more
SOM cells in DMS (due to their higher excitability in DMS).
Altogether, these results show a marked heterogeneity in the
GABAergic striatal microcircuits at the level of distribution,
connectivity and electrophysiological properties, which could
account for the territory functional specificity.
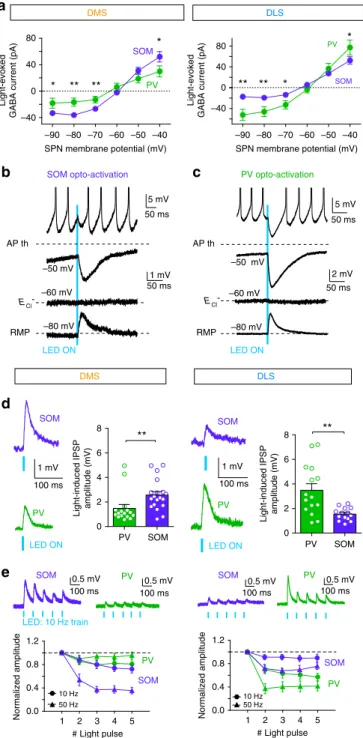
SOM and PV cells mediate a dual effect on SPNs in DMS and
DLS. Due to their intrinsic properties, SPNs
fire upon strong and
correlated cortical activity while they remain mainly silent and
operate in a large range of subthreshold activity in resting
states
22–25. We therefore questioned whether SOM and PV cells
could show selective modulation of subthreshold SPNs between
DMS and DLS, as we found with spiking SPNs. Using SOM::ChR2
and PV::ChR2 mice, we established the current–voltage
rela-tionship of light-induced IPSCs in SPNs. We applied a brief
sti-mulation (5 ms duration) to evoke single APs in SOM and PV
interneurons (Supplementary Fig. 6). In active states (depolarized
potentials, ~−40 mV), we observed stronger light-induced
cur-rents for SOM opto-activation in DMS (p
= 0.0354, n = 12 PV
cells and n
= 17 SOM cells) and for PV opto-activation in DLS (p
= 0.0232, n = 8 PV cells and n = 11 SOM cells) (Fig.
6
a), which is
consistent with the differential inhibitory effect we previously
observed (Figs.
3
,
4
). In resting states (at hyperpolarized
poten-tials, ~−80 mV), we observed larger IPSCs after opto-activation
of SOM-DMS and PV-DLS cells compared to PV-DMS and
SOM-DLS cells (p
= 0.0057 for DMS, n = 12 PV cells and n = 17
SOM cells and p
= 0.0057 for DLS, n = 8 PV cells and n = 11
SOM cells). Therefore, PV and SOM cells exert differential effect
regardless of the SPN activity.
Interestingly, at hyperpolarized states, GABAergic interneuron
activation resulted in depolarizing currents (Figs.
5
i and 6a–c).
This is explained by the fact that (i) SPN membrane
fluctuations
widely cross E
Cl− threshold (physiological E
Cl~−60 mV
18,26)
and (ii) GABA is hyperpolarizing for E
h>
−60 mV and
depolarizing for E
h<
−60 mV. To investigate whether the
depolarizing GABA mediated by PV or SOM interneurons also
displays differential effect in DMS and DLS as with inhibitory
GABA, we applied brief opto-stimulations and measured
light-induced IPSPs in resting SPNs (maintained at ~−80 mV). In
accordance with IPSC results (Fig.
6
a), we observed significant
differences between the different groups (F
3, 60= 7.187, p =
0.0003, one-way analysis of variance (ANOVA)). In DMS,
SOM-induced IPSP amplitude recorded in SPNs was larger than
PV-induced IPSP (SOM activation 2.56 ± 0.28 mV, n
= 19 and PV
activation 1.48 ± 0.31 mV, n
= 16; p = 0.0022). In contrast, in
DLS, PV cells had a stronger effect than SOM cells (PV activation
3.48 ± 0.52 mV, n
= 15 and SOM activation 1.54 ± 0.13 mV, n =
14; p
= 0.0043) (Fig.
6
d).
These differential effects were confirmed using trains of
light-induced APs in GABAergic interneurons (at 10 or 50 Hz,
Supplementary Fig. 6). Because temporal patterns of presynaptic
activity strongly influence synaptic transmission, with specific
short-term dynamics, we characterized the short-term dynamics
recorded in SPNs induced by trains of opto-activation of either
PV or SOM cells. PV cells displayed a marked short-term
depression in SPNs in DLS (p
= 0.0018 and p < 0.0001
respec-tively) but not in DMS (p
= 0.0842 for 10 Hz and p = 0.3706 for
50 Hz) (Fig.
6
e). Conversely, SOM cells led to short-term
depression for 10 and 50 Hz stimulation in DMS (p
= 0.0290
and p < 0.0001, respectively) and only for 50 Hz trains in DLS (p
= 0.1337 and p < 0.0001 for 10 and 50 Hz). The observed
short-term depression suggests that the probability of release of
connections from SOM-DMS to SPN and from PV-DLS to
SPN is higher than SOM-DLS to SPN and PV-DMS to SPN. This
observation is in line with the larger responses in SPNs evoked by
opto-stimulation of SOM-DMS cells and PV-DLS cells (Fig.
4
).
Altogether, these results further confirm the selective role of
SOM and PV interneurons in the control of subthreshold SPN
activity in DMS and DLS. They also point out that when SPNs are
at resting states, GABAergic microcircuits can induce a strong
depolarizing effect, which is also mainly mediated by either PV or
SOM cells depending on the striatal territory.
Differential shaping of subthreshold input integration and
summation in DMS and DLS. The depolarizing properties of
GABA could have critical functional consequences on the
inte-gration of subthreshold inputs in SPNs at resting states. To assess
whether SOM and PV interneurons could influence subthreshold
integration in resting SPNs selectively in DMS and DLS, we
investigated whether SOM and PV cells could shape cortically
evoked EPSP in SPNs in response to a single cortical stimulation
(Fig.
7
a). Opto-inhibition of SOM and PV cells significantly
decreased EPSP decay time (Fig.
7
b, c) and this effect was
dif-ferentially regulated by SOM and PV interneurons in DMS and
DLS, respectively: opto-inhibition of SOM cells decreased decay
time in the DMS (p
= 0.001, n = 20) but not in the DLS (p =
0.1007, n
= 11), whereas opto-inhibition of PV cells decreased
EPSP decay in the DLS (p
= 0.001, n = 19) but not in the DMS (p
= 0.9564, n = 16) (Fig.
7
b, c). No effect could be observed on the
rise time, slope and amplitude of EPSPs after interneuron
opto-inhibition, neither in DMS nor in DLS (Supplementary Fig. 9).
This could be explained by the disynaptic nature of the
feedfor-ward inhibition onto SPNs (cortex-interneuron-SPN) that would
delay the arrival of the GABA input until the decay phase of the
monosynaptic cortico-SPN EPSP. These results show that
SOM-DMS and PV-DLS efficiently shape single cortically evoked EPSPs
in subthreshold SPNs by slowing down the EPSP decay phase and
thus suggest they could affect the integration of subthreshold
cortical inputs by SPNs.
We thus investigated whether the shaping of single EPSPs by
SOM and PV interneurons could play a role in the summation of
cortically induced subthreshold inputs in SPNs in DMS and DLS.
To do so, different regimes of cortical activity inducing
subthreshold activity in SPNs were mimicked with trains of
cortical stimulations at various frequencies (5, 10, 20, 50 and 100
Hz). We compared the short-term dynamics of cortically evoked
EPSPs in SPNs maintained at E
m~−80 mV either in control
conditions or under selective opto-inhibition of SOM or PV cells
in SOM::Arch3 and PV::Arch3 mice (Fig.
7
and Supplementary
Fig. 10) or viral expression of AAV-Flex-ArchT-tdtomato in
SOM-Cre and PV-Cre mice (Supplementary Fig. 11). In control
conditions (no light), temporal summation was efficient for high
frequencies (at 50 and 100 Hz) but not for medium frequencies
(10 and 20 Hz). Synaptic depression could even be recorded for
low-frequency activation (5 Hz) (both in DMS and DLS, Fig.
7
f
and Supplementary Fig. 10). Selective opto-inhibition of SOM or
PV cells decreased EPSP summation in SPNs in DMS and DLS,
respectively (Fig.
7
d–g): opto-inhibition of SOM cells induced a
decrease of temporal summation in DMS (F
1, 120= 2.05, p <
0.0001, n
= 25 SPNs) but not in DLS (F
1, 80= 0.11, p = 0.1536, n
= 17 SPNs), while opto-inhibition of PV cells following a 50 Hz
train led to a decrease in the temporal summation of EPSP
amplitude in the DLS (F
1, 100= 2.10, p < 0.0001, n = 24 SPNs) but
not in DMS (F
1, 65= 0.14, p = 0.1338, n = 14 SPNs) (Fig.
7
d, e).
Similar results were obtained for different frequencies (5, 10, 20
and 100 Hz) of cortical stimulations (Fig.
7
f, g and Supplementary
Fig. 10). In addition, similar results were obtained with expression
LED ON SOM PV 100 ms 1 mV PV SOM 0.5 mV 100 ms LED: 10 Hz train 0.5 mV 100 ms 100 ms 1 mVd
e
1 2 3 4 5 0.0 0.4 0.8 1.2 # Light pulse Normalized amplitude 10 Hz 50 Hzc
5 mV 50 ms 1 mV 50 ms AP th –60 mV RMP –80 mV –50 mV 5 mV 50 ms 2 mV 50 ms AP th –60 mV RMP –80 mV –50 mV LED ONa
PV opto-activation SOM opto-activation ECl- ECl -–90 –80 –70 –60 –50 –40 –40 0 40 80 Light-evokedGABA current (pA)
SPN membrane potential (mV) SPN membrane potential (mV) –90 –80 –70 –60 –50 –40 –40 0 40 80 * ** ** 1 2 3 4 5 0.0 0.4 0.8 1.2 10 Hz 50 Hz # Light pulse Normalized amplitude *
b
SOM PV SOM PV LED ON SOM PV SOM PV SOM PV SOM PV 0.5 mV 100 ms 0.5 mV 100 ms Light-evokedGABA current (pA)
DMS DLS DMS DLS LED ON 0 2 4 6 8
Light-induced IPSP amplitude (mV)
0 2 4 6 8
Light-induced IPSP amplitude (mV) PV SOM
PV SOM ** ** *
*
** **
Fig. 6 Dual effect of SOM and PV cells depending on the state of SPNs. a Current/voltage relationship of the light-evoked responses recorded in DMS and DLS after opto-activation of PV (green) or SOM (purple) cells. There are significant differences in the light-induced GABA currents between PV and SOM cells activation at−90, −80, −70 and −40 mV in DMS and DLS.b, c Representative traces of light-induced PSPs in SPNs evoked by short opto-activation (5 ms light pulses) of either SOM (b) or PV cells (c). Responses are recorded in SPNs held at different potentials (−80, −60 and −50 mV) or in spiking SPN (APs are truncated for clarity of the figure). d, e In DMS and DLS, synaptic weight of SOM or PV cells on SPNs were evaluated in SPNs maintained at their RMP (~−80 mV). Amplitudes of IPSPs induced by a single pulse (d) or trains of light pulses (e) were evaluated.d In DMS, single light pulse induces IPSPs with significantly (p = 0.0022) larger amplitude in SPNs after SOM cell opto-activation (purple traces,n = 19 cells) than after PV cell opto-activation (green traces, n = 16 cells). In DLS, opto-activation of PV cells (n = 14) induces significantly (p = 0.0043) larger IPSPs in SPNs than SOM cell opto-activation (n = 14). e Representative responses recorded in SPNs after opto-activation of SOM cells (purple traces) and PV (green traces) with 10 Hz trains of 5 ms light pulses. Short-term dynamics of IPSPs induced by trains of light pulses at 10 or 50 Hz after SOM cell (purple traces,n = 7 cells in DMS and n = 6 in DLS) or PV cell (green traces,n = 9 cells in DMS and n = 6 in DLS) activation. SOM-induced IPSPs display significantly stronger short-term depression at 10 (F1, 50= 8.94, p = 0.0126, two-way ANOVA) and 50 Hz
(F1, 50= 44.22, p < 0.0001) in DMS compared to DLS. On the contrary, PV
cells induce stronger short-term depression in DLS compared to DMS (F1, 80= 11.97, p = 0.0001 for 10 Hz and F1, 70= 41.94, p < 0.0001 for 50 Hz);
of Arch in SOM and PV cells restricted locally to DMS or DLS
using viral strategy (Supplementary Fig. 11). Interestingly,
silencing of SOM-DMS and PV-DLS cells had a stronger effect
for medium frequencies (10, 20 and 50 Hz) and no or limited
effect for low (5 Hz) and high frequencies (100 Hz) (Fig.
7
),
suggesting
that
the
depolarizing
effect
of
GABAergic
microcircuits preferentially favors the subthreshold summation
of such medium frequencies of cortical activity.
Finally, we asked whether the number of cortical cells activated
and the resulting variation in EPSP amplitude in SPNs could
influence the effect of interneuron silencing on summation. In
control conditions, the amplitude of EPSP1 significantly
a
b
70 80 90 100 110 70 80 90 100 110 70 80 90 100 110 70 80 90 100 110 Normalized decay (%) LED ONLED ON LED ON LED ON
2 mV 50 ms
Normalized decay (%)
PV silencing
SOM silencing SOM silencing PV silencing
1 mV 20 ms 1 mV 20 ms 2 mV 50 ms Ctrl LED ON 0 20 40 60 Ctrl LED ON 0 10 20 30 40 Ctrl LED ON 0 10 20 30 40 Ctrl LED ON 0 10 20 30 Decay time (ms) Normalized decay (%)
Decay time (ms) Decay time (ms)
Normalized decay (%) Decay time (ms) DMS DLS
d
e
Normalized amplitude (EPSPn/EPSP1) CTRL LED ON CTRL LED ONf
g
0.9 1.1 1.3 1.5 0.9 1.1 1.3 1.5 # Stimulation 5 4 3 2 1 # Stimulation 5 4 3 2 1 # Stimulation 5 4 3 2 1 # Stimulation 5 4 3 2 1 1.1 1.3 1.50.9 Normalized amplitude (EPSP n/EPSP 1)
10 mV 100 ms 10 mV 100 ms 0.9 1.1 1.3 1.5 0.8 1.0 1.2 1.4 1.6 0.8 1.0 1.2 1.4 1.6 0.8 1.0 1.2 1.4 1.6 Normalized amplitude (EPSP3/EPSP1) Normalized amplitude (EPSP3/EPSP1) EPSP1 amplitude (mV) CTRL LED ON CTRL LED ON 5 Hz 10 Hz 20 Hz 50 Hz 100 Hz 5 Hz 10 Hz 20 Hz 50 Hz 100 Hz 5 Hz 10 Hz 20 Hz 50 Hz 100 Hz 5 Hz 10 Hz 20 Hz 50 Hz 100 Hz Normalized amplitude (EPSP3/EPSP1) Normalized amplitude (EPSP3/EPSP1)
EPSP1 amplitude (mV) EPSP1 amplitude (mV) EPSP1 amplitude (mV)
h
i
0.8 1.0 1.2 1.4 1.6 50 Hz 50 Hz PV silencingSOM silencing SOM silencing PV silencing
0 5 10 15 20 25 0.0 0.5 1.0 1.5 2.0 2.5 0 5 10 15 20 25 0.0 0.5 1.0 1.5 2.0 2.5 0 5 10 15 20 25 0.0 0.5 1.0 1.5 2.0 2.5 0 5 10 15 20 25 0.0 0.5 1.0 1.5 2.0 2.5 CTRL LED ON CTRL LED ON * DMS DLS
c
570 nm LED ON Cortex Cortex SPN Stim Cx LED ON Stim Cx LED ON SOM :: Arch3 PV :: Arch3 ** ** ** ** *** *** * ** ** * * ** ** *** ECl- ECl-influenced the summation (for 50 and 100 Hz) since it is more
effective for smaller EPSPs but has no effect on the EPSP trains
for other frequencies (5, 10 and 20 Hz) (Fig.
7
h–i) in both DMS
and DLS. The opto-inhibition of SOM or PV cells did not change
this correlation regardless of the frequency (Fig.
7
h–i). Thus,
interneuron silencing would have the same effect for all tested
amplitudes of the subthreshold EPSPs.
Altogether, these results show a physiological role for
depolarizing GABA in the control of synaptic integration by
SPNs that is selectively mediated by SOM and PV interneurons
depending on the striatal region.
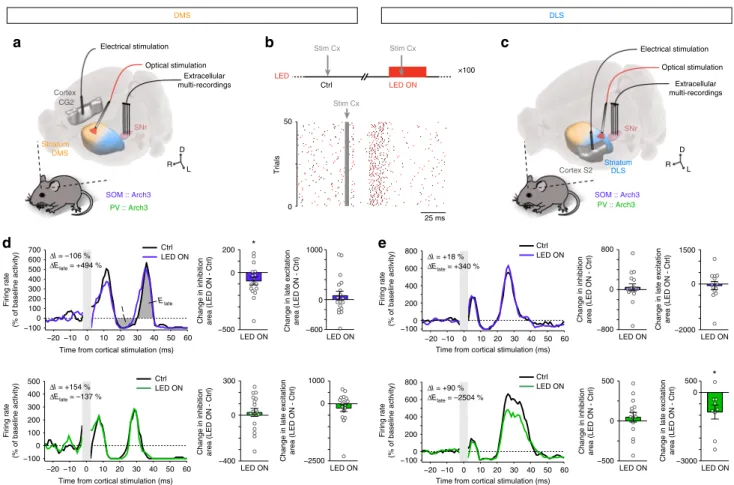
In vivo selective modulation of cortically evoked SNr activity
by striatal GABAergic circuits. We
finally investigated the
out-come of the differential weight of SOM and PV interneurons in
DMS and DLS, on the transfer of information between the
(cortical) input and the (nigral) output of the striatum. In SOM::
Arch3 and PV::Arch3 mice, we stimulated the cortical area
(cin-gulate or somatosensory cortex) projecting to DMS and DLS,
respectively, and recorded the evoked response of SNr units with
and without opto-inhibition of SOM or PV cells in DMS or DLS
(Fig.
8
a–c). We observed a typical pattern of responses to cortical
stimulation, consisting of three consecutive phases due to the
activation of three cortico-SNr pathways
27–29: (phase 1) an early
excitation, corresponding to the activation of the
“hyperdirect”
non-trans-striatal pathway (cortico-STN-SNr), followed by
(phase 2) an inhibition, corresponding to the
“direct”
trans-striatal pathway (cortico-striato-SNr), and (phase 3) a late
exci-tation, reflecting the “indirect” trans-striatal pathway
(cortico-striato-pallido-STN-SNr). This typical
“triphasic” response was
observed in SNr units, as well as other combinations of these
three phases, with a similar proportion across conditions of the
occurrence of
“full” triphasic responses (37%, n = 27 units from 4
mice SOM-DMS; 48%, n
= 31 from 4 mice PV-DMS; 35%, n = 20
from 4 mice SOM-DLS and 30%, n
= 20 from 3 mice PV-DLS, p
= 0.5918, Fisher’s exact test). Similar proportions of occurrence
were also observed for each individual phase when considered
independently (Supplementary Fig. 12). For each SNr unit, we
calculated the deviation from baseline activity (50 ms before
sti-mulation, in the absence or presence of light) caused by the
cortical stimulation, and measured the area of each phase (when
present). Interestingly, the area of the inhibition phase (phase 2)
was significantly reduced only when opto-inhibiting SOM
inter-neurons in DMS (−74 ± 35%, p = 0.0481, n = 17 units, paired
t-test), and not in any of the 3 other conditions (PV-DMS: p
=
0.4971, n
= 18; SOM-DLS: p = 0.4995, n = 18; PV-DLS: p =
0.4543, n
= 15) (Fig.
8
d, e; Supplementary Table 2). Conversely,
the area of the late excitation (phase 3) was significantly reduced
only when opto-inhibiting PV interneurons in DLS (−859 ±
308%, p
= 0.0237, n = 9 units, paired t-test), and not in any of the
other conditions (PV-DMS: p
= 0.2174, n = 19; SOM-DMS: p =
0.3714, n
= 19; SOM-DLS: p = 0.6949 n = 13) (Fig.
8
d, e). The
duration of the inhibition phase and the peak of the late
excita-tion phase displayed significant changes consistent with the area
of each phase in SOM-DMS and PV-DLS conditions
(Supple-mentary Fig. 12; Supple(Supple-mentary Table 2). In all conditions, the
area of the early excitation (phase 1) was not affected by the
opto-inhibition of either interneuron type in either territory
(Supple-mentary Fig. 12; Supple(Supple-mentary Table 2) in line with the fact that
this phase results from the activation of the non-trans-striatal
pathway.
Altogether, these results indicate that the stronger effect of
SOM interneurons in DMS and of PV interneurons in DLS
translates into specific effect of these striatal interneurons/
territory combinations on the trans-striatal transfer of
informa-tion between the cortical input and the nigral output of the
striatum.
Discussion
In the present study, we describe a marked specificity in
GABAergic circuit properties and in the control of SPN activity
and their downstream consequences on SNr activity depending
on the functional striatal territory (DMS vs. DLS). These results
demonstrate a strong heterogeneity in the composition and
function of GABAergic microcircuits in DMS and DLS. We show
that SOM cells regulate SPN activity more efficiently in the DMS,
while PV cells have a stronger weight in the DLS. In addition, we
show that GABAergic interneurons regulate SPN activity in a
dual manner: hyperpolarizing for suprathreshold SPN activity
and depolarizing for subthreshold SPN activity. The depolarizing
effect efficiently controls the integration of cortical input in the
subthreshold range of SPN activity. Because the expression of the
opsins is in about half of the SOM and PV interneurons (both for
transgenic and virally expressed), the observed effect might be
even stronger when 100% of GABAergic microcircuits are
recruited. In addition, similar results obtained in transgenic mice
and virally expressed opsins show that the differential effect of
SOM and PV cells is strictly due to local striatal microcircuits and
not to external SOM and PV projections recently described from
the cortex or the globus pallidus
30–32.
In our study, we observed that the differential effect of PV cells
might be due to their heterogeneous distribution throughout the
striatum. The observed distribution in mice is consistent with
previous studies showing a rostro-caudal gradient of PV cells in
rats, monkeys and humans
33–36. In addition, we observed here
that PV cells have similar membrane and spiking properties in
Fig. 7 SOM and PV cells favor subthreshold cortical activity summation. a In the DMS and DLS, cortically evoked subthreshold EPSPs or trains of EPSPs were recorded in SPNs in control or with opto-inhibition of SOM or PV cells.b, c Representative EPSPs recorded in DMS (b) and DLS (c) in control conditions (black) or with opto-inhibition of SOM cells (purple) or PV cells (green). Individual experiments (2 measurements for each neuron) and normalized (mean ± SEM) decay time of cortically evoked EPSPs in SPNs in control condition compared to opto-inhibition of SOM and PV cells. There is a significant decrease of EPSP decay time with opto-inhibition of SOM-DMS cells (p = 0.001, n = 20, paired-test) and PV-DLS cells (p = 0.001, n = 19). d, e Top: Representatives 50 Hz trains of EPSPs recorded in SPNs in control or with selective opto-inhibition of interneurons. Bottom: Temporal summations of EPSPs in SPNs after 50 Hz cortical electrical stimulation in control conditions (black) or with opto-inhibition of SOM (purple) or PV (green) cells.d In DMS, opto-inhibition of SOM cells induces a significant decrease in summation of EPSPs (p < 0.0001, n = 24, two-way ANOVA), whereas PV cell opto-inhibition has no effect (p = 0.1338, n = 14). e In DLS, PV cell opto-inhibition induces a significant decrease in summation of EPSPs (p < 0.0001, n = 25) and SOM cell opto-inhibition has no effect (p = 0.1536, n = 17). f, g Summary of the effects of interneuron silencing on temporal summation: ratio of the third EPSP compared to thefirst one for the different frequencies. f In DMS, SOM cell opto-inhibition strongly affects the summation of EPSPs in the trains for most activation frequencies (10, 20, 50 and 100 Hz), whereas there is no effect of PV cell opto-inhibition.g On the contrary, in DLS, PV cells strongly affect the summation of EPSPs in the trains for 10, 20, 50 and 100 Hz while silencing of SOM cells had no effect, except for 10 Hz activation.h, i Correlation of the normalized amplitude (EPSP3/EPSP1) and the amplitude of thefirst EPSP of the 50 Hz train, in DMS and DLS and for SOM and PV silencing. For all the conditions, there is a significant correlation, which is similar in control conditions or after interneuron silencing; *p < 0.05, **p < 0.01, ***p < 0.001
DMS and DLS; this observation being different from a recent
study showing higher excitability of PV cells in DMS
37(probably
due to different experimental conditions such as composition of
extra- and intracellular solutions and slice orientation). In
con-trast, despite their homogeneous density throughout the striatum,
SOM cells exhibit distinct electrophysiological properties in DMS
and DLS, more excitable in DMS than DLS. Functionally, PV
cells, or fast-spiking cells, have been the most extensively
char-acterized in the striatum. PV cells are known to exert a strong
inhibitory weight on SPNs since they delay or even stop the
spiking activity in SPNs
15,38,39. SOM cells (also expressing NPY
and NOS) are also able to delay AP in SPNs
15,38; they have been
initially reported to have a lower connection probability with a
weaker weight onto SPNs
40compared to PV cells, but high
amplitude of evoked responses of SOM-SPN connections after
SOM opto-activation was recently reported
41,42, similar to what
we observed in the present study. NPY expressing interneurons
(overlapping with SOM cells) also strongly inhibit SPNs
43. The
differences in the characteristics of PV and SOM populations
between DMS and DLS would give rise to the territory specificity.
Indeed, even though the unitary connections from PV to SPN or
from SOM to SPN are similar in both territories, their global
action as populations is higher for PV cells in DMS due to their
density and to SOM cells in DMS due to their intrinsic properties.
In addition, cross-comparison shows that unitary PV-SPN
con-nections are stronger than SOM-SPN concon-nections in DLS.
Alto-gether, we propose that these properties are underlying the
functional dichotomy of PV and SOM cells in DMS and DLS.
The differential localization of the synapses from SOM and PV
cells on the SPN dendrites could contribute to the specific
modulation of cortical inputs. Nevertheless, even though PV cells
contact SPN closer to the soma than SOM cells, their contacts are
both located within the
first 250 µm of the SPN dendritic
arborization
42, placing both of them in a strategic position to
modulate the integration of glutamatergic inputs. In addition, we
focused here on the two main subtypes of GABAergic
inter-neurons but there are also other subtypes such as the
electro-physiologically unidentified calretinin-expressing cells, and the
Striatum DMS Cortex CG2 SNr SOM :: Arch3 PV :: Arch3 Striatum DLS Cortex S2 SNr DLS DMS Stim Cx Stim Cx LED Stim Cx LED ON SOM :: Arch3 PV :: Arch3 Electrical stimulation Optical stimulation R L D R L D Optical stimulation Electrical stimulation −20 −10 0 10 20 30 40 50 60 −100 0 100 200 300 400 500 600 700 Firing rate (% of baseline activity) Ctrl LED ON
Time from cortical stimulation (ms)
−20 −10 0 10 20 30 40 50 60 −100 0 100 200 300 400 500 Ctrl LED ON Firing rate (% of baseline activity)
Time from cortical stimulation (ms)
LED ON
Change in inhibition area (LED ON - Ctrl)
LED ON
Change in late excitation area (LED ON - Ctrl)
LED ON
Change in late excitation area (LED ON - Ctrl)
LED ON
Change in inhibition area (LED ON - Ctrl)
* I Elate −20 −10 0 10 20 30 40 50 60 −100 0 200 400 600 800 CtrlLED ON Firing rate (% of baseline activity)
Time from cortical stimulation (ms)
−20 −10 0 10 20 30 40 50 60 −100 0 200 400 600 800 Ctrl LED ON Firing rate (% of baseline activity)
Time from cortical stimulation (ms)
LED ON
Change in inhibition area (LED ON - Ctrl)
LED ON
Change in inhibition area (LED ON - Ctrl)
LED ON
Change in late excitation area (LED ON - Ctrl)
LED ON
Change in late excitation area (LED ON - Ctrl)
* −500 0 200 −3000 0 500 −400 0 300 −800 0 800 −500 0 500 −600 0 1000 −2500 0 1000 −2000 0 1500 ΔI = –106 % ΔI = +154 % ΔElate = –137 % ΔI = +90 % ΔElate = –2504 % ΔI = +18 % ΔElate = +340 %
a
c
d
e
25 ms ×100 0 50 Trials Ctrlb
Extracellular multi-recordings Extracellular multi-recordings ΔElate = +494 %Fig. 8 Selective control of cortico-nigral information transfer by SOM and PV cells. a, c Experimental set up: in vivo multi-channel extracellular recordings of SNr unit activity using 4-shank 32-site silicon probe in response to stimulation in CG2 (a) or S2 (c) cortex, while PV or SOM interneurons are opto-inhibited using an opticfiber implanted in the DMS (a) or DLS (c). b Top: A cortical stimulation is applied in the absence (left) or presence (right) of light (300 ms, 10 mW, stimulation 100 ms after light onset, cycle repeated at least 100 times, 2–6 s between trials). Bottom: Raster plot of a representative SNr unit recorded in the PV-DLS condition (unit ine bottom), showing the response to the cortical stimulation in interleaved Ctrl (black ticks) and LED ON (red ticks) trials.d, e Left: Activity of a representative SNr unit displaying a triphasic response upon cortical stimulation of CG2 (d) or S2 (e), in the absence of (Ctrl) or during the opto-inhibtion (LED ON) of SOM (top) or PV (bottom) interneurons in DMS (d) or DLS (e). The response is normalized to the baseline activity independently in each (Ctrl and LED ON) case. The measured areas of the trans-striatal phases (inhibition and late excitation) are illustrated in d, top, and the measured differences in area (LED ON– Ctrl) are indicated for each representative unit. Right: Change in response areas corresponding to the trans-striatal inhibition (left), and late excitation (right), in all units displaying the corresponding phase. The cortico-nigral inhibition phase is significantly reduced only by the opto-inhibition of SOM striatal interneurons in the DMS condition (d, top, p = 0.0481, n = 17 units, paired t-test), while the cortico-nigral late excitation phase is significantly reduced only by the opto-inhibition of PV interneurons in the DLS (e, bottom, p = 0.0237, n = 9 units, pairedt-test); *p < 0.05. For the 3D images in a and c, brain and brain structures are captured from the Allen Institute for Brain Science’s Mouse Brain Atlas74(© 2004 Allen Institute for Brain Science, Allen Mouse Brain Atlas available from: mouse.brain-map.org/) using Brain Explorer®275