HAL Id: hal-02620833
https://hal.inrae.fr/hal-02620833
Submitted on 26 May 2020
HAL is a multi-disciplinary open access
archive for the deposit and dissemination of
sci-entific research documents, whether they are
pub-lished or not. The documents may come from
teaching and research institutions in France or
abroad, or from public or private research centers.
L’archive ouverte pluridisciplinaire HAL, est
destinée au dépôt et à la diffusion de documents
scientifiques de niveau recherche, publiés ou non,
émanant des établissements d’enseignement et de
recherche français ou étrangers, des laboratoires
publics ou privés.
Distributed under a Creative Commons Attribution| 4.0 International License
Key Processes in the History of Olive Domestication
Bouchaib Khadari, Ahmed El Bakkali
To cite this version:
Bouchaib Khadari, Ahmed El Bakkali. Primary Selection and Secondary Diversification: Two Key
Processes in the History of Olive Domestication. International Journal of Agronomy and Agricultural
Research, The International Network for Natural Sciences, 2018, 2018, �10.1155/2018/5607903�.
�hal-02620833�
Research Article
Primary Selection and Secondary Diversification: Two Key
Processes in the History of Olive Domestication
Bouchaib Khadari
1,2and Ahmed El Bakkali
31AGAP, University Montpellier, CIRAD, INRA, Montpellier SupAgro, Montpellier, France
2Conservatoire Botanique National M´editerran´een de Porquerolles (CBNMed), UMR AGAP, Montpellier, France 3INRA, UR Am´elioration des Plantes et Conservation des Ressources Phytog´en´etiques, Mekn`es, Morocco
Correspondence should be addressed to Bouchaib Khadari; khadari@supagro.fr
Received 9 January 2018; Revised 14 May 2018; Accepted 9 August 2018; Published 29 November 2018 Academic Editor: Faruk Toklu
Copyright © 2018 Bouchaib Khadari and Ahmed El Bakkali. This is an open access article distributed under the Creative Commons Attribution License, which permits unrestricted use, distribution, and reproduction in any medium, provided the original work is properly cited.
Knowledge on the crop domestication process is important from a cultural and agricultural standpoint since it can shed light on the origin and history of human civilizations as well as the management of genetic resources, while offering guidance for modern breeding. The olive tree (Olea europaea ssp. europaea) is the most iconic of the old crop species of the Mediterranean Basin (MB). Primary domestication from wild olive probably occurred around 6000 BP in the Middle East. However, the question remains as to whether cultivated olive derived from a single domestication event in the Levant, followed by secondary diversification, or whether it was the result of independent domestication events. Here, we analyzed a comprehensive sample collected from 35 wild populations (722 individuals) and 410 cultivars from across the MB using nuclear and plastid DNA markers. Our genetic investigations argue in favor of a single primary domestication event in the eastern MB, followed by diffusion of the first domesticated olive and diversification in the central and western MB as key processes in the olive tree history.
1. Introduction
Understanding crop domestication and diversification pro-cesses is important to infer the origin of the crop and highlight the history of human civilizations. These investigations can be useful for genetic resource management while offering guid-ance for modern breeding. Olive (Olea europaea ssp. europaea) is considered to be the most iconic tree in Mediterranean areas. Oliviculture is one of the oldest cropping practices developed in these areas, and olive trees have therefore accompanied the emergence of early Mediterranean civilizations [1]. According to paleobotanical, archaeological, and genetic investigations, the olive tree may have persisted around the Mediterranean Basin (MB) as part of the natural plant community since the Late Tertiary [2]. However, despite the economic, cultural, ecological, and historical importance of the species, its origin and history have yet to be clearly documented. Clarifying the olive domestication and diversification process has therefore long been a focus of active scientific research [3].
According to Carri´on et al. [4], during the Middle and Late Pleniglacial (59,000–11,500 yrs BP), Olea europaea had persisted in three thermophilous refugia located in the southern areas of the north MB, the southern Levant, and North Africa. Due to outcrossing of olive species, wild forms (oleasters, O. europaea ssp. europaea var. sylvestris) probably contributed to genetic diversity at the local scale, thus fa-cilitating secondary diversification. It is usually considered that the center of primary olive domestication, from wild progenitors, began roughly around 6000 BP in the Middle East, near the border between Turkey and Syria [1, 5]. This assumption was supported by investigations based on chloroplast DNA polymorphism [5, 6], showing that more than 90% of olive cultivars across the Mediterranean Basin share the same eastern-like haplotype, therefore indicating an east-west human-mediated diffusion of cultivars in the MB. However, the scenario of a single primary domesti-cation center has yet to be demonstrated. Based on paleo-botanical and archaeological investigations, early
Hindawi
International Journal of Agronomy Volume 2018, Article ID 5607903, 9 pages https://doi.org/10.1155/2018/5607903
exploitation and use of wild olive trees from the Near East to Spain have been documented since the Neolithic period [7, 8]. The findings of several studies support multiple or-igins of cultivars across the Mediterranean region [9–13], but it remains unclear whether this reflects secondary di-versification or multiple independent primary domestica-tion events [13–15]. Indeed, genetic patterns observed by Diez et al. [13] suggest the occurrence of a second separate olive domestication event in the central MB. The hypothesis of a second independent domestication in the central MB remains to be explored because cultivated olive di-versification may also have occurred in this area and in the western MB as the result of local independent domestication [14]. Following the response letter of Diez and Gaut [15], the hypothesis of an independent domestication event in the central MB may ultimately be confirmed or disproven. Therefore, the question as to whether there was a single olive domestication center or multiple ones has yet to be answered.
In the present study, we investigated the history of olive trees through a comprehensive sampling of genuinely wild populations and domesticated forms from across the Mediterranean using nuclear and plastid marker analysis. Our results are discussed based on the question as to whether the current cultivated olive derived from a single domes-tication event in the Levant followed by secondary di-versification or whether it is the result of independent domestication events.
2. Materials and Methods
2.1. Plant Material. A total of 1,132 distinct genotypes were
analyzed in this study, including 410 cultivars from 15 countries and 722 wild olive samples from 35 populations throughout the Mediterranean area (Figure 1; Tables S1 and S2). All cultivars are maintained in the ex situ Worldwide Olive Germplasm Bank at the experimental station of Tassaout, INRA, Marrakech, Morocco [6, 16]. Wild pop-ulations were sampled in natural areas far from olive agro-ecosystems in order to minimize admixture with cultivated olives, while taking morphological traits that differ from those of cultivated olives into consideration, such as smaller fruits with less fleshy mesocarp [17]. Thirty of the 35 wild populations were previously described and analyzed [5, 18].
2.2. Molecular Analysis. Total DNA was extracted from
100 mg of fresh leaf tissue, as described by Khadari et al. [19]. DNA quality was checked on 1% agarose gel, and the concentration was estimated using spectrofluorometry (GENios Plus, TECAN, Gr¨odig, Austria).
A set of 16 nuclear microsatellite loci was chosen and used for sample genotyping [20–23] (Table 1). PCR amplification and product separation using a 3130XL capillary sequencer (Applied Biosystems, Foster City, CA, USA) were conducted as described by El Bakkali et al. [16]. Plastid DNA was charac-terized using 37 polymorphic simple sequence repeat (SSR) loci and two cleaved amplified polymorphism sites (CAPS-XapI and CAPS-EcoRI), as described by Besnard et al. [24].
2.3. Data Analysis. We computed the following genetic
diversity parameters for wild and cultivated olives separately and for each genetic group: the number of alleles (Na), expected heterozygosity (He), and observed heterozygosity (Ho) using the Excel Microsatellite Toolkit v3.1 [25]. The inbreeding coefficient (Fis) was calculated using the FSTAT
program v2.9.3.2b [26], whereas the allelic richness (Ar; [27]) was estimated using the ADZE program [28]. The Mann–Whitney comparison test was used to evaluate the significance of the allelic richness differences.
To investigate the genetic structure pattern within olive samples (wild and cultivated), discriminant analysis of principal components (DAPC; [29]) with theADEGENET1.3.1
package [30] in the R environment was applied with a priori grouping assumptions based on previous studies [6, 13, 18]. Unlike the STRUCTURE program, the absence of any as-sumption about the underlying population genetics model, in particular concerning Hardy–Weinberg equilibrium or linkage equilibrium, is one of the main assets of DAPC [29]. Based on the model-based Bayesian clustering approach implemented in theSTRUCTUREprogram [31] as described in previous studies on olive species [6, 13, 18], wild olive was found to be structured in two groups (named western-central and eastern Mediterranean wild), whereas culti-vated olive was in three groups (called western, central, and eastern Mediterranean cultivated olive), with one group shared between wild and cultivated olives (eastern Medi-terranean). Hence, we set an a priori group number of four in the DAPC method for the whole dataset.
Moreover, once the wild and cultivated olive genotypes were assigned to their a posteriori genetic groups, re-lationships among genotypes and genetic groups were an-alyzed by principal coordinate analysis (PCoA) based on the simple matching coefficient [32], as implemented in the DARWIN v. 6.0.11 program [33]. Pairwise genetic differenti-ation and significance (FST, [34]) between genetic groups, as revealed by membership assignation using the DAPC method, was estimated using 100,000 permutations with the GENEPOP program [35], and the unrooted FSTwas plotted using the POPTREE2program [36], with 999 bootstrap rep-licates with the Neighbor-joining method.
3. Results
3.1. Genetic Diversity in Wild and Cultivated Olive. Based on
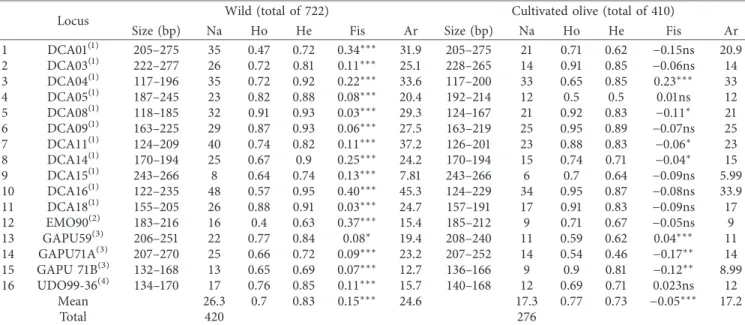
the analysis of 1,132 genotypes using 16 SSR markers, we identified a total of 427 alleles with an average of 26.69 alleles per locus. The number of alleles observed in wild olive (420) was higher than that in cultivated olive (276). Similarly, the expected heterozygosity (He, diversity index) was greater in wild than in cultivated olive (Table 1).
A total of 33 plastid haplotypes were identified in both wild and cultivated olives. More plastid haplotypes be-longing to E1 were identified compared to E2 and E3, i.e., 18, 10, and 4 haplotypes, respectively (Table 2). Otherwise, we revealed more maternal lineages in wild (32) than in cul-tivated olive (12). In fact, the highest proportion of plastid haplotypes in cultivated olive was observed for E1.1 (79.9%) followed by E1.2 (8.1%), whereas those belonging to E2 and
Spain 82 Italy 117 Tunisia 15 14 21 22 18 22 18 23 17 40 25 24 37 18 27 28 20 14 22 14 29 15 19 19 11 12 15 13 2614 29 12 2224 1820 Cyprus/Lebanon 19 Egypte 18 Morocco 19 Algeria 31 Croatia/Slovenia 20 France 10 Portugal 13 Turkey 5 Greece 16 E1 E2 E3L1 Syria 45
Figure1: Map indicating the location, number of olive samples, and proportion of maternal lineages according to the geographic origin for wild and cultivated olives. Cultivars are shown in green and wild olives in red.
Table1: Genetic parameters of the 16 SSR markers used in this study for wild and cultivated olives.
Locus Wild (total of 722) Cultivated olive (total of 410)
Size (bp) Na Ho He Fis Ar Size (bp) Na Ho He Fis Ar
1 DCA01(1) 205–275 35 0.47 0.72 0.34∗∗∗ 31.9 205–275 21 0.71 0.62 −0.15ns 20.9 2 DCA03(1) 222–277 26 0.72 0.81 0.11∗∗∗ 25.1 228–265 14 0.91 0.85 −0.06ns 14 3 DCA04(1) 117–196 35 0.72 0.92 0.22∗∗∗ 33.6 117–200 33 0.65 0.85 0.23∗∗∗ 33 4 DCA05(1) 187–245 23 0.82 0.88 0.08∗∗∗ 20.4 192–214 12 0.5 0.5 0.01ns 12 5 DCA08(1) 118–185 32 0.91 0.93 0.03∗∗∗ 29.3 124–167 21 0.92 0.83 −0.11∗ 21 6 DCA09(1) 163–225 29 0.87 0.93 0.06∗∗∗ 27.5 163–219 25 0.95 0.89 −0.07ns 25 7 DCA11(1) 124–209 40 0.74 0.82 0.11∗∗∗ 37.2 126–201 23 0.88 0.83 −0.06∗ 23 8 DCA14(1) 170–194 25 0.67 0.9 0.25∗∗∗ 24.2 170–194 15 0.74 0.71 −0.04∗ 15 9 DCA15(1) 243–266 8 0.64 0.74 0.13∗∗∗ 7.81 243–266 6 0.7 0.64 −0.09ns 5.99 10 DCA16(1) 122–235 48 0.57 0.95 0.40∗∗∗ 45.3 124–229 34 0.95 0.87 −0.08ns 33.9 11 DCA18(1) 155–205 26 0.88 0.91 0.03∗∗∗ 24.7 157–191 17 0.91 0.83 −0.09ns 17 12 EMO90(2) 183–216 16 0.4 0.63 0.37∗∗∗ 15.4 185–212 9 0.71 0.67 −0.05ns 9 13 GAPU59(3) 206–251 22 0.77 0.84 0.08∗ 19.4 208–240 11 0.59 0.62 0.04∗∗∗ 11 14 GAPU71A(3) 207–270 25 0.66 0.72 0.09∗∗∗ 23.2 207–252 14 0.54 0.46 −0.17∗∗ 14 15 GAPU 71B(3) 132–168 13 0.65 0.69 0.07∗∗∗ 12.7 136–166 9 0.9 0.81 −0.12∗∗ 8.99 16 UDO99-36(4) 134–170 17 0.76 0.85 0.11∗∗∗ 15.7 140–168 12 0.69 0.71 0.023ns 12 Mean 26.3 0.7 0.83 0.15∗∗∗ 24.6 17.3 0.77 0.73 −0.05∗∗∗ 17.2 Total 420 276
(1)Sefc et al. [20],(2)De La Rosa et al. [21],(3)Carriero et al. [22],(4)Cipriani et al. [23]. Significance level at p≤ 0.05∗, 0.01∗∗, and 0.001∗∗∗. ns: nonsignificant.
E3 (total of 6 haplotypes) were detected only in 32 cultivars (7.8%; Table S2).
3.2. Genetic Clustering. The genetic structure of
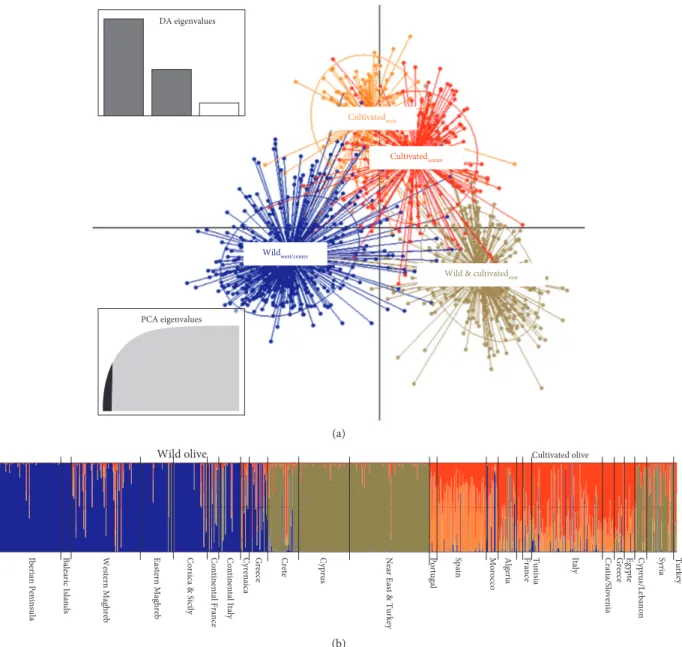
Mediter-ranean olive was investigated using discriminant analysis of principal components (DAPC). The “find.clusters” function was used to determine the number of clusters maximizing the variation between clusters [30]. To avoid the loss of information, the function was performed with 200 principal components, accounting for more than 98% of the variance (Figure S1(a)). The Bayesian information criterion (BIC) was used to identify the optimal number of clusters, i.e., 11 clusters (Figure S1(b)). Based on these 11 clusters as a first analysis, DAPC clustering was represented according to the origin of olives classified in four a priori groups: western-central Mediterranean wild olive, eastern Mediterranean wild and cultivated olives, western cultivated olive, and central cultivated olive (Figure S1(c)). Western cultivated olive showed narrow genetic diversity (cluster 7), whereas those from the central Mediterranean Basin displayed high diversity included in 3 clusters (clusters 1, 3, and 6). Sim-ilarly, eastern and western-central wild olive displayed high diversity, i.e., 3 and 4 clusters, respectively (Figures S1(c) and S1(d)). Pairwise FSTvalues among the 11 predefined clusters resulting from DAPC ranged from 0.017 (cluster 5-cluster 8) to 0.129 (cluster 4-cluster 7) (Table S3).
Based on the assignation membership probability resulting from DAPC at p ≥ 0.8, five groups could be identified: (i) eastern Mediterranean wild (referred as Wildeast), (ii) eastern cultivated olive (Cultivatedeast), (iii) western and central Mediterranean wild olive (Wildwest-center), (iv) western Mediterranean cultivated olive (Culti-vatedwest), and (v) central Mediterranean cultivated olive (Cultivatedcenter). Although they are belonging to the same pool (Figures 2 and 3), Wildeast and Cultivatedeast were considered as two distinct groups to describe the re-lationships between wild and cultivated olives in the eastern MB. Otherwise, at the p < 80% assignation level, wild and cultivated olive showed admixture: Wildadmixed and Cultivatedadmixed, respectively (Figure 2; Tables 2 and S4). For admixed wild and cultivated forms, we noted the occurrence of the three plastid lineages with a high
proportion of E1 for cultivated olive (86.0%), whereas for admixed wild olive, close proportions of E1 and E2 were observed (53.1% and 44.9%, respectively, Table 2). When considering the a priori groups, more wild admix-ed genotypes were notadmix-ed in the western-central part of MB. Similarly, more admixed cultivars were observed in the western-central MB area compared to the east (Table S5).
To investigate genetic relationships between the five groups defined above, principal coordinate analysis (PCoA) was performed (Figure S2). Most of the variation (13.06%) was explained by the first two axes. For both wild and cultivated olives, the first axis corresponded to the east-west spatial distribution at the MB scale, where both wild olive groups (Wildwest-center and Wildeast) were genetically dis-tinct. The second axis separated Cultivatedwest and Culti-vatedcenterolives from Wildeastand Cultivatedeastolives. The latter were clustered as one pool. Admixed genotypes for both Wildadmixedand Cultivatedadmixedwere plotted midway between the five genetic groups (Figure S2).
3.3. Genetic Variation and Relationships among Genetic Groups. The mean heterozygosity (Ho � 0.701 observed)
noted for wild olive was less than expected (He � 0.826) based on the Hardy–Weinberg equilibrium findings (Fis � 0.151; p < 0.001; Table 3), indicating a deficit of het-erozygotes, as noted for wild genetic groups (Wildwest-center and Wildeast). These results may be explained by the sub-division of local populations into isolated and differentiated units (Wahlund effect), as revealed by the 11 predefined DAPC clusters (Figures S1(c) and S1(d)).
Allelic richness (Ar) was estimated and revealed a highly significant difference between wild olive and cultivars (24.58 vs 17.23; Mann–Whitney test, p < 0.001; Table 3). Otherwise, a highly significant difference was observed between Wildeast and Cultivatedeast(12.95 vs 8.01), but not between Wildwest-centerand Wildeast(10.67 and 12.95, respectively) or between Cultivatedcenter and Cultivatedeast. However, within culti-vated olive, Ar for Culticulti-vatedwestwas significantly lower than for Cultivatedcenter and Cultivatedeast (4.19, 7.52, and 8.01, respectively). When focusing on the maternal lineage, more maternal lineages belonging to E2 and E3 were revealed in Table 2: Number and proportion of wild and cultivated genotypes assigned to each a posteriori genetic group resulting from DAPC and proportion of major maternal lineages for each group.
Genetic groups Assigned genotypes∗(%) Maternal lineage (%)
E11 E22 E33 L1.1
Cultivatedwest 50 (12.2) 50 (100.0)
Cultivatedcenter 138 (33.7) 129 (93.5) 3 (2.2) 6 (4.3)
Cultivatedeast 59 (14.4) 59 (100.0)
Cultivatedadmixed 150 (36.6) 129 (86.0) 14 (9.3) 6 (4.0) 1 (0.7)
Total (cultivated olive) 410 377 (91.95) 18 (4.40) 14 (3.40) 1 (0.24)
Wildwest/center 398 (55.1) 55 (13.8) 307 (77.1) 36 (9.0)
Wildeast 265 (36.7) 265 (100.0)
Wildadmixed 49 (6.8) 26 (53.1) 22 (44.9) 1 (2.0)
Total (wild olive) 722 346 (47.92) 338 (46.82) 38 (5.26)
Total 1132 723 (63.87) 356 (31.45) 52 (4.59) 1 (0.09)
∗Under the assignation probability p > 80%,1
E1: E1.1, E1.2, E1.3, E1.4, E1.5, E1.6, E1.7, E1.8, E1.9, E1.10, E1.11, E1.12, E1.13, E1.14, E1.15, E1.20, E1.21, E1.27,
2
Cultivatedcenter than in Cultivatedeast and Cultivatedwest olives (Table 2; Figure 3). Moreover, for cultivars identified as admixed on the basis of DAPC (membership assignation <0.8), E2 and E3 haplotypes were found in higher pro-portion than for other cultivated groups (Table S5).
The genetic differentiation (FST) values were significant between all pairs of the five groups (Wildeast and Culti-vatedeasttreated separately, p < 0.001; Table 4). The mean FST was 0.105 (p < 0.0001) for the five groups, indicating that 10% of the total genetic variation resulted from genetic differentiation between groups. The pairwise FST ranged from 0.036 to 0.183 (Table 4). The highest values were ob-served between Wildwest-center and all the other groups, whereas the lowest values were revealed between Wildeast and Cultivatedeast groups. Relationships between the five
groups showed a clear distinction between three main groups: (i) Wildwest-center, (ii) Wildeastand Cultivatedeast, and (iii) Cultivatedwestand Cultivatedcenter, as supported by the high bootstrap values (Figure 3). The group Wildwest-center was highly separated from the others based on both nuclear and plastid polymorphism, with the highest proportion of maternal lineages belonging to E2 and E3 haplotypes (86.1%; Table 2; Figure 3).
4. Discussion
Over the last two decades, substantial paleobotanical, ar-chaeological, historical, and molecular data have been ac-cumulated on olive species and the history of its domestication [1, 4, 5, 7, 8, 11–13]. A global overview was Wildwest/center
Wild & cultivatedeast
Cultivatedcenter
Cultivatedwest
DA eigenvalues
PCA eigenvalues
(a)
Wild olive Cultivated olive
Turkey Syria Cyprus/Lebanon Egypte Greece Cratia/Slovenia Italy Tunisia France Algeria Morocco Spain Portugal
Near East & Turkey
Cyprus Crete Greece Cyrenaica Continental Italy Continental France
Corsica & Sicily
Eastern Maghreb
Western Maghreb
Balearic Islands
Iberian Peninsula
(b)
Figure 2: Scatterplot from a discriminant analysis of principal components (DAPC) (a) using the four a priori groups. The sample origins are labeled within their 95% inertia ellipses, and individuals are connected to the corresponding group centroids. The number of PCs retained and discriminant functions are shown. Bar plot from DAPC highlights the membership of individuals in different groups according to geographical zones for both wild and cultivated olives (b).
founded on the basis of several centers of primary selection across the MB [10–12]. However, the question remains unclear as to whether cultivated olives derived from a single primary domestication center followed by secondary di-versification events or whether they are the result of in-dependent primary selection events. A scenario of at least two independent primary selection centers in the eastern and central Mediterranean was proposed by Diez et al. [13]. Investigations on wild olive in the eastern Mediterranean were, however, limited to few sampled populations that were likely feral, as assumed by Diez et al. [13]. The lack of genuinely eastern wild populations has drastically limited the possibility of testing alternative complex domestication scenarios, as pointed out by Besnard and Robio de Casas [14] and Diez and Gaut [15]. Hence, investigating a comprehensive
sample of wild olives throughout the MB could bring insight to help solve questions related to primary domestication and secondary diversification centers. Moreover, contrary to the findings of Diez et al. [13], our eastern wild populations were clearly distinct from the western-central wild olive pop-ulations, thus indicating their genuine status.
Olive tree history is complex, as previously highlighted by several studies (see review in Besnard et al. [3]). Instead of multiple primary domestication centers, we argue in favor of a single primary domestication in the Levant, followed by human-mediated diffusion of the first domesticated forms and admixtures with wild olives in the central and western Mediterranean Basin. However, we cannot exclude the occurrence of minor domestication centers in western and central parts of the MB, as some varieties have been found to Table 3: Summary of genetic parameters for different groups.
Groups n A A% Ho He Fis Ar∗
Wild olive 722 420 98.3 0.701 0.826 0.151∗∗∗ 24.58a1
Cultivated
olive 410 276 64.6 0.765 0.731 −0.047
∗∗∗ 17.23b1
Wildwest/center 398 331 77.5 0.664 0.737 0.094∗∗∗ 10.67ac2
Wildeast 265 362 84.7 0.737 0.806 0.084∗∗∗ 12.95a2
Cultivatedwest 50 79 18.5 0.770 0.589 −0.310∗∗∗ 4.19d2
Cultivatedcenter 138 195 45.6 0.751 0.704 −0.067∗∗∗ 7.52b2
Cultivatedeast 59 160 37.4 0.752 0.712 −0.057∗∗∗ 8.01bc2
n, size of the group; A, number of alleles; A%, percentage of alleles with respect to the total number of alleles observed within wild and cultivated samples (427
alleles); Ho, observed heterozygosity; He, unbiased expected heterozygosity; Fis, inbreeding coefficient; Ar, allelic richness;1estimated based on standardized sample size of G � 410;2estimated based on standardized sample size of G � 50.∗Letters (a, b, c, and d) represent significance groupings after a Mann–Whitney
pairwise comparison test (p < 0.05).
E1 E3 E2 89 78 Cultivatedcenter Cultivatedwest Cultivatedeast 0.02 Wildwest/center Wildeast 95
Figure 3: Unrooted neighbor-joining dendrogram based on the genetic differentiation index (FST), showing relationships among the five genetic groups as identified by DAPC and the proportion of the three maternal lineages (E1, E2, and E3) within each group.
harbor maternal E2 or E3 lineages specific to local genetic resources, indicating their ancient local selection heritage (Figure 1, Table S4). Moreover, morphometric olive stone and charcoal analyses have revealed the use of wild olive before the Neolithic period, suggesting local domestication could have occurred in the western MB area [7]. Here, by investigating current varieties using both nuclear and plastid markers, we obtained evidence of primary selection and secondary di-versification as two key processes in the history of olive do-mestication based on the following arguments. First, we used DAPC and identified a single group including both eastern wild olive (Wildeast) and eastern cultivars (Cultivatedeast), thus indicating direct selection from wild olive pop-ulations, as suggested by Gurbuz-Veral et al. [37]. Second, most cultivated olives have an eastern-like maternal hap-lotype as a signature of the diffusion of the first domes-ticated olives from the eastern to western Mediterranean Basin [5]. Note that the above two arguments are supported by the genetic differentiation index (FST) between different groups, including wild and cultivated olive trees (Figure 3 and Table 4). Third, the allelic richness revealed highly significant differences between Wildeastand Cultivatedeast olives. Contrary to other perennial fruit species such as apple [38], a substantial reduction in allelic diversity was observed between domesticated and wild olives across the MB (up to 30%), especially from the eastern MB (up to 38.1%; Table 3). This finding is in line with the selection pattern during the domestication process, as reviewed by Gaut et al. [39] and Besnard et al. [3] and references therein. Fourth, the genetic pattern of the Cultivatedwest and Cultivatedcenter groups indicated a diversification process based on selection from crosses between the first domesticated olive forms and local olives, thus supporting the assumption of human-mediated diffusion of cultivars. Indeed, among varieties from the central MB, 35% (81 varieties) were admixed with limited gene flow from western-central wild populations (Figure 2; Table S4) and displaying the three maternal lineages (Table S5). Among varieties from the central MB, we found 11% (24) harboring maternal lineages E2 and E3. Moreover, as reported by Belaj et al. [40] and Klepo et al. [41], some central Med-iterranean varieties retain wild-like phenotypic charac-teristics, such as low endocarp weight and a smooth endocarp surface. These findings suggest a second center of domestication, as reported by Diez et al. [13], but evidence to back this assumption has yet to be documented [3].
We argue here in favor of a diversification process oc-curring in the western and central MB. Fifth, Diez et al. [13] found that most first-degree relationships were from the same
genetic group (i.e., western cultivated olive; 96.3%) in which two cultivars from Spain (i.e., Gordal Sevillana and Lechin de Granada) had more than 60 first-degree relationships. Varieties harboring E2 and E3 from the western MB were found to be closely related within the western cultivated group such as Lechin de Sevilla with E2.3 maternal lineage (Table S2) and five first-degree relationships [13]. Regardless of the maternal lineages, the presence of highly related varieties indicated di-versification based on crosses between cultivated olives as a key olive domestication process in the central and western MB.
5. Conclusion
Beyond a single primary olive tree domestication event, our investigation underlines the importance of admixtures within cultivated olive groups from the central and western Mediter-ranean Basin. Clarifying the evolutionary processes responsible for these groups will help gain important insight into accurately identify the genes under selection. This will also help to design methods for sampling of Mediterranean olive germplasm, in-cluding wild olives suitable for genome-wide association studies and genomic selection under the impact of climate change and within the sustainable oliviculture setting. Moreover, identifying olive diversity hotspots in the MB could also help to develop cost-effective diversity-prioritized approaches for in situ olive genetic resource conservation and management.
Data Availability
The complete dataset is available upon request to the cor-responding author: khadari@supagro.fr.
Disclosure
First results from the present study have been presented as an oral communication within the Fourth International Amer-ican Moroccan, Agriculture Science Conference “AMAS Conference IV” held in May 9–11, 2018, at Agropolis, Mekn`es, Morocco (see http://www.amas-conference.org/wp- content/uploads/2018/05/AMAS-IV-FinalProgramBooklet-5-3-18-RegularPrint.pdf ).
Conflicts of Interest
The authors declare that they have no conflicts of interest.
Authors’ Contributions
Bouchaib Khadari and Ahmed El Bakkali contributed equally to this work.
Table 4: Pairwise genetic differentiation FSTvalues between the five groups as revealed by DAPC method for wild and cultivated olives.
Cultivatedcenter Cultivatedwest Cultivatedeast Wildeast
Cultivatedwest 0.075∗∗∗
Cultivatedeast 0.052∗∗∗ 0.140∗∗∗
Wildeast 0.060∗∗∗ 0.142∗∗∗ 0.036∗∗∗
Wildwest-center 0.168∗∗∗ 0.176∗∗∗ 0.183∗∗∗ 0.144∗∗∗
Pairwise significance after sequential Bonferroni corrections:∗∗∗, significance at p < 0.001. Numbers in bold are the highest values observed and underlined
are the lowest.
Acknowledgments
We thank A. Al Ibrahim, G. Besnard, M. Gurbuz, H. Haouane, A. Moukhli, and J. F. Terral for providing olive samples. This work was conducted at UMR AGAP. We thank L. Essalouh, S. Santoni, and Ch. Tollon for laboratory assistance. This research was supported by the project OliveMed/Agropolis Fondation no. 1202-066 through the
Investissements d’avenir/Labex Agro
ANR-10-Labex-0001-01 managed by the French National Research Agency (ANR) and by the BeFOre project “Bioresources for Oliviculture” 2015–2019, H2020-MSCA-RISE-Marie Skłodowska-Curie Research and Innovation Staff Exchange, Grant Agree-ment no. 645595.
Supplementary Materials
Table S1: list of the 35 wild olive populations. The sampling locations, the number of populations, individuals per lo-cation (size), and the GPS coordinates are given. Table S2: list of the 410 Mediterranean olive cultivars analyzed in the present study, along with their origins and maternal lineages. Table S3: pairwise genetic differentiation (FST) among the 11 subclusters, as identified by DAPC using the “find.clusters” function. Table S4: number of wild and cultivated olives per region of origin and the number and proportion of in-dividuals assigned to each group based on the DAPC findings with a membership probability of 0.8. Table S5: proportion of maternal lineages according to the a priori grouping clusters for both wild and cultivated olives iden-tified as admixed genotypes by DAPC with a membership assignation of p < 0.8. Figure S1: discriminant analysis of principal component (DAPC) results. Cumulative variance explained by the principal component analysis (PCA) rel-ative to the number of principal components (PCs) retained in the analysis (a). Selection of the optimal number of clusters in the DAPC using the lowest Bayesian information criterion (BIC; (b)). Comparison of clustering performed by DAPC (K � 11) and the a priori wild and cultivated olive groups (c). Squares represent the number of individuals in each pairwise comparison. Scatterplot from a DAPC of olive genotypes showing the relationships between the 11 iden-tified clusters (d). Figure S2: principal coordinate analysis (PCoA) based on the simple matching coefficient showing the relationships among cultivated and wild olive genotypes according to groups resulting from DAPC. (Supplementary
Materials)
References
[1] D. Kaniewski, E. Van Campo, T. Boiy, J. F. Terral, B. Khadari, and G. Besnard, “Primary domestication and early uses of the emblematic olive tree: palaeobotanical, historical and mo-lecular evidences from the middle east,” Biological Reviews, vol. 87, no. 4, pp. 885–899, 2012.
[2] E. Palamarev, “Paleobotanical evidences of the tertiary history and origin of the Mediterranean sclerophylldendroflora,”
Plant Systematics and Evolution, vol. 162, no. 1–4, pp. 93–107,
1989.
[3] G. Besnard, J. F. Teral, and A. Cornille, “on the origins and domestication of the olive : a review and perspectives,” Annals
of Botany, vol. 121, no. 3, pp. 385–403, 2018.
[4] Y. Carri´on, M. Ntinou, and E. Badal, “Olea europaea L. in the North Mediterranean Basin during the Pleniglacial and the Early-Middle Holocene,” Quaternary Science Reviews, vol. 29, no. 7-8, pp. 952–968, 2010.
[5] G. Besnard, B. Khadari, M. Navascu´es et al., “The complex history of the olive tree: from late quaternary diversification of Mediterranean lineages to primary domestication in the northern Levant,” Proceedings of the Royal Society B:
Bi-ological Sciences, vol. 280, no. 1756, article 20122833, 2013.
[6] H. Haouane, A. El Bakkali, A. Moukhli et al., “Genetic structure and core collection of the World Olive Germplasm Bank of Marrakech: towards the optimised management and use of Mediterranean olive genetic resources,” Genetica, vol. 139, no. 9, pp. 1083–1094, 2011.
[7] J. F. Terral, N. Alonso, R. B. Capdevila et al., “Historical biogeography of olive domestication (Olea europaea L.) as revealed by geometrical morphometry applied to biological and archaeological material,” Journal of Biogeography, vol. 31, no. 1, pp. 63–77, 2004.
[8] D. Zohary, M. Hopf, and E. Weiss, Domestication of Plants in
the Old World: The Origin and Spread of Cultivated Plants in Southwest Asia, Europe, and the Mediterranean Basin, Oxford
University Press, Oxford, UK, 2012.
[9] J. F. Terral, La domestication de l’olivier (Olea europaea L.) en
M´editerran´ee nord-occidentale: approche morphom´etrique et implications pal´eoclimatiques, Ph.D. thesis, Universit´e Montpellier II, Montpellier, France, 1997.
[10] G. Besnard, P. Baradat, C. Breton, B. Khadari, and A. Berville, “Olive domestication from structure of oleasters and cultivars using nuclear RAPDs and mitochondrial RFLPs,” Genetics
Selection Evolution, vol. 33, pp. S251–S268, 2001.
[11] L. Baldoni, N. Tosti, C. Ricciolini et al., “Genetic structure of wild and cultivated olives in the central Mediterranean basin,”
Annals of Botany, vol. 98, no. 5, pp. 935–942, 2006.
[12] C. Breton, M. Tersac, and A. Berville, “Genetic diversity and gene flow between the wild olive (oleaster, Oleaeuropaea L.) and the olive: several Plio-Pleistocene refuge zones in the Mediterranean basin suggested by simple sequence repeats analysis,” Journal of Biogeography, vol. 33, no. 11, pp. 1916– 1928, 2006.
[13] C. M. Diez, I. Trujillo, N. Martinez-Urdiroz et al., “Olive domestication and diversification in the Mediterranean Ba-sin,” New Phytologist, vol. 206, no. 1, pp. 436–447, 2015. [14] G. Besnard and R. Rubio de Casas, “Single vs multiple
in-dependent olive domestications: the jury is (still) out,” New
Phytologist, vol. 209, no. 2, pp. 466–470, 2016.
[15] C. M. Diez and B. S. Gaut, “The jury may be out, but it is important that it deliberates: a response to Besnard and Rubio de Casas about olive domestication,” New Phytologist, vol. 209, no. 2, pp. 471–473, 2016.
[16] A. El Bakkali, H. Haouane, A. Moukhli, E. Costes, P. Van Damme, and B. Khadari, “Construction of core col-lections suitable for association mapping to optimize use of Mediterranean olive (Olea europaea L.) genetic resources,”
PLoS One, vol. 8, no. 5, Article ID e61265, 2013.
[17] H. Hannachi, C. Breton, M. Msallem, S. Ben El Hadj, M. El Gazzah, and A. Bervill´e, “Differences between native and introduced olive cultivars as revealed by morphology of drupes, oil composition and SSR Polymorphisms: a case study in Tunisia,” Scientia Horticultural, vol. 116, no. 3, pp. 280–290, 2008.
[18] G. Besnard, A. El Bakkali, H. Haouane, D. Baali-Cherif, A. Moukhli, and B. Khadari, “Population genetics of Medi-terranean and Saharan olives: geographic patterns of differ-entiation and evidence for early generations of admixture,”
Annals of Botany, vol. 112, no. 7, pp. 1293–1302, 2013.
[19] B. Khadari, J. Charafi, A. Moukhli, and M. Ater, “Substantial genetic diversity in cultivated Moroccan olive despite a single major cultivar: a paradoxical situation evidenced by the use of SSR loci,” Tree Genetic and Genomes, vol. 4, no. 2, pp. 213–221, 2008.
[20] K. M. Sefc, M. S. Lopes, D. Mendonca et al., “Identification of microsatellite loci in olive (Olea europaea) and their char-acterization in Italian and Iberian olive trees,” Molecular
Ecology, vol. 9, no. 8, pp. 1171–1173, 2000.
[21] R. De la Rosa, C. M. James, and K. R. Tobutt, “Isolation and characterization of polymorphic microsatellites in olive (Olea europaea L.) and their transferability to other genera in the Oleaceae,” Molecular Ecology Notes, vol. 2, no. 3, pp. 265–267, 2002.
[22] F. Carriero, G. Fontanazza, F. Cellini, and G. Giorio, “Identification of simple sequence repeats (SSRs) in olive (Olea europaea L.),” Theoretical and Applied Genetics, vol. 104, no. 2-3, pp. 301–307, 2002.
[23] G. Cipriani, M. T. Marrazzo, R. Marconi, A. Cimato, and R. Testolin, “Microsatellite markers isolated in olive (Olea europaea L.) are suitable for individual fingerprinting and reveal polymorphism within ancient cultivars,” Theoretical
and Applied Genetics, vol. 104, no. 2-3, pp. 223–228, 2002.
[24] G. Besnard, P. Hernandez, B. Khadari, G. Dorado, and V. Savolainen, “Genomic profiling of plastid DNA variation in the Mediterranean olive tree,” BMC Plant Biology, vol. 11, p. 80, 2011.
[25] S. D. E. Park, Trypanotolerance in West African cattle and the
population genetic effects of selection, Ph.D. thesis, University
of Dublin, Dublin, Ireland, 2001.
[26] J. Goudet, “FSTAT (Version 1.2): a computer program to calculate F-statistics,” Journal of Heredity, vol. 86, no. 6, pp. 485-486, 1995.
[27] R. J. Petit, A. El Mousadik, and O. Pons, “Identifying pop-ulations for conservation on the basis of genetic markers,”
Conservation Biology, vol. 12, no. 4, pp. 844–855, 1998.
[28] Z. A. Szpiech, M. Jakobsson, and N. A. Rosenberg, “ADZE: a rarefaction approach for counting alleles private to com-binations of populations,” Bioinformatics, vol. 24, no. 21, pp. 2498–2504, 2008.
[29] T. Jombart, S. Devillard, and F. Balloux, “Discriminant analysis of principal components: a new method for the analysis of genetically structured populations,” BMC Genetics, vol. 11, no. 1, p. 94, 2010.
[30] T. Jombart, “adegenet: a R package for the multivariate analysis of genetic markers,” Bioinformatics, vol. 24, no. 11, pp. 1403–1405, 2008.
[31] J. K. Pritchard, M. Stephens, and P. Donnelly, “Inference of population structure from multilocus genotype data,”
Ge-netics, vol. 155, no. 2, pp. 945–959, 2000.
[32] R. R. Sokal and C. D. Michener, A Statistical Method for
Evaluating Systematic Relationships, vol. 38 of University of
Kansas Science Bulletin, University of Kansas, Lawrence, KS, USA, 1958.
[33] X. Perrier and J. P. Jacquemoud-Collet, “DARwin software,” 2006, http://darwin.cirad.fr/darwin.
[34] B. S. Weir and C. C. Cockerham, “Estimating F-statistics for the analysis of population structure,” Evolution, vol. 38, no. 6, pp. 1358–1370, 1984.
[35] M. Raymond and F. Rousset, “GENEPOP (version 1.2): population genetics software for exact tests and ecumeni-cism,” Journal of Heredity, vol. 86, no. 3, pp. 248-249, 1995. [36] N. Takezaki, M. Nei, and K. Tamura, “POPTREE2: software for constructing population trees from allele frequency data and computing other population statistics with Windows-interface,” Molecular Biology and Evolution, vol. 27, no. 4, pp. 747–752, 2010.
[37] M. Gurbuz-Veral, A. El Bakkali, L. Essalouh et al., “New insights on olive domestication in Turkey,” Acta
Horti-culturae, vol. 1199, pp. 15–20, 2018.
[38] A. Cornille, P. Gladieux, M. J. M. Smulders et al., “New insight into the history of domesticated apple: secondary contribu-tion of the European wild apple to the genome of cultivated varieties,” PLoS Genetics, vol. 8, no. 5, article e1002703, 2012. [39] B. S. Gaut, C. M. D´ıez, and P. L. Morrell, “Genomics and the contrasting dynamics of annual and perennial domestica-tion,” Trends in Genetics, vol. 31, no. 12, pp. 709–719, 2015. [40] A. Belaj, L. Leon, Z. Satovic, and R. de la Rosa, “Variability of wild olives (Olea europaea subsp. europaea var. sylvestris) analyzed by agro-morphological traits and SSR markers,”
Scientia Horticulturae, vol. 129, no. 4, pp. 561–569, 2011.
[41] T. Klepo, R. De la Rosa, Z. Satovic, L. Leon, and A. Belaj, “Utility of wild germplasm in olive breeding,” Scientia
Hor-ticulturae, vol. 152, pp. 92–101, 2013.
Nutrition and Metabolism Journal of Hindawi www.hindawi.com Volume 2018 Hindawi www.hindawi.com Volume 2018
Food Science
Hindawi www.hindawi.com Volume 2018 International Journal ofMicrobiology
Hindawi Publishing Corporation
http://www.hindawi.com Volume 2013 Hindawi www.hindawi.com
World Journal
Volume 2018 Hindawi www.hindawi.comApplied &
Environmental
Soil Science
Volume 2018Agriculture
Advances in Hindawi www.hindawi.com Volume 2018Psyche
Hindawi www.hindawi.com Volume 2018Biodiversity
International Journal ofHindawi www.hindawi.com Volume 2018
Scientifica
Hindawi www.hindawi.com Volume 2018Genomics
International Journal of Hindawi www.hindawi.com Volume 2018Plant Genomics
International Journal ofHindawi www.hindawi.com Volume 2018 Biotechnology Research International Hindawi www.hindawi.com Volume 2018
Forestry Research
International Journal of Hindawiwww.hindawi.com Volume 2018
Botany
Hindawi
www.hindawi.com Volume 2018
Ecology
International Journal ofHindawi www.hindawi.com Volume 2018 International Hindawi www.hindawi.com Volume 2018