Publisher’s version / Version de l'éditeur:
Vous avez des questions? Nous pouvons vous aider. Pour communiquer directement avec un auteur, consultez la
première page de la revue dans laquelle son article a été publié afin de trouver ses coordonnées. Si vous n’arrivez pas à les repérer, communiquez avec nous à PublicationsArchive-ArchivesPublications@nrc-cnrc.gc.ca.
Questions? Contact the NRC Publications Archive team at
PublicationsArchive-ArchivesPublications@nrc-cnrc.gc.ca. If you wish to email the authors directly, please see the first page of the publication for their contact information.
https://publications-cnrc.canada.ca/fra/droits
L’accès à ce site Web et l’utilisation de son contenu sont assujettis aux conditions présentées dans le site LISEZ CES CONDITIONS ATTENTIVEMENT AVANT D’UTILISER CE SITE WEB.
Thermal Performance of Exterior Envelopes of Whole Buildings X International
Conference [Proceedings], pp. 1-14, 2007-12-02
READ THESE TERMS AND CONDITIONS CAREFULLY BEFORE USING THIS WEBSITE. https://nrc-publications.canada.ca/eng/copyright
NRC Publications Archive Record / Notice des Archives des publications du CNRC :
https://nrc-publications.canada.ca/eng/view/object/?id=b62dd15b-5548-4c93-8f14-630ebc350ecc https://publications-cnrc.canada.ca/fra/voir/objet/?id=b62dd15b-5548-4c93-8f14-630ebc350ecc
NRC Publications Archive
Archives des publications du CNRC
This publication could be one of several versions: author’s original, accepted manuscript or the publisher’s version. / La version de cette publication peut être l’une des suivantes : la version prépublication de l’auteur, la version acceptée du manuscrit ou la version de l’éditeur.
Access and use of this website and the material on it are subject to the Terms and Conditions set forth at
Characterization of indoor hygrothermal conditions in houses in
different northern climates
Rousseau, M. Z.; Manning, M. M.; Said, M. N.; Cornick, S. M.; Swinton, M.
C.
http://irc.nrc-cnrc.gc.ca
C h a r a c t e r i z a t i o n o f i n d o o r h y g r o t h e r m a l
c o n d i t i o n s i n h o u s e s i n d i f f e r e n t n o r t h e r n
c l i m a t e s
N R C C - 5 0 0 8 0
R o u s s e a u , M . ; M a n n i n g , M . ; S a i d , M . N . ;
C o r n i c k , S . M . ; S w i n t o n , M . C .
A version of this document is published in / Une version de ce document se trouve dans: Thermal Performance of Exterior Envelopes of Whole Buildings X International
Conference, Clearwater, Florida, Dec. 2-7, 2007, pp. 1-14
The material in this document is covered by the provisions of the Copyright Act, by Canadian laws, policies, regulations and international agreements. Such provisions serve to identify the information source and, in specific instances, to prohibit reproduction of materials without
written permission. For more information visit http://laws.justice.gc.ca/en/showtdm/cs/C-42
Les renseignements dans ce document sont protégés par la Loi sur le droit d'auteur, par les lois, les politiques et les règlements du Canada et des accords internationaux. Ces dispositions permettent d'identifier la source de l'information et, dans certains cas, d'interdire la copie de
Characterization of Indoor
Hygrothermal Conditions in Houses
in Different Northern Climates
Madeleine Rousseau, Marianne Manning, M. Nady Said, Steve M Cornick and
Mike Swinton
National Research Council Canada, Institute for Research in Construction, Building
Envelope and Structure Program
ABSTRACT
This paper presents selected findings of a field survey of the indoor temperature and relative humidity conditions in 24 homes located in one northern coastal climate and two climates North of the 60th parallel. This survey is part of a four-year research project aiming at the development of durable building envelopes for extreme northern and northern coastal climates. Findings of the surveys show that a higher occupancy load did not translate into either higher relative humidity indoors or higher occurrence of moisture problems. Some surveyed homes experienced untypically poor temperature control indoors due to the absence of a heat distribution system compounded by high air leakage rates through the building envelope, and that led to moisture-related problems such as occurrence of mould growth on interior finishes. Other findings from the surveys showed that short-term peaks of high relative humidity events regularly occurred in all homes surveyed in ‘wet rooms’ (bathrooms and kitchens). The data captured in these field surveys provide valuable information for the design of a test protocol for the assessment of the hygrothermal response of large-scale wall test specimens, which will be subjected to extreme environmental loads on both the interior and the exterior sides.
INTRODUCTION
Limited information is available on the design of building envelopes and technologies for indoor and outdoor climate extremes as found in northern Canadian communities and northern coastal regions. In addition, the data on current indoor conditions in these communities is quite limited. Previous research at IRC had investigated the relationship between outdoor and indoor RH and temperature and window condensation potential through field surveys (Kent et al. 1967), but had focused on more populated (southern) locations of Canada. In this survey, the focus was on extreme climates, both coastal and north of the 60th parallel, as less is known about how these houses operate in those extreme climates and how various climate and human factors affect indoor conditions.
The severity of the indoor and outdoor climatic conditions prevailing in these geographical regions affects the performance and durability of the building envelope. Defining prevailing concurrent indoor and outdoor temperature and relative humidity provides input for determining the indoor conditions in forthcoming experimental and numerical modelling studies.
Three field surveys of indoor air temperature and relative humidity were conducted as part of a current four-year study, which aims to develop building envelope assemblies that are energy-efficient and durable under extreme outdoor and indoor climatic conditions (Rousseau et al. 2007). The study has a particular focus on the hygrothermal performance of the exterior walls of houses, considering moisture is a major factor for deterioration in buildings. The project includes these other tasks: a review of innovative and high energy performance wall assemblies (Said 2006), outdoor climate load characterization (Cornick 2005), laboratory and computational evaluation of wall systems in response to environmental loading, and an energy and environmental impact analysis of selected wall assemblies.
This paper discusses the measurement of indoor temperature and relative humidity levels over a one-month period, in 2 rooms in each of 24 homes distributed in 3 northern Canadian communities, in relation to the house characteristics and the occupancy loads.
METHODOLOGY OF THE FIELD SURVEYS
Each field survey included measurements of indoor air temperature (T) and relative humidity (RH) in two rooms of 8 housing units. The Natural Resources Canada EnerGuide for Houses (EGH) evaluation was also completed. The EGH evaluation is an energy audit based on HOT2000/HOT2XP software and it includes a fan depressurization test to establish the air leakage rate of the unit. An outdoor set of RH and T measurements was taken in exterior air in proximity of the housing units surveyed. The RH and T measurements were taken every 3 minutes over a one-month period, and averaged hourly for the analysis. A brief questionnaire designed to capture the general characteristics of the building envelope and the mechanical systems, the occupancy loads during the day and at night and the presence and type of moisture problems encountered in the unit (if any) was completed by energy audit evaluators with support from the local Public Housing authority and the occupants. Half the houses in each survey were deemed to have moisture-related problems.
Two local building science firms (The Sheltair Group in Vancouver BC, and Arctic Energy Alliance in Yellowknife NT) were responsible for the selection of the housing units in collaboration with the local Public Housing Corporations, the deployment and retrieval of the sensors, other data collection (e.g. photographs, questionnaire) and reporting, and coordination with the Canadian government EnerGuide for Houses program.
Data loggers for indoor and outdoor use were calibrated at the National Research Council Canada and shipped for deployment.
CHARACTERISTICS OF THE SURVEY SITES
Location
The surveys were carried out in these communities (Figure 1) at the following dates: • Prince Rupert British Columbia Canada;
April 21st-May 21st 2005
• Inuvik Northwest Territory Canada, November 18th- December 18th 2005 • Carmacks Yukon Territory Canada, Jan 19th-Feb. 21st 2006
Climate
Northern coastal climates (i.e. cool and very humid) and northern climates (i.e. very cold and dry) were included in the surveys. Table 1 provides some outdoor climate data from the survey sites. Figure 2 shows the outdoor temperature prevailing during the survey periods using probability distribution curves.
A statistical approach was used to analyze the climate data. 31 days of hourly average data were analyzed and binned, for each of the 16 interior sensors and 1 exterior sensor, and for each geographical location. A bin width of 0.5°C (0.9°F) was used to analyze the temperature data. Once binned, the frequency data was then converted into probability data by dividing each bin by the total number of hourly readings taken over the 31-day period. The average result for each location is plotted in Figure 2. The x-axis displays the measured outdoor temperature, while the y-axis displays the percentage of total hours during the survey period that the specified temperature condition was present. Similar graphs were developed for relative humidity, using hourly data and a bin width of 5%.
Figure 1. Locations (circled) of the 3 field surveys
TABLE 1
Climatological Data for the Survey Sites
Location Celcius Degree Days below 18°C (Fahrenheit degree days below 64°F) Annual Rainfall, mm (in) MI index 2% Jan. design temp, °C (°F)
Min and max Exterior temp during survey,
°C (°F) Prince Rupert
(northern coastal climate) 4050 (7290)
2750 (108.3) 2,84 -14 (6.8) 5 to 25 (41 to 77) airport Whitehorse (northern climate) 6900 (12420) 170 (6.69) 0,49 -41 (-42) 6 to -41 (43 to –42) on site Inuvik (northern climate) 10050 (18090) 115 (4.53) 0,67 -46 (-51) -4 to -41 (25 to –42) on site • Whitehorse is the centre for meteorological data closest to Carmacks where the survey was conducted.
Exterior Temperature - Probability Distribution
0% 1% 2% 3% 4% 5% 6% 7% 8% -50 -40 -30 -20 -10 0 10 20 30 40 Temperature (°C)
Percentage of total hours during survey period
-58 -40 -22 -4 14 32 50 68 86 104
Temperature (°F)
Prince Rupert - Exterior Inuvik - Exterior Carmacks - Exterior
Figure 2. Distribution of outdoor temperature measured during the one-month survey period in each location
Prince Rupert BC Survey
The sample of 8 houses was selected in collaboration with the local public housing corporation. Table 2 presents some of the house construction characteristics and the occupancy load. Heating systems were either electric baseboard or hot-water radiators. The houses were built on crawl spaces. Reported moisture problems included: mould growth on the interior finish in closets, bedrooms, bathrooms, and on window sills; and dew and frost on window glazings. In terms of other moisture generating sources, house no. 1 used a humidifier, and house no. 3 had the clothes dryer vented into the crawl space. Interestingly, the house with 8 occupants did not report any moisture problems. Air leakage measurements showed the
houses to be leaky (ranging between 5 and 10 air changes per hour [ACH] at 50 Pa [1.0 lb/ft2] pressure differential). Partitions between units (most of the houses were part of a row-housing complex) and connections with the crawl space were likely providing a considerable path for air flow.
TABLE 2
Characteristics of House Sample- Prince Rupert BC
Bldg date Bldg type Wall construction
Air leakage ACH@50 Pa (ACH@1.0 lb/ft2); ELA, cm2 (in2) EGH rating ** No. of occupants (day/night) Bathroom (B) /Kitchen (K) exhaust fans Sample with no reported moisture problems
No. 3 1970 2 storey
row house
Wood siding, plywood, 38x89 (2X4), RSI 2.1 (R12) batt, poly; drywall
6.3; 783 (121) 75 8 (4/8) Yes- B (manual operation) No. 5 1970s 2 storey row house
Wood siding,, plywood, 38x89 (2X4), RSI 1.4 (R8) batt, poly; drywall
9.9; 1103 (171) 65 2 (2/2) Yes-K; Yes-B (with humidistat) No. 7 1970s 2 storey row house
Wood & metal siding,, air space, plywood, 38x89 (2X4), RSI 2.1 (R12) batt, poly; drywall
5.3; 658 (102) 73 4 (2/4) Yes-K (manual operation) No. 8 1980s 2 storey row house
Wood siding, air space, bldg paper, plywood, 38X89 (2X4), RSI 2.1 (R12) batt, poly; drywall
6.7;
751 (116) 74 2 (1/2)
Yes-K (manual operation) Sample with reported moisture problems
No. 1 1980s
2 storey row house
Wood siding, air space, bldg paper, plywood, 38X89 (2X4), RSI 2.1 (R12) batt, poly; drywall
5.0; 661 (102) 72 2 (1/1) Yes- K Yes-B (with humidistat) No. 2 1970s 2 storey semi-detached
Brick& wood siding, air space, bldg paper, plywood, 38X89 (2X4), RSI 2.1 (R12) batt, poly; drywall 7.4; 903 (140) 74 3 (1/3) Yes- K Yes-B (with humidistat) No. 4 1990s 2 storey row house
Wood siding, air space, bldg paper, plywood, 38X89 (2X4), RSI 2.1 (R12) batt, poly; drywall
6.2; 777 (120) 77 6 (3/6) Yes- K Yes-B (with humidistat) No. 6 1980s 2 storey row house
Wood & metal siding,, plywood, 38X89 (2X4), RSI 2.1 (R12) batt, poly; drywall 6.4; 656 (102) 73 3 (1/3) Yes-K (manual operation) ** The Canadian EnerGuide for Houses (EGH) rating is a house energy efficiency rating determined using Natural Resources Canada procedures. An old house without upgrades will typically have a rating between 1 and 50; an upgraded old house: between 51 and 65; an energy-efficient upgraded older house or typical new house: between 66 and 74; an efficient new house: between 75 and 79; a highly energy-efficient new house: between 80 and 90; and a house requiring little or no purchased energy: between 91 and 100.
Indoor Temperature.
In the mild and wet climate of Prince Rupert (in springtime), average dailyindoor temperatures were widely spread between 15°C and 32°C (59 and 90°F) (Figure 3). Bathrooms in houses with moisture problems operated at much lower or higher indoor temperature for longer periods than the houses without reported moisture problems. Other surveyed spaces included closets and storage rooms (moisture problems were reported at these locations), and in some cases these spaces operated at cooler temperatures than living spaces. For instance, the house no. 6 (3 occupants) bathroom operated between 16 and 22°C (61 and 72°F), did not have a bathroom exhaust fan and experienced recurrent moisture problems such as mould growth on the bathroom ceiling.
Temperature Probability Curves - Prince Rupert Moisture Troubled Houses
0% 5% 10% 15% 20% 25% 30% 35% 40% 15 16 17 18 19 20 21 22 23 24 25 26 27 28 29 30 31 32
Indoor Temperature Bin (°C)
Percentage of total hours during survey period
59.0 60.8 62.6 64.4 66.2 68.0 69.8 71.6 73.4 75.2 77.0 78.8 80.6 82.4 84.2 86.0 87.8 89.6
Indoor Temperature Bin (°F)
closet/storage bedroom bath
Average all Moisture Troubled House 6
bath
Temperature Probability Curves - Prince Rupert Non Moisture Troubled Houses
0% 5% 10% 15% 20% 25% 30% 35% 40% 15 16 17 18 19 20 21 22 23 24 25 26 27 28 29 30 31 32
Indoor Temperature Bin (°C)
Percentage of total
hours during survey period
59.0 60.8 62.6 64.4 66.2 68.0 69.8 71.6 73.4 75.2 77.0 78.8 80.6 82.4 84.2 86.0 87.8 89.6
Indoor Temperature Bin (°F)
bath
closet/other
Average all Non Moisture Troubled
Figure 3. Distribution of indoor temperature measurements for the one-month survey in Prince Rupert BC. The legend on the right hand side corner of the graph provides the room where the
Relative Humidity Probability Curve - Prince Rupert Moisture Troubled Houses
0% 10% 20% 30% 40% 50% 60% 70% 0 10 20 30 40 50 60 70 80 90 100 Relative Humidity (%)
Percentage of total hours during survey period
closet/storage bedroom bath
Average all Moisture Troubled
House 6 bath
Relative Humidity Probability Curve - Prince Rupert Non Moisture Troubled Houses
0% 10% 20% 30% 40% 50% 60% 70% 0 10 20 30 40 50 60 70 80 90 100 Relative Humidity (%)
Percentage of total hours during survey period
bath closet/other
Average all Non Moisture Troubled
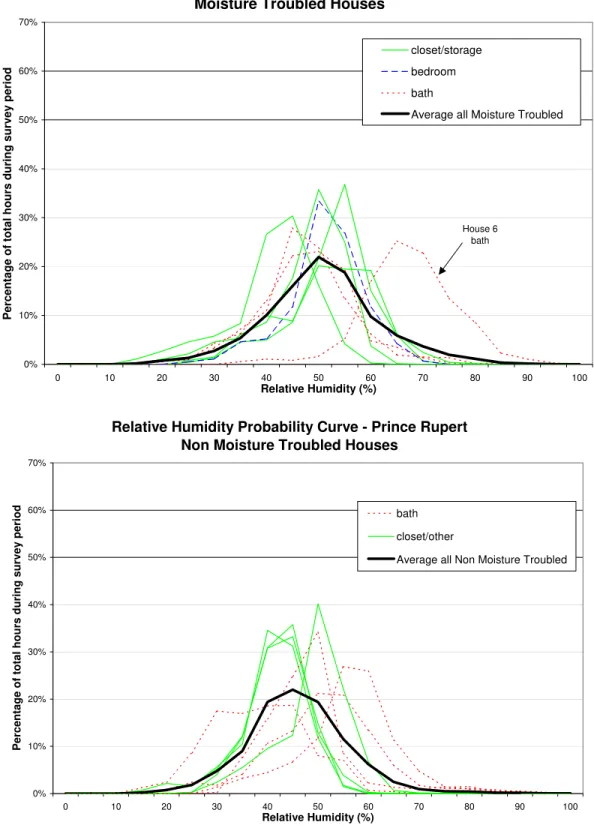
Figure 4. Distribution of indoor relative humidity measurements during the one-month survey in Prince Rupert BC. The legend on the right hand side corner of the graph provides the room where
Indoor Relative Humidity.
For the month of the survey, the average relative humidity measured in the surveyed houses ranged between 36% and 65% RH. Probabilities of occurrences for hourly measurements in each surveyed house are presented in Figure 4. Daily change in the humidity ratio in any of the houses surveyed ranged from 7 to 22 g/kg of dry air (0.0007 to 0.0022 lbw/lbda). Since bathrooms were surveyed in each house of this survey, data clearly showed that bathrooms were subjected to the largest daily increase in moisture loads, with an average of 19g/kg (0.0019 lbw/lbda). In such a northern coastal climate, the outdoor air tends to be cool and humid and the difference in humidity ratio between exterior and interior was not large, thus providing a low drying potential for ventilation air; on average the difference in humidity ratio (interior-exterior) during the survey period ranged between 0.7 and 3.3 g/kg (0.0007 to 0.0033 lbw/lbda).TABLE 3
Characteristics of House Sample- Inuvik NT
Bldg
date Bldg type Wall construction
Air leakage ACH @50 Pa [1.0 lb/ft2] EGH rating No. of occupants (day/night) Bathroom (B) /Kitchen (K) exhaust fans Sample with no reported moisture problems
No. 3 1985 2 storey
semi-detached
Vinyl siding, plywood, 38X140 (2X6), RSI 3.5 (R20) batt, 37 mm rigid insulation, poly; drywall
6.3 64 3 (0/3) Yes-K (manual operation) No. 5 1975 2 storey semi-detached Log 200-250 mm thick (8-10 in.) 10.9 60 3 (1/3) Yes-B (manual operation) No. 7 1986 2 storey semi-detached
Wood siding, sheathing membrane, 37 mm rigid insulation, plywood, 38X140 (2X6), RSI 3.5 (R20) batt, poly, drywall
12.2 58 5 (1/5) Yes-K Yes-B (manual operation) No. 8 1979 2 storey semi-detached
Wood siding, sheathing membrane, 37 mm rigid insulation, plywood, 38X140 (2X6), RSI 3.5 (R20) batt, poly, drywall
4.5 69 3 (1/3) Yes-B
(manual operation) Sample with reported moisture problems
No. 1 1977 1 storey semi-detached Vinyl siding, 37 mm rigid insulation, plywood, 38X140 (2X6), RSI 3.5 (R20) batt, poly, drywall 6.9 69 4 (2/4) Yes-K Yes-B (manual operation) No. 2 1977 2 storey detached Vinyl siding, 37 mm rigid insulation, plywood, 38X140 (2X6), RSI 3.5 (R20) batt, poly, drywall 3.6 68 5 (1/4) Yes-K Yes-B (manual operation) No. 4 1975 2 storey semi-detached
Wood siding, 37 mm rigid insulation, plywood, 38X140 (2X6), RSI 3.5 (R20) batt, poly, drywall
9.2 53 5 (5/5) Yes-B (manual operation) No. 6 1977 1 storey detached Vinyl siding, 37 mm rigid insulation, plywood, 38X140 (2X6), RSI 3.5 (R20) batt, poly, drywall
12.2 53 3 (2/3) Yes-B
(manual operation)
Inuvik Northwest Territory Survey
The sample of 8 houses was selected in collaboration with the local public housing corporation. Table 3 presents some of the house construction characteristics and the occupancy load. Heating systems consisted of a natural gas boiler with hot water radiators or a forced air heat distribution system. The houses were
built on permafrost. All houses were equipped with manually operated exhaust fans. The houses exhibited a high air leakage rate (the ACH @ 50 Pa [1.0 lb/ft2] ranged from 3.6 to 12.2) and were considered to have an expected energy performance of an upgraded old house.
Reported moisture problems included the formation of dew, frost and mould growth on windows as well as water damage under the windows. Complaints of air infiltration around junctions with elements such as windows, doors, and ducts were not uncommon. Interestingly, the investigator auditing the houses also found problems of ice build up and air leakage in the sample of houses without reported moisture problems. The number of occupants ranged from 3 to 5 persons. No house was equipped with humidifiers.
Indoor Temperature.
In general the houses surveyed operated at higher temperature (theaverage was 25.5°C [77.9°F]) than the other two surveys (Figure 5). Temperature Probability Curve - Inuvik
Moisture Troubled Houses
0% 5% 10% 15% 20% 25% 30% 35% 40% 15 16 17 18 19 20 21 22 23 24 25 26 27 28 29 30 31 32
Indoor Temperature Bin (°C)
P e rcentage of total hours duri ng survey peri od 59 59.9 60.8 61.7 62.6 63.5 64.4 65.3 66.2 67.1 68 68.9 69.8 70.7 71.6 72.5 73.4 74.3 75.2 76.1 77 77.9 78.8 79.7 80.6 81.5 82.4 83.3 84.2 85.1 86 86.9 87.8 88.7 89.6
Indoor Temperature Bin (°F)
kitchen bath
Average all Moisture Troubled
Temperature Probability Curve - Inuvik Non Moisture Troubled Houses
0% 5% 10% 15% 20% 25% 30% 35% 40% 15 16 17 18 19 20 21 22 23 24 25 26 27 28 29 30 31 32
Indoor Temperature Bin (°C)
Percentage of total
hours during survey period
59 60.8 62.6 64.4 66.2 68 69.8 71.6 73.4 75.2 77 78.8 80.6 82.4 84.2 86 87.8 89.6
Indoor Temperature Bin (°F)
kitchen bath
Average all Non Moisture Troubled
Figure 5. Distribution of indoor temperature measurements during the one-month survey in Inuvik NT. The legend in the box in the upper part of the graph provides the room where the sensor was
Indoor Relative Humidity
. For the month of the survey, the average relative humidity measured in the surveyed houses was between 9 and 29% RH. Probabilities of occurrences for the hourly measurements in each surveyed house are presented in Figure 6. The daily change in absolute air moisture content ranged from 6 to 28 g/kg (0.0006 to 0.0028 lbw/lbda). This can be related to the cold outdoor conditions during the survey period (average: -22°C [-7.6°F], min –41°C [-42°F] and max:-4°C [25°F]), the leakiness of the houses (between 3 and 12 ACH @50 Pa[1.0 lb/ft2]) and the absence of sources ofhumidification. Bathrooms and kitchen experienced short-term peaks of increased RH, near saturation for bathrooms and up to 85% in kitchens. Moisture problems included dew and frost on double glazed windows and doors as well as on the interface between exterior walls and penetrations such as vent ducts, water damage to interior finish (when frost melted) and mould growth around window frames and in bathrooms.
Relative Humidity Probability Curve - Inuvik Moisture Troubled Houses
0% 10% 20% 30% 40% 50% 60% 70% 0 10 20 30 40 50 60 70 80 90 100 Relative Humidity (%) Percent a ge of t o ta l hours duri ng survey peri od kitchen bath
Average all Moisture Troubled Houses
Relative Humidity Probability Curve - Inuvik Non Moisture Troubled Houses
0% 10% 20% 30% 40% 50% 60% 70% 0 10 20 30 40 50 60 70 80 90 100 Relative Humidity (%)
Percentage of total hours during survey
period
kitchen bath
Average all Non Moisture Troubled
Figure 6. Distribution of indoor relative humidity measurements from the one-month survey in Inuvik NT. The legend in the right-hand side corner of the graph provides the room where the sensor
Carmacks Yukon Territory Survey
The sample of 8 houses was selected in collaboration with the local public housing corporation and a First Nations community. Heating systems consisted of a central wood stove with no heat distribution system, except for the mobile home, which had an oil furnace and forced air distribution system. The houses were built on a crawl space. All houses were equipped with manually operated exhaust fans. The houses were very leaky, with air change rates @ 50 Pascals [1.0 lb/ft2] ranging from 5 to 19. The EGH energy ratings were low, particularly so considering that most of the houses were constructed less than 10 years ago. The mobile home (house No.8) was the most airtight and energy-efficient of the sample.
Reported moisture problems included the formation of frost and mould growth on the interior finish of walls and ceilings. Sources of indoor moisture included the drying of clothes indoors, keeping a pot of water on the stove (there had been a warning to boil water), and exposed earth in the crawl space at the location of the fresh air intake for the wood stove. The number of occupants ranged from 2 to 6 persons. Table 4 presents some of the house construction characteristics and the occupancy load.
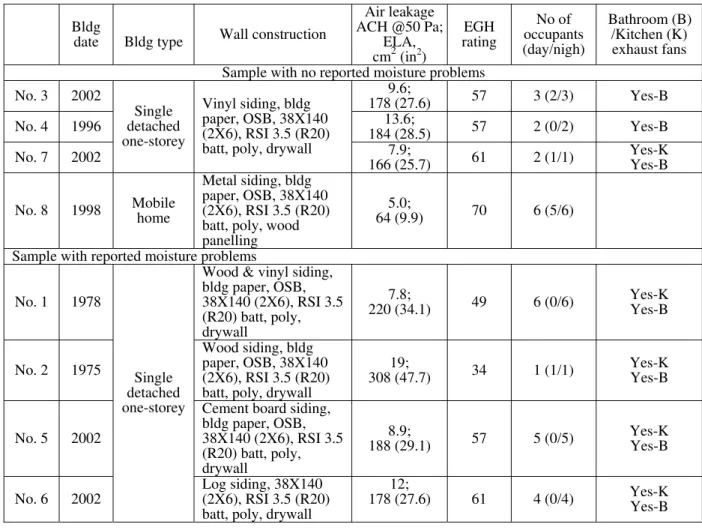
TABLE 4
Characteristics of House Sample- Carmacks Yukon
Bldg
date Bldg type Wall construction
Air leakage ACH @50 Pa; ELA, cm2 (in2) EGH rating No of occupants (day/nigh) Bathroom (B) /Kitchen (K) exhaust fans Sample with no reported moisture problems
No. 3 2002 178 (27.6) 9.6; 57 3 (2/3) Yes-B No. 4 1996 13.6; 184 (28.5) 57 2 (0/2) Yes-B No. 7 2002 Single detached one-storey Vinyl siding, bldg paper, OSB, 38X140 (2X6), RSI 3.5 (R20)
batt, poly, drywall 7.9;
166 (25.7) 61 2 (1/1) Yes-K Yes-B No. 8 1998 Mobile home Metal siding, bldg paper, OSB, 38X140 (2X6), RSI 3.5 (R20) batt, poly, wood panelling
5.0;
64 (9.9) 70 6 (5/6)
Sample with reported moisture problems
No. 1 1978
Wood & vinyl siding, bldg paper, OSB, 38X140 (2X6), RSI 3.5 (R20) batt, poly, drywall 7.8; 220 (34.1) 49 6 (0/6) Yes-K Yes-B No. 2 1975 Wood siding, bldg paper, OSB, 38X140 (2X6), RSI 3.5 (R20) batt, poly, drywall
19;
308 (47.7) 34 1 (1/1)
Yes-K Yes-B
No. 5 2002
Cement board siding, bldg paper, OSB, 38X140 (2X6), RSI 3.5 (R20) batt, poly, drywall 8.9; 188 (29.1) 57 5 (0/5) Yes-K Yes-B No. 6 2002 Single detached one-storey Log siding, 38X140 (2X6), RSI 3.5 (R20) batt, poly, drywall
12;
178 (27.6) 61 4 (0/4) Yes-K
Yes-B
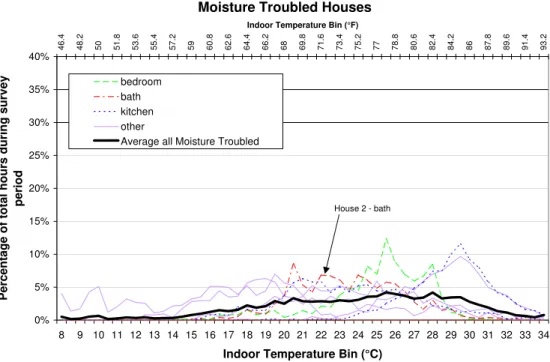
Indoor Temperature.
The surveyed houses in Carmacks differ significantly from the other twosurveys, in that most of the houses were heated with a central wood-stove, without a heat distribution system - reportedly a decision of the occupants in this First Nations community. This resulted in very large temperature fluctuations in the houses and between rooms - depending on their location in relation to the proximity of the heat source (Figure 7). The spread of daily average temperature for all houses was from 8 to 34ºC (46 to 93°F). Kitchens were maintained at a higher temperature than the other rooms (i.e. living
rooms and bedrooms). In some cases, 3-minute temperature measurements clearly showed a pattern where the occupant would stoke up the wood stove in the morning and re-stoke it in late afternoon (Figure 8). The only house with a heat distribution system and a furnace (house no. 8) experienced tighter temperature control between 17-23ºC (63-73°F) in the two rooms surveyed (kitchen and living room).
Temperature Probability Curve - Carmacks Moisture Troubled Houses
0% 5% 10% 15% 20% 25% 30% 35% 40% 8 9 10 11 12 13 14 15 16 17 18 19 20 21 22 23 24 25 26 27 28 29 30 31 32 33 34
Indoor Temperature Bin (°C)
Percentage of tota
l hours during survey
pe
ri
od
46.4 48.2 50 51.8 53.6 55.4 57.2 59 60.8 62.6 64.4 66.2 68 69.8 71.6 73.4 75.2 77 78.8 80.6 82.4 84.2 86 87.8 89.6 91.4 93.2
Indoor Temperature Bin (°F)
bedroom bath kitchen other
Average all Moisture Troubled
House 2 - bath
Temperature Probability Curve - Carmacks Non Moisture Troubled Houses
0% 5% 10% 15% 20% 25% 30% 35% 40% 8 9 10 11 12 13 14 15 16 17 18 19 20 21 22 23 24 25 26 27 28 29 30 31 32 33 34
Indoor Temperature Bin (°C)
Percentage of total hours during survey
period
46.4 48.2 50 51.8 53.6 55.4 57.2 59 60.8 62.6 64.4 66.2 68 69.8 71.6 73.4 75.2 77 78.8 80.6 82.4 84.2 86 87.8 89.6 91.4 93.2
Indoor Temperature Bin (°F)
bedroom kitchen other
Average all Non Moisture Troubled
House 8 - kitchen
House 8 - living room
Figure 7. Distribution of indoor temperature measurements for the month of the survey in Carmacks Yukon. The legend on the left hand side corner of the graph provides the room where the sensor was
Carmacks House No.2 - Indoor Temperature and Humidity January 29, 2006 0 5 10 15 20 25 30 35 40 0:00 2:00 4:00 6:00 8:00 10:00 12:00 14:00 16:00 18:00 20:00 22:00 0:00 Time Temperature, °C [°F] 0 5 10 15 20 25 30 35 40 Humidity (%) Indoor Temperature Indoor Humidity [104] [86] [95] [77] [68] [59] [50] [41] [32]
Figure 8. Indoor temperature fluctuations over a 24-hour period in January 2006 in living room of house No. 2 (with moisture problems) occupied by one person.
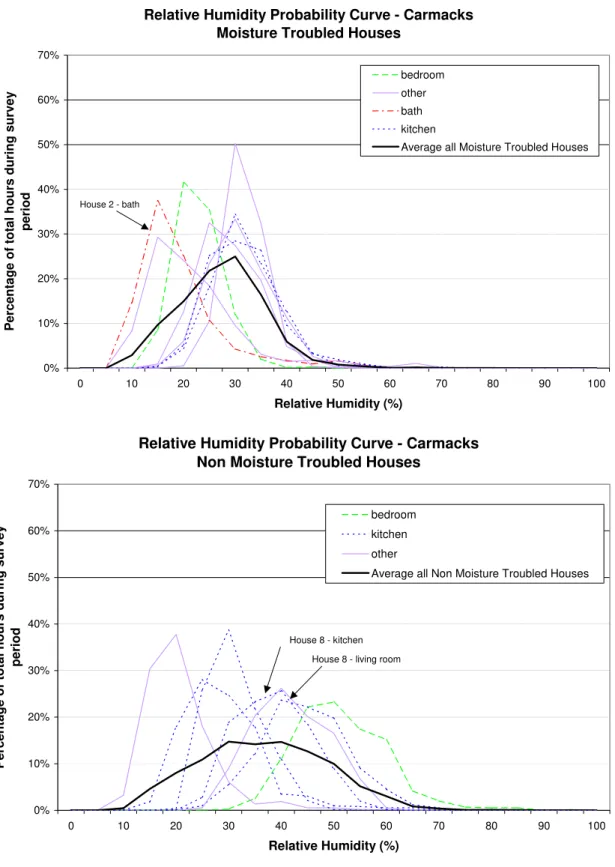
Indoor Relative Humidity
. For the month of the survey the average relative humiditymeasured in the surveyed Carmacks YT houses was between 17% and 49% RH. Daily RH averages are plotted in Figure 9. Because indoor temperature fluctuated greatly as well, absolute moisture content in air (g/kg [lbw/lbda]) provided data on the daily changes in indoor moisture. The probability distribution curves are presented in Figure 9. The maximum fluctuation occurred in the only bathroom surveyed, in house No. 2 (Figure 10). Even though the houses were originally classified as with and without moisture problems, it became clear during the survey that most households experienced some forms of moisture problems. In many cases, the occupants regularly cleaned mould growth on the wall interior surfaces and consequently the houses were not reported as having moisture problems. Poor heat distribution and associated large temperature fluctuations combined with moisture generating activities, such as drying clothes indoors and boiling water for prolonged periods, and with poor envelope performance could have resulted in moisture problems apparent on the inside facing of the envelope of these houses in the form of moulds, frost and water damage. The occupancy load showed no direct link to the magnitude of the moisture problems. All houses were equipped with manually-operated exhaust fans in bathrooms and most had one such fan in the kitchen as well.
Relative Humidity Probability Curve - Carmacks Moisture Troubled Houses
0% 10% 20% 30% 40% 50% 60% 70% 0 10 20 30 40 50 60 70 80 90 100 Relative Humidity (%)
Percentage of total hours during survey
period
bedroom other bath kitchen
Average all Moisture Troubled Houses
House 2 - bath
Relative Humidity Probability Curve - Carmacks Non Moisture Troubled Houses
0% 10% 20% 30% 40% 50% 60% 70% 0 10 20 30 40 50 60 70 80 90 100 Relative Humidity (%) Per cent a ge of t o ta l hour s dur ing sur vey period bedroom kitchen other
Average all Non Moisture Troubled Houses
House 8 - living room House 8 - kitchen
Figure 9. Distribution of indoor relative humidity measurements from the Carmacks Yukon survey. The legend on the right hand side corner of the graph provides the room where the sensor was
Figure 10. Daily average, minimum and maximum indoor RH measurements in Bathroom of House no. 2 in the Carmacks Yukon survey
DISCUSSION AND SUMMARY
Figure 11 provides a comparison of the probability of measured indoor temperature and relative humidity for the three surveys.
Interestingly the surveys showed that in each house, short-term peaks of high relative humidity regularly occurred in what the authors call ‘wet rooms’ where cooking and showering took place. The average relative humidity in the room could be low (below 30%) in a very cold climate in the middle of winter or higher (about 60%) in spring in a coastal climate, but these houses all experienced daily short-term peaks of RH well above the average indoor RH in the homes. Bathroom peaks approached 100% RH (for less than 30 minutes) and these events are assumed to be associated with shower taking. Kitchens also experience short-term RH peaks of a lesser magnitude. Monitoring in other rooms (bedrooms, doorless closets, hallways) indicated more stable and lower RH conditions. This raises the question whether the repetitive nature of such multiple short-term extreme events contribute to premature deterioration of the exterior envelope as well as the onset of mould growth in localized cooler areas of the building envelope more often below the dew point.
General information in layman literature (e.g. for homeowners) tends to point to high relative humidity in the home as the cause of moisture problems and mould growth. The survey findings - even though for a small sample - show that this is not necessarily the case and that several factors other than these two can play a significant and possibly overriding role.
• The Carmacks YT surveyed houses experienced atypically poor temperature control indoors (Figure 11) due to the absence of a heat distribution system compounded by high air leakage rates through the building envelope. Average RH values in these houses were not considered excessively high (mostly below 40%) and occupancy loads were not extreme; however problems of mould growth and condensation were common. It is not surprising that these houses experienced moisture problems
considering the lack of heat delivery at the perimeter of the house, away from the only heat source, the wood stove. The cold exterior walls can act as a condensing surface, even when indoor RH was less than 30%.
• The surveyed houses in Inuvik NT– the coldest climate of the 3 survey sites - experienced the lowest RH indoors. No form of humidification was in place and the houses tended to be drafty. Outside air was quite cold during the survey period and air infiltration would have a drying effect on the interior environment. Typical moisture problems were reported as cold air infiltration, frost on interior finishes and water damage on interior finishes near thermally weak building envelope elements (e.g. double glazed windows, floor/wall junctions). Mould growth on interior surfaces was not reported. • In the Prince Rupert BC and Inuvik NT surveys, houses with moisture problems did not necessarily
experience higher relative humidity indoors than the houses without moisture problems.
• The surface temperature of materials depends upon the thermal and air leakage characteristics of the envelope as well as the interior heat distribution system performance. For instance, several houses with moisture problems in Inuvik experienced relatively low average RH; they also experienced cold air infiltration that likely cooled off the interior wall layers allowing frost and water damage to occur.
Figure 11. Distribution curves for the hourly average indoor temperature and relative humidity measured in 2 rooms of 8 homes in three regions during the one-month survey.
In these surveys, a higher occupancy load (defined simply by the number of occupants during the day and at night) did not translate into either higher relative humidity indoors or higher occurrence of moisture problems.
• In the Prince Rupert BC survey the house with 8 occupants (4 during the day and 8 at night) did not have moisture problems with an average RH of 48%, while a house with 3 persons (1 during the day and 3 at night) experienced on average 65%RH and some mould growth.
• In Carmacks YT survey, the House No.8 with the higher number of occupants (with 5 persons during the day and 6 at night) ended up being the house with little moisture problems while all others (including houses with one or two occupants) reported some moisture problems.
• In Inuvik NT, most houses had similar levels of occupancy (1 to 5 persons) and some experienced moisture problems, others did not.
Occupants’ behaviour can also have an impact on the occurrence and perception - or lack thereof - of moisture problems.
• In the Carmacks YT survey, the auditor found out that in fact most houses experienced some degree of moisture problems. Depending on the occupants’ approach in dealing with the problems, they were not necessarily reported. For instance the occupants who cleaned moulds off the walls on a regular basis (i.e. weekly) were initially believed to represent a sample of houses without moisture problems, until their cleaning habits were identified by the consultant.
• Both houses with and without moisture problems were equipped with manually-operated exhaust fans in bathrooms and/or kitchens. However, no information was collected on the occupants’ habits of using these fans. Anecdotal information from some of the Housing Corporations indicate that occupants find these noisy or a source of cold draughts and these are not used effectively. One housing corporation invested in the installation of humidistat-controlled fans for bathrooms of homes where everything else had failed to get rid of mould growth problems.
CONCLUSIONS
• The study demonstrates that for moisture problems to occur, RH and T averages over time do not tell the whole story. Wet rooms can be subjected to repetitive short-term peaks of near saturation RH and temperature can fluctuate as well, depending on several possible factors such as non-uniform heat delivery.
• For the development of the experimental protocol for the evaluation of promising wall assemblies, the project team is considering mimicking the trends of extreme indoor climates observed in the surveys. The technical feasibility of implementing these swings effectively in a laboratory setting in a
controlled environmental chamber capable of simulating wind pressure, rain, temperature difference, vapour pressure differences and solar radiation effects is currently being investigated.
• Considering the lack of field measurements of indoor RH and T in homes in northern communities, more field surveys of similar nature as those described here will be a useful contribution for the benchmarking of models and for the design of experimental studies. The authors are aiming at carrying out similar surveys of indoor conditions and house characterization in other northern regions in the near future.
ACKNOWLEDGEMENTS
The authors wish to acknowledge the following partners and collaborators in this project: Canada Mortgage and Housing Corporation, Natural Resources Canada, the Program of Energy Research and Development (PERD), The Sheltair Group, Arctic Energy Alliance, Prince Rupert Housing Corporation, the Yukon Housing Corporation and the Inuvik Housing Corporation.
REFERENCES
Cornick, S.M. 2005. PERD 079 B-1239 Report 3 Report on Task 3: Extreme Canadian Climates – Northern and Coastal. Ottawa: NRCC.
Kent A.D., G.O. Handegord and D.R. Robson. 1967. A Study of Humidity Variations in Canadian Houses.
ASHRAE Transactions, 72, (2), pp. II.1.1 - II.1.8, Atlanta: American Society of Heating,
Refrigerating, and Air-Conditioning Engineers Inc.
Rousseau, M., M.M. Manning, M.N. Said, S.M.Cornick and M.C. Swinton. 2007. PERD 079 B-1239 Report 1 Report on Task 1: Surveys of Relative Humidity and Temperature Conditions in Houses in Extreme Climate. Ottawa: NRCC.
Said, M.S. 2006. PERD 079 B-1239 Report 2 Report on Task 2: Literature Review -Building Envelope, Heating and Ventilating Practices and Technologies for Extreme Climate. Ottawa: NRCC.