1
Augmented Reality Navigation System for Human
Traversal of Rough Terrain
by
Nicholas J. Anastas
B.S. Computer Science, University of Illinois at Urbana-Champaign
(2009)
Submitted to the Department of Aeronautics and Astronautics in partial
fulfillment of the requirements for the degree of
Master of Science in Aeronautics and Astronautics
at the
MASSACHUSETTS INSTITUTE OF TECHNOLOGY
September 2020
© Massachusetts Institute of Technology 2020. All rights reserved.
Author . . .
Department of Aeronautics and Astronautics
August 18, 2020
Certified by. . .
Jeffrey A. Hoffman
Professor of the Practice of Aeronautics and Astronautics
Thesis Supervisor
Accepted by . . .
Zoltan Spakovszky
Professor, Aeronautics and Astronautics
Chair, Graduate Program Committee
2
Augmented Reality Navigation System for Human Traversal
of Rough Terrain
by
Nicholas J. Anastas
Submitted to the Department of Aeronautics and Astronautics on August 18, 2020, in Partial Fulfillment of the
Requirements for the Degree of
Master of Science in Aeronautics and Astronautics
Abstract
At some point in the near future, astronauts will resume the decades dormant practice of planetary EVA. Because of the resource scarcity of extra-terrestrial environments, finding and following efficient paths during EVA will be essential to mission success. MIT’s Surface Exploration Traverse Analysis and Navigational Tool (SEXTANT) was created specifically to satisfy this path efficiency need. Prior to this work, SEXTANT was used exclusively during the planning phase of a mission. Results from several field studies found that SEXTANT’s path planning capabilites could be useful during the execution phase of a mission as well; information gathered during a traverse would sometimes necessitate that an existing path be recalculated. Because of its long algorithm runtime and stateless nature, however, the previous
implementation of SEXTANT was unable to support this capability.
This work details the software optimizations and architectural modifications made to SEXTANT in order to accommodate real-time, mid-traverse path recalculations based on terrain information updates supplied by a user. Additionally, this work discusses the creation of Pathfinder: an augmented reality tool that interfaces with SEXTANT to provide path following, terrain modification, and path recalculation capabilities. Pathfinder implements three different path visualizations, each of which is evaluated on how it affects traverse performance. Furthermore, Pathfinder implements two different interfaces that allow users to modify terrain information and to recalculate existings paths based on those modifications. These interfaces are compared and used to evaluate the effect mid-traverse path recalculation has on traverse performance.
3
Acknowledgements
I am a man of many talents. Or at least of several talents. Certainly more than a few.
Unfortunately – for me, and also for the other souls who have witnessed or been a part of my journey – composing a Master’s thesis is not one of them.
It has taken the combined effort of my advisors, my friends, my classmates, and my family to assemble this jumble of words into an order that hopefully resembles something meaningful. Regardless, after only a bit of pushing, some pulling, the occasional forceful urging, a great many judgmental stares, a healthy portion of love and kindness, and a stream of unending support, I am finally finished.
Some thanks are in order.
Tristan Endsley: Well, we did it. I don’t know if you taught this old dog any new tricks, but we finally got those words on pages. Thanks so much for always being supportive and for
encouraging me to find a thesis topic that was ‘my own’, never forcing me down some path that you didn’t think I would enjoy. For the record, I would’ve been okay with a little more forcing. I don’t know how many times I forgot lessons you taught me or advice that you gave, but I
appreciate that you were always so positive when you inevitably had to teach and give them again. I’m not sure whether or not all of those whiteboarding sessions improved my thesis, but they sure did make me feel better.
Jeff Hoffman: Thank you for taking a chance on me three years ago. I had no research
experience and had been out of school long enough to forget nearly all of my calculus (which only takes about 6 months anyways), but for some reason you decided to take me in and advise me. In retrospect, it certainly would have been nice to have some of that missing research experience. Thanks for all of the advice you’ve offered me, and for being patient as I meandered around a research topic. Particularly, thanks for telling me that I’d done a good job after you’d used Pathfinder for the first time. That meant a lot.
Mort: Thank you for keeping things in perspective. Sometimes snuggles really are all you need. Nathan: Though evidence from family videos may indicate otherwise, I have always felt like you were a good friend. Even though I was the annoying little brother, you never seemed to have a problem with me hanging around. And then as we got older, you never seemed to have a
problem with me stealing all of your ideas. If Earth’s Fate taught us anything, it’s that I have no problem with a little plagiarism. Almost all of my hobbies and interests can be traced back to you (except maybe biking, you really do seem to hate that) – so thanks for picking some good ones. It could be argued that your love of Star Wars has had more influence on the course of my life than any other single thing. Thanks for being a great and inspiring older brother.
Kristen: Thanks for putting up with all of the times where I lamented the work I had to do, then proceeded to not do that work. Thanks for always being around to talk me off the ledge when I was really uncertain or confused about the choices I’d made. I know I can be stubborn, and I
4
know I don’t always listen as well as I should, but I’m so glad that we’ve been together these past few years. All of the meals we’ve cooked together, runs we’ve gone on, games we’ve played, trips we’ve taken, shows we’ve watched – all of these things have kept me sane and even happy. I’m really looking forward to whatever adventure next awaits us.
Mom: Thanks for teaming up with dad to give Nathan and I the best childhood any two boys could ever hope for. The lowest low my kid-self experienced was probably that pile of birthday donuts – but even that is a retrospective, comedic low. I remember actually loving that doughy pyramid (and the bowling that went along with it). If that’s as bad as it ever got, you guys must’ve done something right. I don’t recall a time where you weren’t supportive of whatever I was doing with myself, and I really appreciate that. I’ve never felt confused or ashamed about any aspect of myself – you and dad really did just let me grow into whatever person I thought was best. Or maybe you did some behind-the-scenes marionetting and I just didn’t realize. If that’s the case, don’t let me know – leave me to my happy ignorance. In any case, I’m looking forward to all the future adventures that you, Nathan, Ashley, Kristen, and I are going to enjoy together.
DAD: I am thankful for everything you ever did with me and for me. The bike rides, the
coaching, the wrestling “matches” where you would use just one finger, the campouts, the semi-weekly drives to Children’s Hospital, the never-ending (as is tradition) games of Axis & Allies, the Frisbee tossing with throws that you “invented”, the sessions of Goldeneye where you would camp on the body armor, the vacations, the zero times I ever beat you at racquetball, the shoulder rides… all of it. You always set an excellent example, and even now when I’m confused I’ll try to think about what action you would take and just go with that. I don’t always succeed, but I do try. Everything you did made me into the person I am today, and I hope that that person made you proud. Even through our disagreements, I always respected your mind and your ability to consider the positions of others. Your work ethic, your focus, your commitment to bettering those around you – they will all forever be an inspiration. I’ll do my best to fill those shoes.
5
Contents
1. Introduction ... 14 1.1 Motivation ... 14 1.2 Thesis Contributions ... 15 2. Background ... 16 2.1 History of SEXTANT ... 16 2.2 Augmented Reality ... 19 2.2.1 Definition ... 19 2.2.2 Historical Implementations ... 21 2.2.3 Current Uses... 24 2.2.4 Modes of Interaction ... 302.2.5 Advantages & Drawbacks of Augmented Reality ... 35
2.3 Extravehicular Activity (EVA) ... 36
2.3.1 Definition ... 36
2.3.2 EVA Roles ... 37
2.3.3 Communication during EVA ... 37
2.3.4 Planetary EVA ... 38 3. Technical Design ... 45 3.1 Overview ... 45 3.2 SEXTANT ... 46 3.2.1 Existing Codebase ... 46 3.2.2 Upgrade to Python 3 ... 48
6
3.2.4 Manual Adding and Removing of Obstacles ... 53
3.2.5 Persisting Terrain and Path State ... 53
3.2.6 Conversion to Client-Server Model with TCP Socket IPC ... 53
3.3 Pathfinder ... 54 3.3.1 Overview ... 54 3.3.2 Terrain ... 55 3.3.3 Controls ... 56 3.3.4 Path-Following Visualizations ... 57 3.3.5 Obstacle-Editing Interfaces ... 62 3.3.6 Testing... 64 4. Hypotheses... 66 4.1 Gaps ... 66 4.2 Research Questions ... 66 4.3 Hypotheses ... 67 5. Methods ... 71 5.1 COVID-19 ... 71 5.2 Objective ... 71 5.3 Hardware ... 71 5.4 Independent Variables ... 72 5.4.1 Path-Following ... 72 5.4.2 Obstacle-Editing ... 73 5.5 Dependent Variables ... 75 5.5.1 Path-Following ... 75 5.5.2 Obstacle-Editing ... 76 5.6 Data Collected ... 77
7 5.7 Subject Instructions ... 78 5.8 Participants ... 81 6. Results ... 82 6.1 Path-Following ... 82 6.1.1 Traverse Time ... 82 6.1.2 Traverse Efficiency ... 84 6.1.3 Situational Awareness ... 86 6.1.4 Workload... 87 6.1.5 Usability ... 89 6.2 Obstacle-Editing ... 90 6.2.1 Traverse Time ... 91 6.2.2 Obstacle-Editing Time ... 92 6.2.3 Traverse Efficiency ... 93 6.2.4 Obstacle-Painting Accuracy... 94 6.2.5 Workload... 96 6.2.6 Usability ... 97 7. Discussion ... 99 8. Conclusion ... 106 8.1 Future Work ... 107 9. References ... 108 10. Appendices ... 113 A. List of Abbreviations ... 113
B. How to Install / Use Current Sextant ... 114
B.1. Repository Location ... 114
8
B.3. Installation Instructions ... 114
C. Subject Documents ... 118
C.1. Demographic Information Survey ... 118
C.2. Subject Safety Protocol ... 119
C.3. Post Test Survey ... 120
C.4. NASA Task Load Index (TLX) ... 120
9
Table of Figures
Figure 2.1: Difference between active (left) and passive (right) automation (Marquez, 2007) ... 17
Figure 2.2: xGDS interface, with SEXTANT-created path in orange (Norheim et al., 2018) ... 18
Figure 2.3: Subject navigating with Holo-SEXTANT (application on headset) during the BASALT-2 field study (Norheim et al., 2018) ... 19
Figure 2.4: Simplified representation of the "Virtuality Continuum" (Milgram & Kishino, 1994) ... 20
Figure 2.5: Sword of Damocles (Sutherland, 1968) ... 21
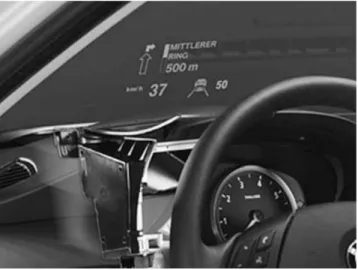
Figure 2.6: ‘Optical See-Through’ AR display on the windshield of a car (Narzt et al., 2005) ... 22
Figure 2.7: 'Video See-Through’ AR display used for navigation (Narzt et al., 2005) ... 23
Figure 2.8: Pictorial representations of VST (Left) and OST (Right) AR (Wolfenstetter, 2007) 23 Figure 2.9: Microsoft Hololens worn by a user (from Microsoft.com) ... 24
Figure 2.10: Screenshots from Holo-SEXTANT (Anandapadmanaban et al., 2018) ... 25
Figure 2.11: APC turret maintenance AR HMD hardware (left) and user interface (right) (Henderson & Feiner, 2011) ... 26
Figure 2.12: Ponce and Menendez experimental setup ... 27
Figure 2.13: Marisil Mobile User Interface Framework (Krevelen & Poelman, 2010) ... 32
Figure 2.14: Magic Leap Hand Controller (magicleap.com) ... 34
Figure 2.15: (Left) Diagram of the Apollo Remote Control Unit (Jones, 1995) ... 38
Figure 2.16: (Right) EMU Display and Control Module (NASA) ... 38
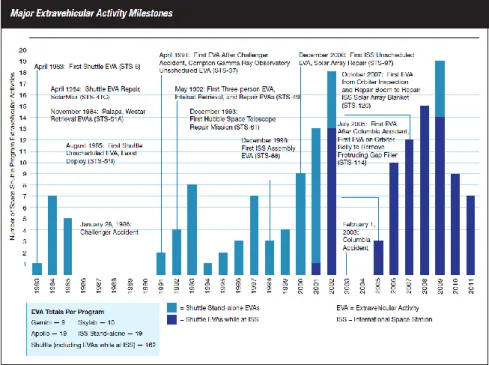
Figure 2.17: Major EVA Milestones and Counts, by Year (Patrick, Kosmo, Locke, Trevino, & Trevino, 2010)... 39
10
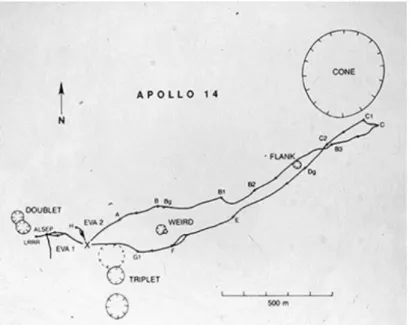
Figure 2.18: Planned Route for EVA-2 in Apollo 14 (Johnson et al., 2010)... 40
Figure 2.19: Example (in yellow) of BASALT-planned traverse (K. H. Beaton et al., 2017) ... 43
Figure 3.1: Mercator projection of Earth between 85°S and 85°N (D. R. Strebe, 2011) ... 46
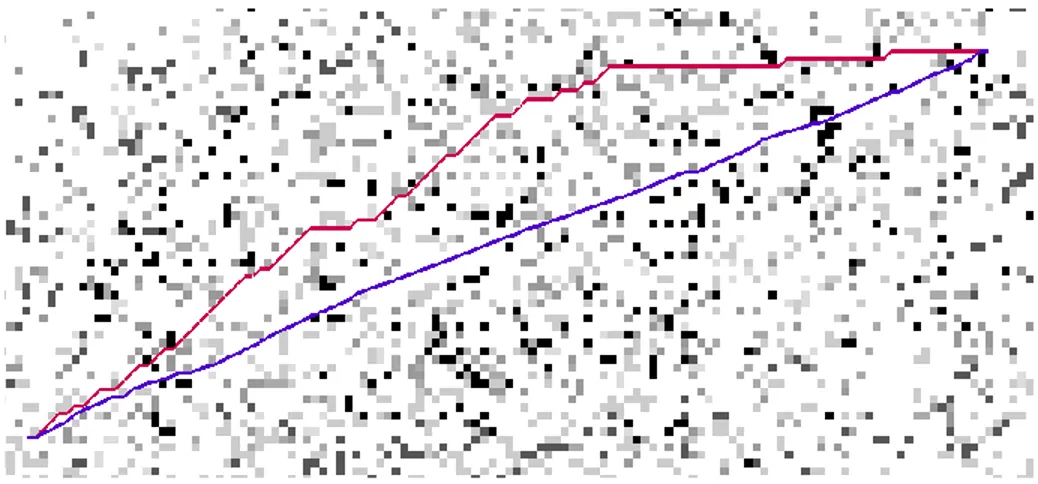
Figure 3.2: Paths produced by D* (red) and Field D* (purple) ... 51
Figure 3.3: Screenshot from the Pathfinder application. Major elements of the user interface are called out with green arrows and text labels. ... 55
Figure 3.4: Terrain as drawn by Pathfinder. Brown regions are those deemed by the SEXTANT server to be passable, while red regions are impassable obstacles. ... 56
Figure 3.5: Virtual thumbstick used to affect the position of the user in Pathfinder ... 56
Figure 3.6: The Pathfinder-recommended way for a user to move their body in order to change the orientation of the tablet and in turn affect the virtual viewing direction. Changes in yaw are achieved by rotating in place, while pitch changes are achieved by tilting the arms up and down. ... 57
Figure 3.7: Pathfinder's line visualization. Line segments connect every point in the path. ... 58
Figure 3.8: Waypoint icon used in Pathfinder ... 59
Figure 3.9: Illustration of the ‘equidistant’ method of waypoint placement. The distance traced by each of the yellow lines is approximately equal. ... 60
Figure 3.10: Illustration of the ‘clear path’ method of waypoint placement. The lines between the user and next waypoint (dashed white line) and those connecting subsequent waypoints do not pass through an impassable region. ... 60
Figure 3.11: Pathfinder's Compass widget, which can optionally be enabled when using a waypoint visualization. Cardinal directions and waypoints both appear on the compass. ... 61
11
Figure 3.12: The offscreen waypoint indicator appears whenever the next waypoint falls outside of the current viewing area; it points in whatever direction the user must turn in order to see the waypoint. ... 61 Figure 3.13: Pathfinder's minimap, which shows a top-down view of the user's current location. ... 62 Figure 3.14: A region of unmarked obstacles. A bump map was applied to the mesh to make it appear visually distinct from normal terrain. ... 63 Figure 3.15: (Left) Brush tool used to add and remove obstacles from terrain. ... 63 Figure 3.16: (Right) Interface element in Pathfinder’s heads up display used to active, deactivate, and interact with obstacle-editing brush. ... 63 Figure 3.17: Enlarged state of the minimap. When the map mode of editing obstacles is active, users can paint obstacles by dragging their finger over the desired section of terrain in the
minimap. ... 64 Figure 3.18: A target of opportunity as displayed by Pathfinder. During path-following trials, subjects were instructed to maintain a mental count of the number of nearby TOPs. ... 65 Figure 3.19: A tutorial dialogue, this one intended to teach users about Pathfinder’s waypoint visualizations... 65 Figure 5.1: (Left) Surface Go tablet used to run SEXTANT and Pathfinder. The blue cable connects the tablet to the RealSense T265 motion tracking camera mounted on the back. ... 72 Figure 5.2: (Right) The RealSense T265 mounted with a hook-and-loop fastener to the back of the Surface Go tablet. ... 72 Figure 5.3: The first (left), second (middle), and third (right) path routes used during the path-following experiment. ... 73
12
Figure 5.4: The first (left), second (middle), and third (right) path routes used during the
obstacle-editing experiment. ... 74
Figure 6.1: Box-plot of path visualization vs. traverse time ... 83
Figure 6.2: Box-plot of path route vs. traverse time ... 84
Figure 6.3: Box-plot of trial order vs. traverse time ... 84
Figure 6.4: Box-plot of path visualization vs. traverse efficiency ... 85
Figure 6.5: Box-plot of path route vs. traverse efficiency ... 86
Figure 6.6: Box-plot of trial order vs. traverse efficiency ... 86
Figure 6.7: Screenshots taken during a path-following trial. Note the 1:1 aspect ratio and the large regions of the viewing area that have been 'cut-off' along the sides of the images. ... 87
Figure 6.8: Box-plot of path visualization vs. RTLX score ... 88
Figure 6.9: Box-plot of path visualization vs. TLX subscores ... 89
Figure 6.10: Box-plot of path visualization vs. SUS usability score ... 90
Figure 6.11: Box-plot of obstacle-editing interface vs. traverse time ... 92
Figure 6.12: Box-plot of obstacle-editing interface vs. obstacle-editing time ... 93
Figure 6.13: Box-plot of obstacle-editing interface vs. traverse efficiency ... 94
Figure 6.14: Box plot of obstacle-editing interface vs. obstacle-painting accuracy ... 95
Figure 6.15: Box-plot of obstacle-editing interface vs. RTLX score ... 96
Figure 6.16: Box-plot of obstacle-editing interface vs. TLX subscores ... 97
Figure 6.17: Box plot of obstacle-editing interface vs. SUS usability score ... 98
Figure 7.1: Example of two A* optimal length paths (orange and blue) that have different shapes ... 99
13
Figure 7.2: Sections of the three path routes that have users traverse through regions densely populated by obstacles. (Left) path route 1; (Middle) path route 2; (Right) path route 3. ... 100 Figure 7.3: Button used to deactivate the obstacle-editing tool. ... 104
14
1. Introduction
1.1 Motivation
In the near future, the National Aeronautics and Space Administration (NASA) plans to send astronauts first back to the surface of the Moon and then for the first time to the surface of Mars (ISECG, 2018). One of NASA’s mission priorities while exploring these foreign planetary bodies will be to perform a series of extravehicular activities (EVAs). During these EVAs, astronauts will be tasked with visiting a set of sites that have some either logistical or scientific value (Lim, Abercromby, & Kobs Nowatniak, 2019). Because it is likely that no person will have ever visited these sites, the ‘ideal’ human-traversable path connecting them will need to be found. Traverse routes will be planned using some combination of remote sensing data and data collected by robotic explorers (e.g. rovers, drones) during a pre-mission site survey (Kara H. Beaton et al., 2019). SEXTANT – a tool developed at MIT – was designed specifically to accomplish this task; that is, to use precursor data to find a least cost path connecting a series of geographic locations (Johnson, Hoffman, Newman, Mazarico, & Zuber, 2010). In the context of SEXTANT, the ‘cost’ of a path is a complex parameter that is influenced by many variables (e.g. gradient, sun angle) and that actually has several different definitions (e.g. metabolic cost, time cost) (Marquez, 2007). For the purposes of the present discussion, understanding the precise cost formula is not necessary; knowing simply that cost is a value that should be minimized is
sufficent.
In past studies, SEXTANT was shown to perform its path-finding task quite well (Norheim, Hoffman, Supervisor, & Balakrishnan, 2018). However, because of long algorithm runtimes and an architecture that discarded all terrain information after a route had been calculated,
SEXTANT’s path-finding capabilites had only been used durring the planning phase of a mission. Since more accurate terrain data often becomes available when actually walking an EVA route, there was a desire to upgrade SEXTANT to accommodate in situ, real-time terrain updates and path re-planning. EV crewmembers equipped with a version of SEXTANT with these upgrades could avoid incurring unplanned metabolic or time costs by quickly marking and
15
routing around a previously unknown problem area. A tool that allows the EV crew to
dynamically re-route from their current location provides the additional benefit of helping the EV crew navigate back to a designated station should they be required to stray from the recommended path (for either science or safety reasons).
Prior to this work, three different display modes have been implemented and tested for use with SEXTANT-created paths: a ‘hard copy’ printed paper map, a wrist-mounted screen displaying an aerial view of the path, and an augmented reality display that presents the path as an overlay on the actual terrain (Anandapadmanaban, Tannady, Norheim, Newman, & Hoffman, 2018). All display modes had useful qualities, though no single mode was without fault. Furthermore, none of the previously-tested display modes allowed for real-time path re-calculation.
1.2 Thesis Contributions
The goal of the research presented here is two-fold:
Firstly, we have augmented and altered SEXTANT to allow for mid-traverse obstacle demarcation and path re-planning.
Secondly, we have developed and evaluated a new set of augmented reality user interface implementations that accommodate both path-following and real-time path re-planning.
16
2. Background
2.1 History of SEXTANT
Real-time route planning and re-planning is a robust and well-researched field. At the time of this writing, much of the literature is dedicated to route planning of autonomous vehicles either on city streets (e.g. for self-driving cars) or for unmanned flying vehicles (e.g. drones). In
addition, much work has gone into route planning for virtual environments (e.g. video games). A review of relevant literature shows, however, that relatively little work has gone into the real time calculation of an optimal route or traversal path for human explorers in rugged terrain. As far back as 2003, researchers at MIT identified this knowledge gap – specifically in the context of future human planetary EVA – and started work on what would eventually become
SEXTANT (Carr, Newman, & Hodges, 2003).
The software that is today known as SEXTANT began its life under a different name: The Geologic Traverse Planner. Created by Carr and Newman in 2003, this tool was designed to evaluate – exclusively – the acceptability of a planned traverse. The exclusivity distinction is made in order to emphasize that The Geologic Traverse Planner (oddly) performed none of the actual planning work; that work was handled entirely by a human user. The tool would take as input a user-generated traverse and – using information from digital elevation models (DEMs), landmark maps, and other data sources – calculate the metabolic cost and overall feasibility of that traverse. Though the tool was found to increase the apparent quality of a planned traverse (specifically when compared with the actual Cone Crater EVA traverse from Apollo 14), Carr and Newman noted that the user interface of the tool was cumbersome and would benefit greatly from a more user-oriented redesign.
With the partial aim of creating a more user friendly version of The Geologic traverse Planner, Marquez as part of her PhD work created the Planetary Aid for Traversing Humans (PATH) tool (Marquez, 2007). The PATH tool had two primary modes of traverse planning, which Marquez designated as ‘passive automation’ and ‘active automation’. Pictorial representations of the outputs of the two modes is shown below in Figure 2.1.
17
Figure 2.1: Difference between active (left) and passive (right) automation (Marquez, 2007)
In passive automation mode, PATH functioned very much like its predecessor; that is, the human user acted as the primary path planner. In order to elevate PATH’s user experience beyond that of The Geologic Traverse Planner, Marquez integrated and allowed users to switch between various visualizations (e.g. a contour map, a metabolic cost heat map, etc.) that would help them pick the best path for a traverse. While this improved user experience was no doubt a quality contribution, PATH’s active automation mode has since proven to have the larger influence on the future form of SEXTANT. In active automation mode, PATH would take a series of user-designated waypoints and – using a least-cost search algorithm similar to Dijkstra’s –
automatically join those waypoints in an optimal way. These algorithm-generated optimal paths were useful both as direct planning sources and also as sources of comparison against paths generated using some alternate method. One of the major findings of Marquez’s work was that, while paths created using active automation mode tended to be generated more quickly and be lower cost than those created using passive automation mode, active automation had a negative effect on situational awareness. Because of this, Marquez suggested that future generations of path-planning software make sure to keep humans involved in the planning loop.
The next major improvement to what is now known as SEXTANT came from Johnson’s 2010 master’s thesis (Johnson et al., 2010). Johnson’s work offered several important contributions, not the least of which was the first actual use of the acronym SEXTANT. In addition to giving the software its name, Johnson also spent a good deal of effort on extending the system to better handle path planning for non-human explorers, particularly rovers. Rovers consume energy and other resources much differently than their on-foot, human counterparts. Additionally, the constraints imposed on a traverse route by rovers and by humans differ greatly (i.e. managing
18
‘sun time’ is very important for solar panel equipped rovers). Johnson also improved SEXTANT in a broad, algorithmic manner by abandoning Dijkstra’s search algorithm in favor of the often faster A* (a-star) search algorithm. Both algorithms compute optimal paths (according to a supplied cost function), but A* is biased to investigate paths leading towards a goal point before those leading away (and thus tends to find a path more quickly). This improvement was
relatively minor in the whole scheme of Johnson’s work, but has shown to be quite important in the subsequent evolutions of SEXTANT.
The last major modifications to the SEXTANT software (for the purposes of this work) came from Norheim’s 2018 work Path Planning for Human Planetary Surface Exploration in Rough Terrain. In its first iteration (as The Geologic Traverse Planner), SEXTANT was implemented in the proprietary language of the license-requiring software Matlab. In her work on the PATH tool, Marquez took the ideas of the earlier path-planning software and incorporated them into an all new piece of software written in Java. With SEXTANT, Johnson moved the path-planning software back into the Matlab environment. Hoping to build SEXTANT into more of an open-source platform, freely usable by any interested researcher, Norheim elected to once more port the software to a new language: Python (Norheim et al., 2018). To further support his goal of turning SEXTANT into a more pervasive and portable path-planning platform, Norheim spent significant effort designing and implementing a robust application programming interface (API) for SEXTANT. He tested this API with three different pieces of software: the Exploration Ground Systems (xGDS) tool (developed by NASA Ames), the Sextant WebApp, and the Holo-SEXTANT application. The results of the xGDS-Holo-SEXTANT integration can be seen below in Figure 2.2.
19
SEXTANT’s integration with Holo-SEXTANT proved to generate considerable interest for future work. Holo-SEXTANT is an application that runs on the HoloLens augmented reality headset (HoloLens and the concept of augmented reality are discussed in further detail in section 2.2) and displays a SEXTANT-generated path as a virtual overlay over a user’s physical
surroundings. Though the display itself was fairly simple, feedback from its use in an in-field study was generally positive. Subjects in particular expressed excitement at the potential utility of a hands-free path-following display that did not require any mental frame-of-reference transformations. An image of Holo-SEXTANT being used during the BASALT-2 mission is shown below in Figure 2.3.
Figure 2.3: Subject navigating with Holo-SEXTANT (application on headset) during the BASALT-2 field study (Norheim et al., 2018)
2.2 Augmented Reality
2.2.1 Definition
According to Miligram and Kishino (1994), augmented reality (AR) and its technological sibling virtual reality (VR) represent two points along the single axis of the Virtuality Continuum. The Virtuality Continuum is shown below in Figure 2.4.
20
Figure 2.4: Simplified representation of the "Virtuality Continuum" (Milgram & Kishino, 1994)
The Virtuality Continuum is a one-dimensional, graphical visualization of the ratio of virtual vs real material present in a person’s environment. Rightward (i.e. positive) movement along the continuum translates to an increase in the percentage of virtual content. Milgram and Kishino note that the leftmost ‘real environment’ end of the continuum represents a setting in which the user is surrounded by objects that are strictly ‘real’; that is, objects that have “actual, objective existence” (Milgram & Kishino, 1994). A person who is walking about and experiencing the world without technological aids is interacting with a reality on this end of the continuum. The vast majority of the human experience has taken place in such ‘real environments’.
At the other end of the Virtuality Continuum lies the ‘virtual environment’, which is today more commonly known as virtual reality. Here, a user’s world is populated exclusively by “objects that exist in essence or effect, but not formally or actually” (Milgram & Kishino, 1994). In both virtual reality and its continuum-adjacent neighbor augmented virtuality, the visible portion (and often the audio portion as well) of a user’s environment is entirely virtual. In the case of
augmented virtuality, some gateway to the user’s actual surroundings – such as a graphical window or ‘cutout’ that reveals a view of the real-world – may also be present.
Moving in from the extreme left end of the continuum, we find the region representing augmented reality. In contrast to both VR and augmented virtuality, AR places a user in an environment that is based solidly in a user’s real-world surroundings. This reality-based environment is then ‘augmented’ by virtual objects such as waypoints or location-based description boxes. Krevelen (2010) refers to these virtual augmentations as “local virtuality”. Azuma (2001) presents thematically similar – though more structured – definition of augmented reality, stating that an AR system is one that:
combines real and virtual objects in a real environment; registers (aligns) real and virtual objects with each other; and
21
runs interactively, in three dimensions, and in real time.
While both augmented and virtual reality are often associated with specific pieces of hardware – such as the head-mounted display (a device discussed more extensively in the following
sections) – it should be noted that the definitions given here come with no specific hardware requirements.
2.2.2 Historical Implementations
Though AR-like concepts appeared in earlier works of fiction, Ivan Sutherland’s ‘Sword of Damocles’ – created in 1968 – is generally considered the first real-world implementation of the technology (Sutherland, 1968). The Sword of Damocles consisted of a head-mounted display (HMD) – a piece of hardware now almost synonymous with the technology itself – that was suspended from the ceiling. This rather precarious-looking setup – resembling the hanging sword from the eponymous ancient Greek parable – earned the device its curious nickname. A
photograph of the ‘Sword of Damocles’ is shown below in Figure 2.5:
Figure 2.5: Sword of Damocles (Sutherland, 1968)
Sutherland’s HMD used two miniature cathode ray tubes (CRTs) – one covering each eye – to display simple virtual objects to the user. As the wearer rotated and translated their head, the virtual objects would move and reposition themselves in such a way that they appeared to exist in three-dimensional space alongside the user. Though not entirely obvious from the image
22
shown in Figure 2.5, the two displays within the HMD were semi-transparent (Sutherland, 1968). Because of this, the user was able to perceive both virtual and real objects – placing the headset somewhere near the ‘augmented reality’ region of the Virtuality Continuum.
While Sutherland developed his ‘Sword of Damocles’ largely to determine if such a technology could be created, efforts to utilize AR as a tool to actually enhance task performance began in the early 1990s. One such early effort was Louis Rosenberg’s AR system ‘Virtual Fixtures’
(Rosenberg, 1992). In his experiment, Rosenberg tasked a group of subjects with quickly moving a wooden peg between a series of holes in a pegboard. Rosenberg chose to measure task
performance through task completion time, equating a low task completion time to high performance. In his conclusion, Rosenberg found that providing subjects with virtual, task-relevant overlays (which Rosenberg likened to “a ruler guiding a pencil”) increased performance (Rosenberg, 1992).
While the AR systems developed by both Sutherland and Rosenberg presented their virtual scenes via an HMD, many other developers have created augmented reality devices that display virtual content using different methods. In his work “Augmented Reality Navigation Systems”, Narzt notes that the windshield of a car has, for example, been in several instances successfully conscripted for use as an AR display surface (Narzt et al., 2005). Such a car-based augmented reality system is shown below in Figure 2.6.
23
Because the virtual elements (e.g. current speed) of the display are drawn on a naturally
transparent surface (here, the car windshield), this type of augmented reality is known as ‘optical see-through’ (OST) (Krevelen & Poelman, 2010). Believing AR could be used to enhance an automobile in a more meaningful way than a simple speedometer display, Narzt elected to develop a car-based AR navigation device of his own. This device is shown in Figure 2.7.
Figure 2.7: 'Video See-Through’ AR display used for navigation (Narzt et al., 2005)
Narzt’s display uses a single digital screen to render virtual objects on top of a video feed of the surrounding environment. This type of display is categorized into a family of AR systems known as ‘video see-through’ (VST). The VST and OST concepts are well-summarized by the
following pair of figures:
24
Because video see-through augmented reality systems are the “cheapest and easiest to
implement” (Krevelen & Poelman, 2010), devices similar to the one shown in Figure 2.7 are the most prevalent implementation of AR. Indeed, VST has for the majority of AR’s history been the only means by which an average person could experience the technology. In 2014, however, Google aimed to change this historical trend by releasing their very own OST HMD: Google Glass (GG). Designed as a pair of ‘smart glasses’ on which basic virtual information could be displayed (e.g. user reviews of a nearby business), Google Glass became the first widely available optical see-through AR device. Though ultimately a commercial failure, Google Glass’s impact on the AR community was significant; the device was used by many different researchers in a host of notable AR studies. In the years since Google Glass’s release, head-mounted OST augmented reality devices have continued pushing their way into the mainstream. The highest profile OST augmented reality device available today is the Microsoft HoloLens (Figure 2.9).
Figure 2.9: Microsoft Hololens worn by a user (from Microsoft.com)
2.2.3 Current Uses
Without a doubt, augmented reality is a powerful technology. As its name suggests, it applies a filter to the environment surrounding a user, distorting and augmenting it in ways that – ideally – make a given task more enjoyable or easier to complete. This power is not lost on the members of the many human-centered industries of today’s world, and because of this AR has been incorporated (with varying degrees of success) into many different fields.
25
2.2.3.1 Navigation
In a 2005 study, Narzt – as mentioned above – created a VST AR navigation device for use in automobiles. By overlaying an app-suggested route on a digital display of the driver’s real-world environment, Narzt’s device removed the need for the driver to interpret and apply a map-based abstraction to their surroundings; rather, the driver was able to simply ‘follow the yellow line’ (Narzt et al., 2005). Another example – one which is foundational to this paper – where augmented reality was used as a navigation aid is Holo-SEXTANT. Trekking over the rocky terrain of Hawaii’s Volcanoes National Park, members of NASA’s Biologic Analog Science Associated with Lava Terrains (BASALT) team employed the Holo-SEXTANT AR system as a virtual guide – one which helped them maintain their bearings in the barren environment
(Anandapadmanaban et al., 2018). Running on the Microsoft Hololens, Holo-SEXTANT presented researchers with a virtual overlay of their pre-determined traversal route. Though no formal user performance data was collected during the study, anecdotal feedback given by users suggested a general optimism about future exploration of Holo-SEXTANT-related technology. A screenshot of the Holo-SEXTANT navigation interface is shown below in Figure 2.10.
Figure 2.10: Screenshots from Holo-SEXTANT (Anandapadmanaban et al., 2018)
2.2.3.2 Maintenance & Assembly
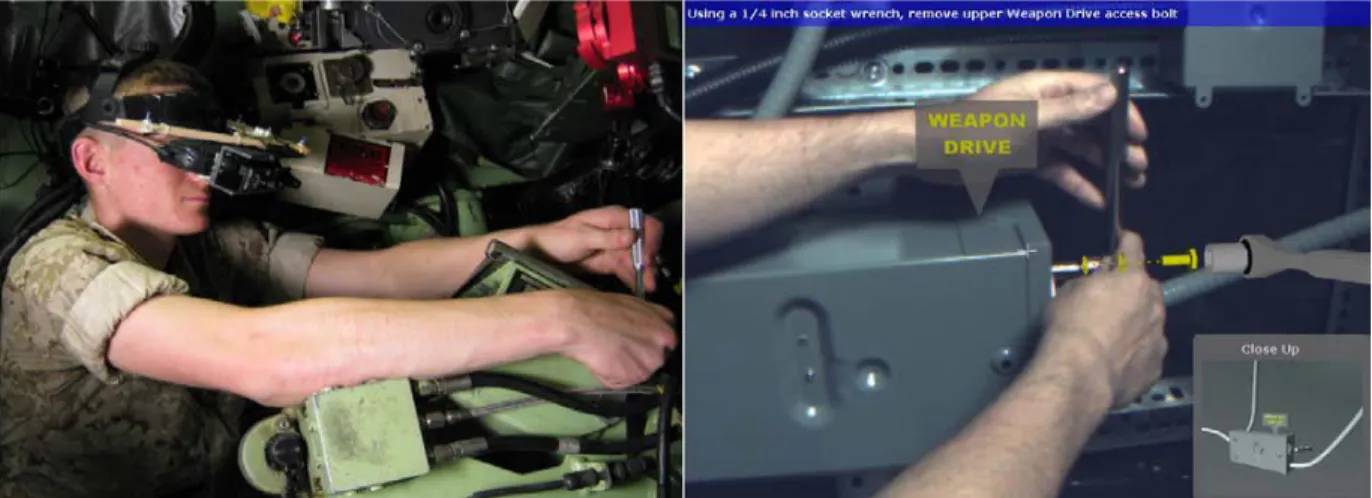
Another field for which augmented reality is particularly well-suited is maintenance and assembly; this is in large part due to AR’s ability to locate information displays in the same three-dimensional space as the objects to which they relate. A study performed by Henderson and Feiner (2011) illustrates this point well. In their study, Henderson and Feiner asked subjects to don an AR HMD and perform several maintenance tasks on an armored personnel carrier (APC) turret (Henderson & Feiner, 2011). The HMD interface provided subjects with a set of
26
virtual instructions that contained step-by-step text, close-up views, mechanism identifiers, and virtual versions of the tools needed for a particular step. The HMD hardware and user interface can be seen in Figure 2.11:
Figure 2.11: APC turret maintenance AR HMD hardware (left) and user interface (right) (Henderson & Feiner, 2011)
Though subjects generally took more time to complete a maintenance task when using the AR HMD than when using the traditional display, Henderson and Feiner did note that AR out-performed the LCD display in a criteria they called “localization time” (i.e. the time taken to visually locate the to-be-maintained mechanism).
In another assembly-related study, Syberfelt (2015) provided subjects with an AR HMD (in this case, an Oculus Rift repurposed as a VST AR headset) and tasked them with constructing basic wooden structures. Structures were assembled from simple, three-dimensional (Tetris-like) blocks in a way that Syberfeldt hoped would well-emulate work on an assembly line. In a slight deviation from the AR study norm, Syberfeldt’s goal was not to evaluate the performance (e.g. completion time) of AR against some more traditional display medium; rather, Syberfeldt wanted to evaluate AR’s usability and enjoyment-of-use in an assembly line setting. The largest barrier to the adoption of AR technology, Syberfeldt argues, will be acceptance of the product by actual workers. The study found that the AR interface was reasonably usable and understandable – even by first-time users – though traditional paper-based instructions received an equal or better rating in all collected qualitative measures.
27
2.2.3.3 Surgery
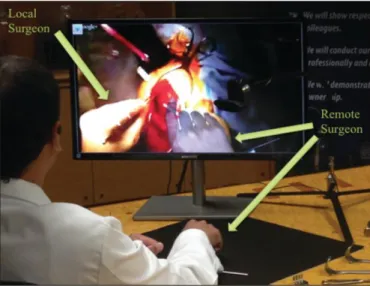
In their work “Emerging Technology in Surgical Education: Combining Real-Time Augmented Reality and Wearable Computing Devices” (2014), Ponce and Menendez recruited surgeons to help evaluate the efficacy of using AR in a surgery setting. One of these surgeons (surgeon A) remained on-site and actually performed the surgery, while the other (surgeon B) oversaw the surgery and provided guidance from a remote location. Surgeon A wore a Google Glass (GG) headset, the camera of which was used to stream a ‘surgeon’s eye view’ of the operation to surgeon B. While viewing this surgical live-stream, surgeon B positioned and manipulated his hands as if he were performing the operation himself. A second camera captured surgeon B’s hand motions and relayed them back to surgeon A, allowing him to “see a hybrid image combining the image of the surgical field with the image of his colleague’s hands or tools
through the GG head-mounted display” (Ponce et al., 2014). This setup is shown below in Figure 2.12.
Figure 2.12: Ponce and Menendez experimental setup
Though the surgery took longer than it likely otherwise would have, surgeon B noted that communicating through augmented reality felt natural and that it allowed “more precise
instruction than through verbal interaction” (Ponce et al., 2014). In a separate study, Dickey and Hakky (2016) conscripted several urology students and faculty to help them evaluate the
effectiveness of using AR to assist with the placement of an inflatable penile prosthesis (IPP). Using a GG headset, students performing the IPP placement were able to view video-based
28
descriptions of each step of the operation. In addition, instructors were given the ability to issue guidance to an operating student by moving a cursor or drawing virtual images on the GG display. Though the study found no quantitative indication of performance increase (since no quantitative measures were actually taken), a post-procedure qualitative assessment did reveal that “both faculty and trainees view this new technology [AR] in a positive light” (Dickey et al., 2016).
2.2.3.4 Geology
When surveying a particular region, geologists will employ maps and other geological implements that contain information on “details of rock structures, pockets and seams of
minerals, mine topography, and soil data” (Mathiesen, Myers, Atkinson, & Trevathan, 2012). As with any data set, these charts take on many different forms and can be displayed in many different ways. While the traditional paper map remains a useful aid, Mathiesen notes that
geological data presented in a three-dimensional format (which allows for color-coding, panning, and zooming) offers significant advantages. Knowing this – and also recognizing the potential benefits of applying AR to this scenario – Mathiesen conducted a study where he asked subjects to view and analyze geological data using a VST AR device. Understanding that geological studies often involve physically demanding traverses, Mathiesen elected to implement his augmented reality display on an Android mobile device. The display itself used GPS (along with location data present in the 3D geological map) to determine the device-relative positions of various geological formations. Equipped with this information, the device displayed the geological maps as three-dimensional overlays on the video from the forward-facing camera. Depth information was relayed to the user through a transparency gradient; the closer a geological element was to a user, the opaquer it appeared. As is the case for many AR studies (often due to low sample size), Mathiesen collected no statistically significant quantitative performance data. However, qualitative feedback provided by subjects was “overwhelmingly positive”, many citing as the source of their positivity the device’s elimination of the need to perform mental map-to-world transformations.
2.2.3.5 Education
Augmented reality has also found productive use in the world of education. Educators have long understood that different learners have different needs when it comes to absorbing and retaining
29
knowledge; some learners prefer text-based material, while others prefer to have material presented in a visual manner (Felder & Silverman, 1988). It has also been shown that students tend to learn material better (or are at least able to recall it more easily) when the learning takes place in a relevant context (Godden & Baddeley, 1975). Augmented reality has the unique ability to present visual information in the exact context to which it is most relevant, and because of this has found success in settings of learning such as classrooms and museums. In his work
“Applications of Augmented Reality for Archaeological Purposes”, Wolfenstetter discusses how ARCHEOGUIDE and LIFEPLUS – two augmented reality applications – were used to enhance a user’s visit to a cultural heritage site (Wolfenstetter, 2007). Both of these projects used AR HMDs, though the former used a VST setup while the latter used an OST setup. As described by Wolfenstetter, ARCHEOGUIDE and LIFEPLUS present users with virtual re-creations of ancient structures and works of art, cleverly placing the re-creations in the exact locations that their historical counterparts once occupied. Wolfenstetter cites accessibility as one of the key advantages that ARCHEOGUIDE and LIFEPLUS have over their traditional alternatives. The applications allow users to observe and learn from the virtual architectural models simply by walking around and looking at them. Since humans from childhood use this ‘learn by
observation’ technique, the two applications require little training and are quite intuitive (i.e. are accessible).
2.2.3.6 Gaming
Whereas an enthusiastic gaming community is arguably responsible for the recent resurgence of virtual reality as a consumer product (e.g. Oculus Rift, PSVR), the same cannot (as of yet) be said for augmented reality. This lack of mass adoption by gamers is likely due – at least in part – to the significant cost difference between current AR and VR headsets. As of this writing, first-party VR HMDs cost about $200; in contrast, the cost of an AR HMD is about $2000 – an order of magnitude greater. Even so, augmented reality games do exist, and are actually quite often an excellent showcase of the technology. One of the most popular augmented reality games is Microsoft’s ‘RoboRaid’. Playable only on the HoloLens, RoboRaid places a player in a scenario where their home (or whatever building they currently occupy) becomes the target of a robot assault. Flying metallic adversaries burst through walls and launch projectiles at the player, forcing them to duck and dodge to avoid in-game injury. The HoloLens, which constantly generates and re-generates a three-dimensional map of a player’s surroundings, creates this ‘wall
30
bursting’ effect by drawing a ‘hole’ texture on top of one of its 3D-mapped surfaces.
Simultaneously, the ‘ducking and dodging’ actions performed by the player are interpreted by the headset’s built-in pose tracking system; this system accomplishes its position and orientation tracking through a combination of image processing and inertial measurement unit (IMU) analysis (Aaron, Zeller, & Wojciakowski, 2017).
2.2.4 Modes of Interaction
Many of the digital devices that we interact with today display information – much of which is inherently two-dimensional (spreadsheets, documents, etc.) – on a flat LCD screen. Input tools historically associated with these devices (such as the cursor-controlling mouse and touchpad and the text-generating keyboard) lend themselves particularly well to these display formats. Even so, the most pervasive piece of modern digital hardware – the ever-present smartphone – has abandoned these traditional modes of input. This abandonment is not a byproduct of some substantive difference in the content viewed on the two device types. Rather, the change is a result of the way in which mobile users consume information. No longer constrained to seated positions in an office or coffee shop, smartphone users interact with content ‘on the go’ in a wide array of dynamic situations. To accommodate this, smartphones chose to discard the bulky and cumbersome external input devices favored by their desk-based relatives, opting instead to receive input by way of an integrated touch-screen. To reach its current usable and seemingly stable configuration, the smartphone underwent many design changes. Though officially an older technology, augmented reality devices have not yet experienced the same level of refinement as the modern smartphone; even so, they too have seen a good number of input mode iterations. A discussion of the variety of input methods used for augmented reality, both successful and unsuccessful, follows in the sections below.
2.2.4.1 Pose Tracking
The most important, essentially medium-defining input that a user provides to an AR system is their own position and orientation. A person or object’s position and orientation – when taken together – are often referred to as that person or object’s “pose”; future mentions of pose in this document are intended to be interpreted in this manner. Pose tracking is so important because it is required to realize the first point (i.e. “combines real and virtual objects in a real
31
implemented pose tracking via two different methods: forward kinematics of the arm connecting the headset to the ceiling (i.e. the “dangling sword” portion of the device) and a 12-point,
SONAR-like ultrasonic locating system. Though neither implementation is still used by current AR devices, pose tracking continues to be an important feature of modern AR systems. AR headsets such as the Microsoft HoloLens and the Magic Leap use an onboard inertial
measurement unit (IMU) and a variety of depth and “environment understanding” cameras to implement a form of pose tracking called SLAM (simultaneous localization and mapping) (Decker, 2019) . SLAM is a particularly useful form of pose tracking for AR because – as its name implies – it maps the user’s nearby environment at the same time as it tracks their pose. This mapping can be transformed into a three-dimensional mesh, which in turn can be used to facilitate interactions between real and virtual objects (knowing the basic geometry of one’s surroundings is incredibly useful for AR applications). Some studies – such as MIT’s own Holo-SEXTANT project (Anandapadmanaban et al., 2018) – have also used the global positioning system (GPS) to track a user’s position. This type of position tracking (orientation tracking can be done with GPS, though special handling is required) works well for situations where highly accurate position data is not required. Example use cases are navigating a kilometers-long path (e.g. Holo-SEXTANT) or displaying information about nearby businesses or addresses in a hypothetical urban-based navigation application.
2.2.4.2 Mouse & Keyboard
The mouse and keyboard have become user input staples of the desktop computing world
(though this is changing somewhat with the rise of tablets and high-quality touch interfaces). The mouse works so well in the desktop environment because its two degree-of-freedom (left-right, forward-back movement on a tabletop) and 0th-order nature (position changes of the mouse correspond to position changes of the cursor) maps perfectly to the two-dimensional workspace of a computer monitor. Similarly, the keyboard thrives in the desktop environment because its many tactile keys are as-of-yet unrivaled in their ability to accommodate text input. Hoping certain traditional design techniques would “make the jump” to AR, early AR applications tended to mimic their desktop-based ancestors by implementing the WIMP (windows, icons, menus, and pointing) design pattern. Developers quickly discovered, however, that WIMP interfaces performed poorly in AR applications – in large part due to their inability to handle interactions with a third spatial dimension (Krevelen & Poelman, 2010). Even so, the types of
32
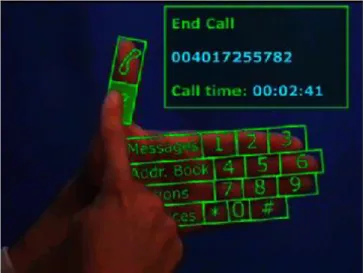
interactions afforded by the mouse and keyboard (object selection and text input, respectively) are still very much useful in AR applications. A common method of attaining mouse-like, point-and-click functionality in AR is to place a cursor at the center of the viewport, which in effect aligns the cursor to the AR device’s forward vector. The actual “click” of the cursor can be accomplished through gesture recognition (as is done in the HoloLens), by a button press on a handheld controller, or through some other means. A common – though somewhat cumbersome – technique for handling text input is via a cursor-click-to-type virtual keyboard. In a more inventive effort to solve the keyboard conundrum, Antoniac and Pulli (2001) developed the Marisil Mobile User Interface Framework. Marasil (Figure 2.13) uses gesture recognition to project a contextually relevant set of virtual keys on to a user’s palm, the keys of which can by “typed” by touching the appropriate location on the palm.
Figure 2.13: Marisil Mobile User Interface Framework (Krevelen & Poelman, 2010)
Other techniques for handling text input in AR involve haptic gloves, tangible user interfaces, and the precise pose tracking of a user’s fingertips (Krevelen & Poelman, 2010). As of yet, no solution has proven to be the AR-equivalent of the now-classic “mouse and keyboard”
combination; the area very much remains open for further research.
2.2.4.3 Touchscreen
Though arguably the most immersive form of augmented reality, HMD-based AR systems tend to suffer when they attempt to allow complex interactions with virtual objects. Many of these interaction difficulties arise because the most obvious or intuitive mode of interacting with an
33
HMD-projected virtual object – reaching out and physically touching it – is very difficult to simulate convincingly. NASA managed to do so at the VR lab at Johnson Space Center using a “tendon-driven robotic device”, though their system is non-mobile and can only be used within the room in which it was built (Dunbar, 2017). Video-see-through AR devices circumvent the need to simulate object weight and touch by presenting virtual objects (and the rest of the AR environment) in a more “traditional” way: via a digital screen. Indeed, if the screen of the VST AR device also happens to be a touchscreen, a user’s familiarity with smartphones and tablets lends an intuition altogether unavailable to HMD-based systems. Common touch interface features such as “touch to select”, virtual buttons, and a virtual keyboard can – if implemented well – be used with relatively little training. Even so, the ever-difficult task of creating an intuitive system for affecting the pose of virtual objects remains unsolved for AR touch
interfaces (Marzo, Bossavit, & Hachet, 2014). Three-dimensional manipulation is difficult in all settings, however (3D modeling software has been around for years, and still no agreed-upon “best” system exists), so this fact speaks less to the deficiencies of the touch interface and more to the complexity of the task itself.
2.2.4.4 Speech Recognition
One of the key benefits of AR is that it allows users to simultaneously interact with both real and virtual objects. The most intuitive (and even instinctual) way to interact with a real object is through direct manipulation with the hands – and ideally a set of hands not preoccupied with holding something else. Because of this, many AR systems strive to create a “hands free” (or at least “hands empty”) form of input handling. One of the more obvious ways of achieving this is through automatic speech recognition (ASR). ASR is a good tool for performing actions such as dictation, showing or hiding user interface elements, or proceeding to the next instruction of a multi-step task. Actions that are hard to describe in few words (such as object rotation,
translation, or scaling) are much more difficult to implement with ASR. One of the major complaints with AR systems (and really any system) that use ASR is recognition accuracy, a metric often measured using word error rate (WER). As of 2017, Google’s cloud-based speech recognition technology (one of the best in the industry) achieved a WER of 4.9% (Protalinksi, 2017). Though good, a 4.9% WER still means that every 20th word is misinterpreted in some way; this error rate only increases when using ASR in on-device mode (i.e. without access to the cloud) or in a noisy environment. In situations where mistakes must be kept to an absolute
34
minimum (e.g. a hospital surgical setting), ASR may prove an unsatisfactory form of input handling.
2.2.4.5 Gesture Recognition
Gesture recognition – much like speech recognition – has become a popular form of AR input handling, in large part due to its non-reliance on additional input peripherals. Gesture-based systems have the added benefit of often being very intuitive; real world, hand-based object manipulations (e.g. grasping, pinching, dropping) can often be translated to recognizable input gestures with relative ease. In his work “FingARTips”, Buchmann (2004) tasked subjects with laying out an urban environment using press, point, and grab gestures. Most subjects reported that using these gestures to move and manipulate urban structures was “easy and intuitive”. Subjects who had a less pleasant experience attributed their difficulties to poor hand and finger tracking.
2.2.4.6 Hand Controllers
Another common tool for supplying input to an AR system – particularly in video gaming system – is through hand controllers. Microsoft’s HoloLens is shipped with a very simple hand controller, a one button ‘clicker’ that provides what is essentially the left-click functionality of a desktop mouse (Decker, 2019). Though simple, some users prefer the tactile nature of using the clicker over hand gestures. A more robust example of an augmented reality hand controller is the one that comes packaged with the Magic Leap AR headset, shown below.
35
Magic Leap’s hand controller has a single analog trigger, two digital buttons, and a touch-pad and supports six degree-of-freedom motion tracking (MagicLeap, 2018).
2.2.5 Advantages & Drawbacks of Augmented Reality
In the previous sections discussing the history, uses, and input types of AR, certain recurring themes have emerged. Some of those themes reveal generally positive aspects of the technology, while others reveal generally negative ones.
2.2.5.1 Advantages
Reduces task time when dealing with complex structures
o Hou et al. developed a prototype AR system for Lego assembly and determined that the system yielded shorter task completion times, fewer assembly errors, and lower total task time when compared to paper-based manuals (Hou, Wang, Bernold, Asce, & Love, 2013).
Reduces time to locate/identify particular objects
o In their APC maintenance study, Henderson and Feiner found that localization time (time to ‘look at’ or ‘visually acquire’ the appropriate object for the current task step) was decreased when using AR (S. J. Henderson & Feiner, 2009). Increases ability to understand abstract or complex spatial relationships
o In Mathiesen’s study, where AR was used to visualize sub-surface geological features, researchers noted how AR increased comprehension of the geological structures (Mathiesen et al., 2012).
o The coexistence of virtual objects and real environments allows learners to visualize complex spatial relationships and abstract concepts.
o In their study, Wu et al. note that generally ‘unobservable phenomenon’ – such as the rotation of the Earth – can be more easily learned if students can visualize and interact with them; AR provides such a means (Wu, Lee, Chang, & Liang, 2013). Wearable/mobile
o When implemented as an HMD, AR can be a “hands free” technology; this is useful for performing many manual tasks.
36
o In the Holo-SEXTANT study, subjects were required to traverse difficult terrain while wearing large, heavy backpacks. Having unoccupied hands is helpful in such physically strenuous scenarios (Anandapadmanaban et al., 2018).
2.2.5.2 Drawbacks
Ease-of-use issues
o When compared with traditional assembly techniques, Syberfelt found that subjects found traditional paper-based instructions easier to understand.
(Syberfeldt et al., 2015). While this is reasonable given that most users possess vast experience dealing with paper instructions and relatively little dealing with AR, it remains a drawback that must be accounted for.
Potential for information overload
o In developing an AR display for locating a room in an office building, Julier notes that displaying all of the information relevant to a task can overburden a user (Julier, Baillot, Brown, & Lanzagorta, 2002). A good mitigation technique is applying an information filter, displaying only the items that are most relevant to a user’s current task.
Indoor/outdoor use, lighting concerns
o Anandapadmanaban needed to modify his HoloLens in order for the display to be visible while being operated in an outdoor environment (Anandapadmanaban et al., 2018).
Inadequate interaction modes
o Gestures and speech recognition remain too unreliable to be used in all situations, and using hand controllers negates AR’s “hands free” advantage. More work still needs to be done to find a robust and usable input system for AR.
2.3 Extravehicular Activity (EVA)
2.3.1 Definition
Extravehicular activity is – according to NASA – “an icon of human space exploration”
37
the International Space Station, the accomplishments of astronauts on EVA account for some of the most memorable in all of human history. Even so, the ‘formal’ definition of EVA is quite simple (and is essentially a deconstruction of the term itself). The prefix ‘extra’ means ‘outside of’ or ‘beyond’, while the word ‘vehicular’ refers to the spacecraft or habitat in which an unsuited astronaut generally resides. Merge the two, and you arrive at a suitable definition: any task (or, rather circularly, activity) that is conducted outside of a spacecraft. The types of tasks performed during EVA are many and varied, ranging from repair to exploration to simply determining if a human can survive in such a hostile environment.
2.3.2 EVA Roles
The work and effort of many individuals is required in order to execute a successful EVA. The role of each involved individual falls into one of three primary groups: extravehicular (EV) crew, intravehicular (IV) crew, and Mission Control Center (MCC) personnel (sometimes referred to as Mission Support Crew – MSC – depending on the mission). EV crewmembers are those individuals who actually don a space suit and depart the safety of their habitat, entering a hostile environment as the physical instrument that accomplishes mission objectives. Historically – with the exception of the Gemini missions – EV crews have consisted of two people. The IV crew are those individuals who remain within the shirt-sleeve environment just departed by the EV crew. IV crew are always close enough to their EV counterparts to communicate in real time and – according to the Pavilion Lake Research Project (PLRP) study – should consist of two crewmembers: one to focus on operations and one to focus on science. MCC personnel are generally all located in an Earth-based facility and consist of operations, science, and communications experts (K. H. Beaton et al., 2017).
2.3.3 Communication during EVA
Historically, EVA has been an information poor environment, particularly for the EV crew. Other than their own human senses, suited EV crewmembers have only two ways of receiving information about their surroundings and current status: a chest-mounted diagnostics display and a radio communications system. The diagnostics display used during the Apollo missions was worn on the chest and was part of a piece of hardware called the Remote Control Unit (RCU). A diagram of the RCU is shown in Figure 2.15.
38
Figure 2.15: (Left) Diagram of the Apollo Remote Control Unit (Jones, 1995)
Figure 2.16: (Right) EMU Display and Control Module (NASA)
The RCU had a gauge indicating how much oxygen remained in the Portable Life Support
System (PLSS) and several status and warning indicators for other suit functions. The descendant of the Apollo-era A7L space suit – known as the Extravehicular Mobility Unit (EMU) – was worn by NASA astronauts during shuttle and International Space Station (ISS) missions. The Display and Control Module (DCM) on the EMU, though upgraded with a digital display, served much the same function as the RCU before it. The vast majority of information flowing to EV crewmembers comes through the radio communication system. Select IV crew and individuals from mission control can access this radio system to directly exchange vocal requests and instructions with EV crewmembers.
2.3.4 Planetary EVA
2.3.4.1 Geological Objectives/Operations
Scientific objectives of planetary EVAs are typically geological in nature. However, relatively few human-based, extra-terrestrial missions with geological objectives have been performed; the number of such missions performed on Earth is far greater. Because of this, looking at Earth-based studies can offer valuable insight into how operations relating to geological objectives might be carried out during future planetary EVAs. Hodges describes field geology as a “discovery-based science”, noting that studies commonly begin with an ill-posed or overly general problem statement. Hoping to either refine or find outright answers to their research
39
questions, field geologists begin a study by creating an initial traverse plan. Having not yet set foot in the region of study, terrestrial geologists create these initial traverse plans using data from remote sensing equipment. Upon arrival at a study site, geologists will commonly ascend a nearby hill to make an in-person re-assessment of the planned traverse. As the geologist moves from station to station, they will take notes and collect data, altering and updating the traverse plan as needed. Additionally, the geologist will during their traverse be constantly on the look-out for targets of opportunity (TOPs) – stations of geological interest that had not been obvious in the remote sensing data (Hodges & Schmitt, 2011).
2.3.4.2 Apollo
Of all the EVAs that have been conducted – from Alexei Leonov’s initial 1965 spacewalk until the present day – only a small minority have taken place on the surface of planetary bodies. Indeed, the Apollo missions from the late 1960s and early 1970s remain the only events during which humans have set foot on extra-terrestrial soil. The large disparity between the number of planetary vs. non-planetary EVAs can be seen in Figure 2.17.
40
Even so, with NASA’s current plan to land astronauts back on the Moon by 2024, and to have “sustainable (Lunar) exploration” by the late 2020s, planetary EVA is likely to become much more common in the near future (NASA, 2020).
On every Apollo mission that successfully landed astronauts on the moon, at least one EVA was performed. The EVAs of the early Apollo missions (11 and 12) were dedicated primarily to engineering and testing-related tasks, while those of the later Apollo missions (14-17) focused much more heavily on scientific objectives. EVA traverse routes were planned long in advance of the actual mission, using information derived from photographic imagery and topographical maps (Muehlberger, 1981).
Of particular interest in understanding the difficulties of planning and conducting a walking EVA is the second EVA of Apollo 14. The intended goal of this EVA was to explore and
perform geological studies at the edge of Cone Crater. Cone Crater resided approximately 1.3 km away from the Lunar Module (LM), making Apollo 14’s EVA-2 the longest walking EVA ever performed. The planned route of the EVA is shown in Figure 2.18.
Figure 2.18: Planned Route for EVA-2 in Apollo 14 (Johnson et al., 2010)
As they traversed the lunar surface on foot, astronauts Alan Shepard and Edgar Mitchell became increasingly uncertain of their exact location. The lack of atmosphere on the Moon combined with the monochromatic nature of the terrain made depth perception and landmark identification
41
very difficult. Fatigue also became a problem for the astronauts as they ascended steep slopes that were never intended to be part of the traverse. Because of schedule and safety concerns, the EVA was ultimately aborted before the astronauts were able to reach Cone Crater; they were only about 100 meters from their destination. A quote from Mitchell illustrates well the difficulties and confusion he and Shepard experienced during the EVA.
You’d say, ‘Well, this next big crater ought to be a couple of hundred meters away, or 100, or 150.’ It just wasn’t anywhere in sight… You could not get enough perspective from any one spot to pin down precisely where you were. The undulations over the neighborhood were probably 10 to 15 feet (high)… It looked like we were in a large group of sand dunes (Jones, 1995).
Apollo 14 was the last Apollo mission to feature an EVA that required astronauts to travel large distance on foot; all subsequent Apollo missions (Apollo 15-17) utilized a Lunar Roving Vehicle (LRV). Though the LRV allowed astronauts to travel more quickly than they otherwise could have on foot, the maximum range of an EVA was still very much limited by the walking
capabilities of a suited astronaut. Each LRV-equipped EVA accounted for the possibility that the LRV might malfunction or become inoperable during a traverse by enforcing a “walk-back” constraint. This constraint required that – at any point during a traverse – a suited astronaut would be capable of and have sufficient resources to return safely on-foot to the LM. An unplanned event during the Second EVA of Apollo 17 resulted in a situation where astronauts Eugene Cernan and Harrison Schmitt nearly violated their walk-back constraint. While surveying a mission site, Cernan and Schmitt noticed a patch of “orange soil”. The astronauts and mission crew deliberated and ultimately elected to collect an unplanned sample of the soil. Because of low consumable levels and the walk-back constraint, the original objectives at the site had to be abandoned (Jones, 1995).
2.3.4.3 Analogues
The most recent execution of a planetary EVA was during the Apollo 17 mission in 1972; that was nearly half a century ago. Since that time, many new technologies and processes have been developed that have the potential to alter the way an EVA is planned and executed. Because foreign planetary bodies remain inaccessible, researchers must rely on analogue studies to determine which of these recent developments ought to be incorporated into a modernized EVA