HAL Id: tel-02864783
https://tel.archives-ouvertes.fr/tel-02864783
Submitted on 11 Jun 2020HAL is a multi-disciplinary open access archive for the deposit and dissemination of sci-entific research documents, whether they are pub-lished or not. The documents may come from teaching and research institutions in France or abroad, or from public or private research centers.
L’archive ouverte pluridisciplinaire HAL, est destinée au dépôt et à la diffusion de documents scientifiques de niveau recherche, publiés ou non, émanant des établissements d’enseignement et de recherche français ou étrangers, des laboratoires publics ou privés.
Upwelling System
Dante Espinoza Morriberón
To cite this version:
Dante Espinoza Morriberón. Interannual and decadal variability of the primary productivity and oxygen Minimum Zone in the Peruvian Upwelling System. Oceanography. Sorbonne Université, 2018. English. �NNT : 2018SORUS338�. �tel-02864783�
Sorbonne Université
l'Ecole Doctorale des Sciences de l'Environnement d’Ile de France (ED129)
Laboratoire d'Océanographie et du Climat: Expérimentation et Approches Numériques
Interannual and decadal variability of the primary
productivity and oxygen Minimum Zone in the Peruvian
Upwelling System
Par Dante Espinoza Morriberón
Thèse de doctorat de Sciences de la Mer
Dirigée par Dr. Vincent Echevin
Co-directeur de thèse Dr. Francois Colas
Présentée et soutenue publiquement le 12 décembre 2018 Devant un jury composé de:
Prof. Damien Cardinal Président
Dr. Laurent Mémery Rapporteur
Prof. Isabelle Dadou Rapporteur
Dr. Mark Ohman Examinateur
1 This thesis is dedicated to Martha, Cris and Rocio. To my family Gina, Mariacristina and Matias
2
Acknowledgements
Firstly, I would like to express my sincere gratitude to my advisors Dr. Vincent Echevin and Dr. Francois Colas for the continuous support of my Ph.D study and related research, for their patience, motivation, and immense knowledge. Their guidance helped me all the time of research and writing of this thesis. I could not have imagined having better advisors and mentors for my Ph.D study.
Agradecer a todo el IMARPE, en especial al Dr. Tam y el Dr. Dimitri que me han permitido realizar el PhD sin ningún incoveniente y confiar en mi para hacer investigación. A todos los miembros de mi Laboratorio (LMOECC) en IMARPE: Yvan, Jorge Ramos, Adolfo, Cinthia, Carlos, Jorge Flores, Paul, Maritza, Danny, Fiorela, Hanz, Manon. Ustedes han visto todo el proceso !!!, y gracias a sus enseñanzas pude en cierta forma terminar el doctorado.
A Erich Diaz y Ricardo Oliveros, porque fueron las personas que me impulsaron a hacer ciencia desde que llegué a IMARPE y sin los cuales, quizás no me encontraría en estos momentos terminando esta tesis.
Agradecer a mi familia por todo su apoyo durante estos cuatro largos años, en los cuales nunca dejaron de creer y confiar en mi. Gracias Martha por alentarme e impulsarme a seguir con mis grados académicos, este doctorado es para ti. Gracias Cristina y Rocio, por todo su apoyo, por decir las cosas directas y siempre ayudarme sin dudar en los peores momentos. A mi esposa Gina, por entender mi profesión y ser mi compañera; y a los pequeños en casa: mi Maricris y Matias por esperarme siempre felices luego de mis viajes!!!.
3
Table of Contents
ABSTRACT ... 6
CHAPTER 1: INTRODUCTION The Peruvian Upwelling System: A High Productivity Ecosystem with an Intense Oxygen Minimum Zone ... 8
1. Generalities... 8
1.1. Currents in the PCUS ... 10
1.2. Coastal Upwelling ... 14
1.3. Nutrients in the PCUS ... 18
1.4. Primary Productivity ... 20
1.5. The Oxygen Minimum Zone ... 24
2. ENSO as driver of the PCUS Interannual Variability ... 27
2.1. Impacts of El Niño events ... 27
2.2. Impacts of La Niña events ... 34
3. Long Term Variability... 37
3.1. SST and wind trends in the PCUS... 37
3.2. Biogeochemical trends in the PCUS ... 39
4. Biogeochemical Modelling Studies... 42
5. Objectives ... 46
CHAPTER 2: METHODOLOGY Models, Observed Data and Statistical Methods... 48
1. Hydrodynamic-Biogeochemical Coupled Model ... 48
1.1. The ROMS physical model ... 48
1.2. The PISCES biogeochemical model ... 49
2. Simulations ... 51
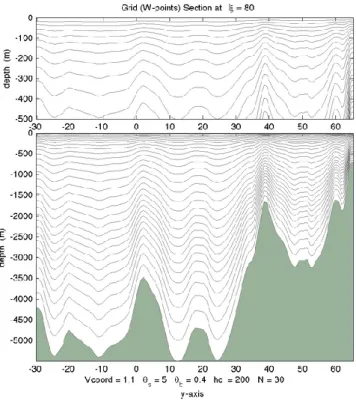
2.1. Parametrization... 51
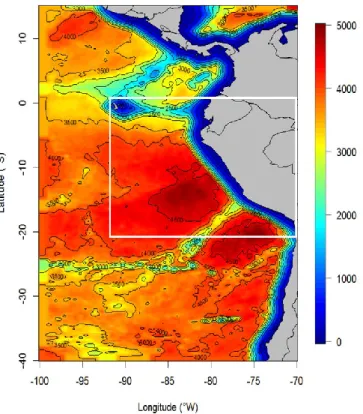
2.2. Model configuration ... 53
2.3. Atmospheric forcing ... 53
2.4. Open Boundary Conditions of the regional model ... 54
2.5. Sensitivity Experiments... 56
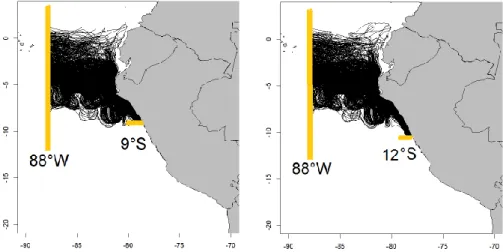
2.6. Tracking the upwelling Source Waters using ROMS-OFFLINE (ROFF) ... 57
3. Observational Data ... 59
3.1. CARS... 59
3.2. Sea surface temperature... 59
3.3. Sea level anomalies (SLA) ... 60
3.4. Surface chlorophyll ... 60
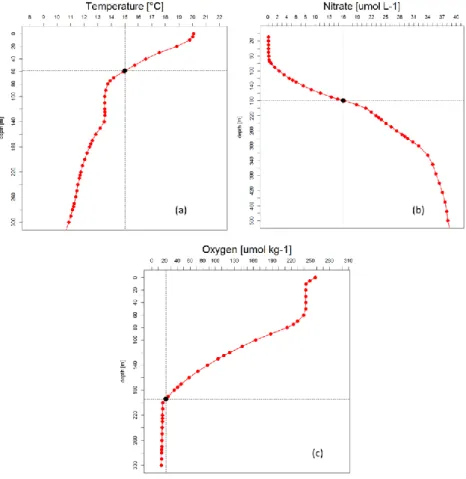
3.5. IMARPE in situ observations ... 60
4. Computation of Trends... 63
5. Appendix ... 65
CHAPTER 3: IMPACTS OF EL NIÑO ON THE PRODUCTIVITY Summary ... 69
Impacts of El Niño events on the Peruvian Upwelling System Productivity ... 71
4
1. Introduction ... 71
2. Material and Methods... 72
2.1. The Coupled Physical-Biogeochemical Model ... 72
2.2. Lagrangian Analysis ... 74
2.3. Satellite Data Sets... 74
2.4. In Situ Data Sets ... 74
2.5. Cross-Shore Sections and Coastal Indices ... 74
2.6. Eddy Subduction During EN... 75
2.7. Definition of EN Periods ... 75
3. Results ... 75
3.1. Model Evaluation ... 75
3.2. Impact of EN in Phytoplankton Groups ... 80
3.3. Processes Driving the Chlorophyll Decrease During EN... 81
3.4. Impact of EN Intensity and LN Conditions... 85
3.5. Impact of EN on Zooplankton and Carbon Export ... 85
4. Discussion ... 87
4.1. Model-Data Discrepancies ... 87
4.2. Seasonal Response of Chlorophyll During EN ... 87
4.3. Onshore Surface Geostrophic Transport During EN... 87
4.4. Changes in SW During EN ... 89
4.5. Eddy-Driven Nutrient Subduction During EN ... 89
5. Conclusions ... 89
References ... 90
Supporting Information ... 93
CHAPTER 4: IMPACTS OF EL NIÑO ON THE OXYGEN Summary ... 99
Oxygen variability during ENSO in the Tropical South Eastern Pacific ... 101
Abstract ... 101
1. Introduction ... 102
2. Material and Methods... 104
2.1. The ROMS-PISCES coupled physical-biogeochemical model ... 104
2.2. Model Experiments ... 107
2.3. Lagrangian Analysis ... 108
2.4. Eddy fluxes ... 108
2.5. ENSO index... 109
2.6. Oxygen in situ observations ... 109
3. Results ... 110
3.1. Evaluation of the modelled OMZ ... 110
3.2. Physical drivers of OMZ variability during ENSO ... 113
3.3. Biologeochemical drivers of O2 changes during ENSO ... 120
3.4. Impact of the remote and local forcing during ENSO... 124
4. Discussion ... 126
4.1. Bias of the modelled OMZ ... 126
4.2. Impact of eastward fluxes from the equatorial region ... 127
4.3. Ventilation by eddy fluxes ... 128
4.4. Impact of ENSO Diversity ... 128
4.5. Biological Processes ... 129
5
6. Appendix ... 133
CHAPTER 5: OCEANOGRAPHIC TRENDS DURING THE LAST DECADES Biogeochemical trends in the Peruvian Upwelling System: what are the involved mechanisms? ... 135
1. Introduction ... 135
2. Evaluation of Surface and Subsurface Trends... 135
2.1. Temperature... 137
2.2. Sea Surface Height ... 142
2.3. Surface Chlorophyll-a ... 143 2.4. Nitrate ... 145 2.5. Oxygen ... 147 3. Modelled Trends... 149 3.1. Modelled Chl trend... 149 3.2. Oxygen Trends ... 159
4. Impact of Remote versus Local Forcing on the Biogeochemical Trends ... 164
4.1. SST and surface productivity ... 165
4.2. Drivers of deoxygenation ... 168
5. Analysis of the Equatorial Forcing over 1979-2008 ... 170
6. Appendix ... 172
CHAPTER 6: CONCLUSIONS Conclusions and Perspectives ... 178
1. Conclusions ... 178
2. Limitations of the Study ... 180
3. Perspectives ... 185
6
ABSTRACT
The Peruvian upwelling System, driven by quasi-permanent alongshore winds, is one of the most productive regions of the global ocean. Due to a sluggish subsurface circulation and respiration of a large amount of sinking organic matter, an intense and shallow Oxygen Minimum Zone (OMZ) is present in the subsurface layers. Because of its proximity to the Equatorial Pacific, this system is strongly impacted by El Niño (EN) and La Niña (LN) events at interannual and interdecadal time scales. In the present thesis, we first study how EN and LN events impact on (i) primary productivity and (ii) dissolved oxygen concentrations. Second, we investigate the physical and biogeochemical processes responsible for the productivity and deoxygenation trends observed during the last decades. We make use of a regional physical-biogeochemical coupled model (ROMS-PISCES) and of an in-situ regional data set to study the hydrodynamics and biogeochemical cycles from 1958 to 2008. The model is able to reproduce oceanic conditions associated with EN and LN, and the observed trends in the last decades. During EN periods, surface chlorophyll decreases due to nutrient depletion associated with intense downwelling Coastal Trapped Waves and due to an enhanced light limitation in summer. The surface layer becomes more ventilated as the oxycline deepens in association with the thermocline. The OMZ waters originate from a more ventilated equatorial region. The enhanced eddy kinetic energy also impacts eddy fluxes of nutrient and oxygen during EN. During the last decades, the large-scale remote forcing associated to equatorial variability mainly drives the summer Chl increase and progressive deoxygenation, whereas local winds play a minor role. The nearshore deoxygenation trend could be associated with the decreased mass fluxes of Equatorial Under Current and Tsuchiya jets.
7
CHAPTER 1:
INTRODUCTION
8
The Peruvian Upwelling System: A High Productivity Ecosystem with an
Intense Oxygen Minimum Zone
1. Generalities
The Peruvian Coastal Upwelling System (PCUS) or Humboldt Current System (HCS) is one of the most productive systems in the ocean [Chavez and Messié, 2009; Lachkar and Gruber, 2012]. It is one of the four Eastern Boundary Upwelling Systems (EBUS; California, Canary and Benguela system) of the global ocean (Fig.1a). As other EBUS, the PCUS presents particular characteristics: cold coastal waters, poor-oxygenated subsurface waters (called Oxygen Minimum Zones, OMZ) [Paulmier and Ruiz-Pino, 2009] and a high surface productivity [Chavez and Messié, 2008; Demarcq, 2009] which supports one of the most abundant fisheries in the word, the anchovy fishery [Pauly and Christensen 1995].
Figure 1. a) The four Eastern Boundary Upwelling Systems: California, Humboldt, Benguela and Canaries. The mean concentration of chlorophyll-a from SeaWIFS averaged over 1997-2008 is shown (colour scale). The figure was modified from Messié and Chavez [2015]. b) Fish catch vs. primary productivity between 1998 and 2005 in the four major EBUS [Chavez et al., 2008].
In the EBUS, subsurface waters are brought to surface by upwelling, which supplies nutrient-rich waters to the surface layer, triggering a phytoplankton bloom near the shores. The different EBUS have different latitudinal range, shelf width, nutrient input concentration, upwelling intensity [Fréon et al., 2009] and primary productivity. For these reasons, understanding the mechanisms which take place in EBUS is one of the hot scientific topics nowadays [Lachkar and Gruber, 2012].
9 The productivity in the EBUS represents 1% of the ocean productivity, nevertheless 20% of the fish catches on the world are carried out in these systems [Pauly and Christensen, 1995]. From this 20%, half is caught in the PCUS eventhough other EBUS (e.g. the Benguela and Canary Systems) are more productive (Fig. 1b) [Chavez et al., 2008]. Several hypotheses were formulated to explain this particularity: (i) the efficiency of the trophic transfer from zooplankton to small pelagic fish [Bertrand et al., 2014], (ii) the short food chain [Espinoza and Bertrand, 2008], and (iii) the “re-set effect” of the El Niño phenomenon which allows the anchovy to growth without presence of predators and competitors [Bakun and Weeks, 2008].
The formation and maintenance of the Peruvian OMZ result from complex physical and biogeochemical processes. Anoxic conditions have been occasionally evidenced in the coastal region [Paulmier and Ruiz-Pino, 2008]. Besides, the OMZ is one of the shallowest in the world [Fuenzalida et al., 2009]. As it limits the habitat of several species, it has been suggested that the decadal changes in the anchovy and sardine stocks may have been driven by decadal oscillations of the depth of the OMZ upper limit [Diáz and Rosenberg, 2008; Bertrand et al., 2011]. Furthermore, progressive deoxygenation has been evidenced in the open ocean and coastal regions [Breitburg et al., 2018], which could be related with the expansion of the OMZ during the last decades [Stramma et al., 2008].
At interannual time scales, the PCUS is strongly impacted by El Niño Southern Oscillation (ENSO), owing to its proximity to the equatorial Pacific. ENSO originates in the Equatorial Central Pacific region and has an impact on the entire world climate. It presents warm (El Niño, EN) and cold (La Niña, LN) phases. During EN, in the coastal region off Peru, the temperature increases and the productivity decreases [Barber and Chavez, 1983], which triggers a change in distribution of several fish species [Ñiquen and Bouchón, 2004], while during LN opposite impacts are observed.
The PCUS is also impacted at longer time scales by climate change. In the future, under a pessimistic scenario (quadrupling the preindustrial CO2 atmospheric concentration), Sea Superficial Temperature (SST) and stratification increase [Echevin et al., 2011; Oerder et al., 2015]. More recent results suggest that nearshore primary productivity may slightly decrease [Gévaudan et al., 2017]. Besides, deoxygenation trends are not known in the future, due to the strong oxygen bias in current global earth-system models [Cabré et al., 2015]. Climate change could also influence the distribution of the fish migration (e.g northward, Cheung [2018]) and loss of the biodiversity in the Tropical Ocean.
10 The above mentioned processes and characteristics of the PCUS make it a crucial and interesting research topic. The dynamical and biogeochemical processes, which occur during EN and LN events, are not well understood, mainly because of the scarcity of sampled data and the lack of data processing. Increasing the knowledge about the mechanisms that produce interannual productivity and oxygenation changes during ENSO is one of the main goals of this thesis. Furthermore, the processes driving the long term evolution of the system are also studied.
In the following, section 1 describes in detail the PCUS mean state and seasonal variations. Section 2 focuses on the impacts of ENSO (EN and LN events) on oceanic conditions in the PCUS, whereas section 3 describes the recent findings about the physical and biogeochemical observed trends off Peru, with a particular emphasis on the primary productivity and OMZ. Section 4 presents a compilation of the modelling biogeochemical studies in the PCUS. Last, section 5 summarizes the objectives of the present thesis.
1.1. Currents in the PCUS
The PCUS presents a particular current system (Fig. 2). Nearshore currents are driven mainly by the surface wind at the surface and impacted by the equatorial circulation at subsurface. The PCUS is composed by two current systems: the Equatorial Current System (ECS) [Tsuchiya 1975; Johnson and Moree, 1997; Ishida et al., 2005; Kessler 2006] and the Peruvian Current System (PCS) [Brockmann et al., 1980; Penven et al., 2005; Montes et al., 2010; Chaigneau et al., 2013; Pietri et al., 2014].
Figure 2. Surface (left panel) and subsurface (right panel) currents in the Peruvian Coastal Upwelling System. The mean surface salinity (in ups, left panel) and temperature (in °C, right panel) are also shown. Figure adapted from Chaigneau et al. [2013].
11
1.1.1. The Equatorial Current System (ECS)
The ECS is composed by the Surface Equatorial Current (SEC), the subsurface Equatorial Undercurrent (EUC) and the Southern Subsuperficial Countercurrents (SSCC) (Fig. 3). The SEC forms the northern part of the South Pacific Gyre. It flows northeastward across the equator (~ 5°N) and its velocity increases westward [Wyrtki, 1967]. The SEC transports ~ 12 Sv at 95°W above 200 m between 6°S and 6°N, and increases at 140°W (~ 35 Sv) [Kessler, 2006]. SEC splits into two branches when the EUC shoals [Kessler, 2006]. Furthermore, the SEC forms part of the equatorial upwelling system, which is produced by the divergence of the Northern and Southern SEC [Pennington et al., 2006].
At subsurface, the EUC is a permanent current. It flows eastward along the equator [Philander, 1980; Tsuchiya et al., 1989; Ishida et al., 2005] and shoals from west to east [Kessler, 2006]. The EUC splits into two branches at 92°W owing to the presence of the Galapagos Islands [Lukas, 1986]. In average, the EUC is found between 2°N – 2°S and 50 – 300 m depth at 86°W [Kessler, 2006]. Moreover, the EUC intensity presents a marked seasonality. It peaks between January and June and decreases in July-November [Lukas, 1986]. Interannually, the EUC is impacted by ENSO phases. During EN, the EUC vertical extent reduces (70 – 200 m) and its flux is stronger than during neutral and LN periods [Montes et al., 2011]. The EUC is also a source of oxygen in the eastern equatorial Pacific as it transports oxygen-rich waters eastward [Stramma et al., 2010].
Off the equator, the SSCCs (also known as Tsuchiya jets; Tsuchiya [1975]) flow eastward. The northern and southern SSCC are also called primary and secondary jets. The primary and secondary jets (pSSCC/sSSCC) are usually located between 2°S – 6°S and 6°S – 10°S respectively. The pSSCC is stronger than sSSCC, but both are less intense than EUC [Montes et al., 2010]. ENSO phases also impact the SSCCs. During EN, the pSSCC shifts northward and its vertical extent reduces, while during LN its core remains at ~4°S and thickens. In contrast, the sSSCC is closer to the equator, more intense and shallower during EN than during neutral and LN periods [Montes et al., 2011]. The OMZ is highly sensitive to changes in the position and intensity of the SSCCs [Montes et al., 2014].
12 Figure 3. Meridional section of the zonal current (cm s-1, in contours) and density (in colours) between 92°W - 87°W of ROMS outputs from Montes et al. [2011].
1.1.2. The Peruvian Current System (PCS)
At the surface, two equatorward currents dominate the PCS: the Peru Coastal Current (PCC) and the Peru Oceanic Current (POC) (Fig. 2a). The Peru Coastal Current (PCC, also called Humboldt Current) is found within 100 km from the coast and between surface and ~ 50 m [Huyer et al., 1991; Penven et al., 2005; Pietri et al., 2014]. It transports cold and nutrient-rich waters due to coastal upwelling [Huyer et al., 1987]. Its velocity ranges from 5 to 15 cm.s -1 and increases equatorward. Moreover, the maximum PCC flow during winter is in phase with the seasonal cycle of the trade winds [Strub et al., 1998]. The offshore POC flows northward (north-eastward between 15°S and 20°S). Using ADCP data in 2008-2012, Chaigneau et al. [2013] observed the POC between 9°S and 12°S, farther than 180 km from the coast and up to 500 m depth.
At subsurface, the Peru-Chile Undercurrent (PCUC) flows poleward [Brockmann et al., 1980] until 48°S [Silva and Neshyba, 1979]. It dominates the subsuperficial circulation on the Peruvian shelf between 100 and 200 m depth [Brink et al., 1983]. The PCUC intensifies from 8°S to 16°S and decreases south of 16°S (Fig. 4) [Chaigneau et al., 2013]. It reaches the surface layer during some periods [Penven et al., 2005; Pietri et al., 2014].
13 Figure 4. Cross-shore section of alongshore velocity (in cm s-1) (a). Meridional variation of alongshore integrated transports (solid lines) and associated errors (shaded areas) (b). In (b), transports were integrated between 25 m and 500 m depth and from the coast to 200 km offshore. Black solid line marks the total transport, whereas blue solid line corresponds to the transport associated with poleward alongshore velocity components only. Red solid line corresponds to the mean southward Sverdrup transport (2008–2012) integrated from the coast to 200 km offshore and computed from Metop/ASCAT winds. From Chaigneau et al. [2013].
PCUC waters are the main source waters of the coastal upwelling [Huyer et al., 1987]. They have a high salinity and are nutrient-rich and low oxygenated [Tsuchiya and Talley, 1998; Strub et al., 1998]. Seasonally, between 9°S – 12°S, the PCUC intensifies during summer, while is weaker during winter [Chaigneau et al., 2013] (Fig. 5a). Using a hydrodynamic model, Montes et al. [2011] showed that during EN (2002 – 2003) the PCUC shoaled and intensified, whereas during LN (1999 – 2000) it deepened and was slightly more intense than neutral periods. ADCP data from IMARPE also evidenced an intensification of the PCUC during the moderate 2010 El Niño event [Chaigneau et al., 2013] (Fig. 5b). The PCUC is fed (~ 30%) directly by the EUC and SSCCs, the latter being the main contributors [Montes et al., 2010]. Interannually, the PCUC is fed mainly by the sSSCC and pSSCC during EN and LN respectively [Montes et al., 2011].
Last, the poleward Peru-Chile Countercurrent (PCCC) is found further from the coast than the PCUC and spans between 5°S – 35°S [Strub et al., 1998].
14 Figure 5. Seasonal cycle of the averaged circulation in the layer corresponding to PCUC core. Red and blue arrows represent schematically the equatorward and poleward flows, respectively, whereas green arrows indicate the presence of mesoscale eddy-like features (a). In (b), same as (a) but for specific surveys realized along the Peruvian coast in March of 2009 – 2012. From Chaigneau et al. [2013].
1.2. Coastal Upwelling
The upwelling is the divergence process by which deep waters are brought to surface layers. This process takes place in the EBUS, but may also occur in other ocean areas (e.g. equatorial upwelling).
As the trade winds blow equatorward along the Peruvian coasts, this produces a motion of surface waters due to friction between the air and the sea surface (Fig. 6a). In the Southern Hemisphere, the movement of surface waters is to the left of the wind direction (with an angle
15 of 45°), due to the Coriolis Effect. In subsurface layers, this angle increases and the velocity associated to the wind stress decreases (by dissipation of energy) producing the Ekman Spiral (Fig. 6c). Below the Ekman Spiral, the influence of the wind stress is insignificant. The Ekman layer is defined between the surface and the bottom of the Ekman Spiral. The integration of the water velocity over the depth of the Ekman layer is the Ekman transport, perpendicular to the wind direction. The Ekman transport (M) is computed as follows:
M =ρ τ
sea|f|
Where τ represents the wind stress, ρsea the water density (~ 1026 kg.m-3) and |f| the absolute value of the Coriolis parameter.
Figure 6. Schematic representation of the Ekman transport at the surface (a) and in a vertical cross-shore section (b). Representation of the Ekman Spiral in the water column (c).
Coastal upwelling is driven mainly by the Ekman transport divergence at the coast. Nevertheless, Ekman transport divergence is not the unique process that produces upwelling. Ekman pumping and “upwelling” Coastal Trapped Wave (CTW) may also trigger coastal upwelling [Kampf and Chapman, 2016]. The role of upwelling CTWs will be detailed in section 2.1.
16 The Ekman pumping refers to the vertical velocity induced by the divergence of the horizontal Ekman transport associated to wind stress curl. This process takes place offshore and is associated to an upward flux of nutrients. Using a physical-biogeochemical coupled model, Albert et al. [2010] showed that a decrease in Ekman pumping produced a less productive system owing to the deepening of the source nutrient-rich waters transported by the PCUC (Fig. 7). Moreover, using satellite data from ERS (European Remote-sensing Satellite), Halpern [2002] demonstrated that Ekman pumping decreases during EN due to a weakening of wind stress curl.
Figure 7. Schematic representation of the mechanisms linking wind stress curl to primary production (left and right panel). The alongshore wind stress (in red) decreases in the dropoff zone (from ∼200 km to the coast) leading to negative wind stress curl. Ekman transport (horizontal arrows in blue) is related to wind stress, and Ekman pumping (vertical arrows in blue) is related to wind stress curl. From Albert et al. [2010].
In order to study the upwelling, several upwelling indices (UI) have been developed. They are based mainly on the nearshore wind stress values [e.g. Bakun et al., 1973]. The UI is defined as:
UI = M ∗ cos α
M is the Ekman transport and α is the angle of the coastline. For the Peruvian coast, α is ~150° in Trujillo and ~140° in Callao [Mendo et al., 1987].
At seasonal time scales, the UI represents well the variation of the upwelling in the coastal region. The upwelling peaks during winter and decreases during summer [Zuta and
17 Guillen, 1970]. Figure 8 shows that the seasonal cycles of the upwelling and trade winds are highly correlated [Chamorro et al., 2018].
Figure 8. Seasonal cycle of the wind speed alongshore (left panel, in m s-1) from Chamorro et al. [2018] and vertical velocity mean (right panel, m day-1) between 7°S-13°S within 200 km to the coast at 50 m depth from a ROMS simulation [Espinoza-Morriberón, 2012].
At interannual time scales, there is a decoupling between upwelling and wind stress. Indeed, the alongshore winds tend to increase during EN (forced by the strong SST alongshore gradient; Chamorro et al. [2018]), whereas the upwelling decreases. Using in situ data (vertical profiles of temperature) near 10°S, Huyer et al. [1987] evidenced the shutdown of the upwelling during the 1982-83 EN (May 1983) in spite of an enhanced wind stress. Using a numerical model, Colas et al. [2008] evidenced a decrease of the upwelling between 7°S and 13°S during the 1997-1998 EN. Both studies suggest that the decoupling between the wind stress and the upwelling during EN is caused by an onshore geostrophic flow associated to a large scale alongshore sea level anomaly. Thus, the coastal upwelling is driven by the interplay between oceanic (e.g. currents) and atmospheric (e.g. winds) forcing [Colas et al., 2008; Marchessiello and Estrade, 2010].
The alongshore upwelling can be decomposed in localized upwelling cells. Calienes et al. [2014] computed the offshore extension of cold waters and identified six main upwelling centers: Pimentel (~ 7°S), Chimbote (~ 9°S), Huarmey (~ 10°S), Pisco (~ 14°S), San Juan (~ 16°S) and Atico (~ 16.5°S). These areas present cold SST, high nutrient concentration and an intense productivity [Calienes et al., 1985]. The most intense upwelling centers are located between Pisco and San Juan, where SST reaches 17°C in summer and 16°S in winter (Fig. 9; Grados et al. [2018]).
18 Figure 9. Mean in situ SST during summer and winter (in °C). Figure from Grados et al. [2018].
1.3. Nutrients in the PCUS
The availability of upwelled nutrient-rich waters drives the primary productivity in the EBUS. The main nutrients needed for phytoplankton growth are nitrate (NO3), silicate (SiO2), phosphate (PO4) and iron (Fe). Nutrients increase at greater depths (generally below the picnocline) and decrease in the surface layer due consumption by phytoplankton [Zuta and Guillén, 1970]. Off the Peruvian coasts, the surface nutrients range between 0 to 35 µmol L-1 (nitrate), from 0 to 30 µmol L-1( silicate), from 0.2 to 4 µmol L-1 (phosphate) [Zuta and Guillén, 1970; Graco et al., 2007; Calienes et al., 2014] and from 0.01 to ~ 12 nmol L-1 [iron; Bruland et al., 2005].
Strong nutrients cross-shore (coastal-ocean) gradient are found, with higher concentrations close to the coast. These rich waters are associated to the intense coastal upwelling [Calienes et al., 1985, Zuta and Guillén, 1970] but also to the shelf sediments off central Peru [Dale et al., 2017]. Latitudinally, the higher nutrient concentrations are observed between 6°S and 15°S. During winter, surface nitrate may reach values of 20 µmol L-1 between 6°S – 10°S, while lower values (~3 µmol L-1) are found south of 16°S and north of 3°S [Calienes et al., 1985]. This distribution is associated to the presence of contrasted water masses. Cold Coastal Cold Water (CCW) is characterized by high nitrate, silicate and phosphate concentrations, while the offshore Surface Subtropical Waters (SSW) and Surface Equatorial Waters (SEW) are nutrient-poor. The nitrate distribution is also influenced by the chemical
19 reactions of the nitrogen cycle: nitrification, denitrification and anammox during which nitrogen is lost to the atmosphere in the form of N2 (Fig. 10).
Figure 10. Schematic of the oceanic Nitrogen cycle. From Lam et al. [2009].
Figure 10 describes the nitrogen cycle in the ocean. Nitrification occurs under oxygenated condition and during this process, ammonium is oxidized into nitrite and nitrate. This process is performed by bacteria and produces high concentrations of nitrous oxide (N2O, a potent greenhouse gas), which are generally observed above 50 meters depth in the PCUS [Kock et al., 2016]. Denitrification is defined as the nitrate reduction to ammonium. In this process, bacteria uses nitrate as the hydrogen accepter under oxygen deficient conditions, (generally less than 6 µmol kg-1) [Dugdale et al., 1977]. In the PCUS, denitrification was observed at 100 – 400 m depths and between 10°S – 25°S. It can remove ~ 2.5 x 10¹³ g N yr−1 by N2O production over a 2 year time period (e.g. 1976-1977, Packard et al. [1983]). Last, anammox (anaerobic ammonium oxidation) transforms nitrite to N2. Anammox is the predominant pathway for nitrogen loss within the PCUS OMZ [Lam et al., 2009]. These biogeochemical processes are strongly modified by ENSO phases [Mogollón and Calil 2017; Yang et al., 2017] (see chapter 3 and 4).
The seasonal cycles of nutrients and upwelling are highly correlated. During winter, the nutrients reach their maximum values, whereas during summer nutrient-poor waters predominate alongshore. At the surface, the phosphate, silicate and nitrate are low (~ 1 µmol L -1, ~ 5 µmol L-1, ~ 5 µmol L-1, respectively) and increase during winter (~ 2.5 µmol L-1, ~ 25 µmol L-1, ~ 20 µmol L-1, respectively) (Fig. 11) [Calienes et al., 1985; Graco et al., 2007].
20 ENSO phases also have a strong impact in the nutrients concentration in the column water (see section 2.1).
Figure 11. Surface nutrient concentration (nitrate, phosphate and silicate) from IMARPE observations. From Calienes et al. [1985].
In the case of iron, a micro-nutrient, scarce data is available to compute a robust seasonal cycle. However, iron is known to have an important role in the phytoplankton growth. The shelf sediment is considered to be the main source of iron. In the PCUS (as in the open ocean), there are zones known as High-Nitrate and Lower Chlorophyll concentration (HNLC). These low-productive, nitrate-rich waters are due to a deficit of iron, limiting phytoplankton growth [Hutchins et al., 2002]. Bruland et al. [2005] classified the Peruvian waters based on the iron concentration. Offshore “blue waters” are characterized by a low productivity and a low iron concentration, whereas nearshore “brown waters” are highly productive and iron rich. Fertilization experiments in the open ocean demonstrated that productivity in HNLC regions is limited by iron [Boyd et al., 2007].
1.4. Primary Productivity
The PCUS is one of the most productive areas in the world. The permanent upwelling of nutrient-rich waters, along the year, triggers high levels of productivity. Chlorophyll-a (Chl) from both in situ and satellite data (ocean color) is used as a proxy to evaluate the productivity.
21 Chavez and Messié [2009] showed that the seasonal cycle of productivity and the vertical transport (upwelling) from California, Canary and Benguela systems are in phase (Fig. 12). In contrast, the seasonal cycle of the productivity and the upwelling are out of phase in the PCUS.
Figure 12. Seasonal cycle of chlorophyll concentration (black), sea surface temperature (blue) and total vertical transport (Ekman transport plus Ekman pumping) in the four EBUS (10°S latitude band up to 150 km offshore). From Chavez and Messié [2009].
Surface Chl patterns in the PCUS are typical of EBUS [Calienes et al., 1985, 2014, Echevin et al., 2008]. Maximum and minimum values are found nearshore and offshore respectively (Fig. 13, SeaWIFS). Using IMARPE in situ data from 1960 to 2000, Calienes et al. [2014] found that Chl ranges from 0.02 to more than 12 mg m-3 within 100 km from the coast. The highest values are found between 7°S and 15°S (Fig. 13a). Chl vertical profiles present an U-shaped curve with a peak at ~ 25 m depth, which is related to the euphotic layer and MLD [Calienes et al., 1985, 2014]. Red tides (extreme values of productivity) are often found near the coast, triggered by eutrophic conditions [Kahru et al., 2004].
22 Figure 13. Annual mean surface Chl (a), summer (b) and winter (c) means from satellite SeaWIFS data between 2000 and 2008.
As mentioned previously, the PCUS productivity presents a marked seasonality. The Chl (between 4°S – 15°S and within 200 km to the coast) displays maximum values in late austral summer – early autumn (in situ: ~ 5 mg m-3, SeaWIFS: ~ 2.5 mg m-3), while minimum values during winter are observed (in situ: ~ 0.8 mg m-3, SeaWIFS: ~ 1 mg m-3). The in situ data presents a second peak during spring (~ 3 mg m-3) (Fig. 14a) [Pennington et al., 2006; Echevin et al., 2008]. The amplitude of the seasonal cycle depends of the latitude. It is enhanced in two narrow coastal bands at 8°S – 9.5°S and 11°S – 14°S (Fig. 14b), the latter being the most productive. Both coastal regions present highest values during late summer – early autumn (8°S–9.5°S: ~ 5 mg m-3; 11°S–14°S: ~ 7 mg m-3) and minimum concentrations during winter (~ 2 mg m-3).
Figure 14. Seasonal cycle from in situ data and SeaWIFS in a coastal band (between 4°S – 15°S and within 200 km to the coast) from Echevin et al. [2008] (a). Alongshore seasonal variation of Chl from SeaWIFS-MODIS (b).
23 As mentioned previously, the seasonal cycle of Chl and upwelling are out of phase (Fig. 15). Several hypotheses have been proposed to explain this paradox [Calienes et. al., 1985; Echevin et al., 2008; Messié and Chavez et al., 2015]. During summer, Chl is confined a thin surface layer where nutrients are consumed [Messié and Chavez, 2015]. Thus, nutrient limitation is triggered by a stronger stratification and a thinner mixed layer (thus less light limitation) as the wind-forced upwelling is weaker [Gutiérrez et al., 2011a]. In contrast, stronger winds and deeper MLD are encountered in winter [Fig.15; Echevin et al., 2008]. In these conditions, the phytoplankton cells reach depths close to the “critical depth” (zones with low light; Sverdrup [1953]). Thus, productivity decreases due to enhanced light limitation. Echevin et al. [2008], using a physical-biogeochemical model, suppressed the seasonality of the surface insolation, which impacted the amplitude of the Chl signal but not the seasonal variations of Chl. These results are in line with Calienes et al. [1985], who found maximums of Chl under different isolation rates, mentioning that it could be due to changes of MLD.
Figure 15. Chl (from SeaWiFS data (1997–2006); green bars), alongshore wind (from ECMWF–ERA40 reanalysis; black line), and SST climatology (red line) at Pisco (15°S). The red line joins the monthly SST‐means from Pisco pier SST and GHRSST. From Gutiérrez et al [2011a].
The role of iron in the seasonal cycle of productivity has also been analysed. Messié and Chavez [2015] found that both light limitation and iron limitation impacts the Chl decrease during winter, owing to the larger iron demand under low light conditions [Sunda and Huntsman, 1997]. Echevin et al. [2008] demonstrated in a model sensitivity experiment, that productivity increases mainly between 13°S – 14°S from June to October (~ + 80%) when iron limitation is artificially relaxed.
24
1.5. The Oxygen Minimum Zone
Oxygen Minimum Zones (OMZ) are large water bodies of the open ocean which present low concentration of dissolved oxygen (DO < 22 µmol.kg-1) at subsurface depths (~ 50 – 900 m) [Karstensen et al., 2008]. The PCUS OMZ is one of the most intense and shallowest OMZ in the open ocean [Paulmier and Ruiz-Pino, 2009]. Complex physical and biogeochemical processes are involved in the PCUS OMZ formation and maintenance:
a) Vertical mixing between the oxygenated surface mixed layer and OMZ waters is reduced due to the relatively weak PCUS winds. Moreover, the permanent strong pycnocline [Fiedler and Talley, 2006] mitigates vertical mixing. Additionally, the PCUS OMZ is located in the unventilated “shadow zone” of the South Eastern Pacific [Luyten et al., 1983].
b) The residence time of OMZ waters is very long. Czeschel et al. [2011] found that the OMZ center is a stagnant area: a deployed float at 8°S in the OMZ core was found at the same location after 15 months.
c) The EUC and Tsuchiya jets ventilate the OMZ, which is sensitive to their changes. Tsuchiya jets transport oxygenated waters eastward which impact directly the PCUS OMZ. Nevertheless, the oxygen content of the EUC and Tsuchiya jests decrease from west to east [Stramma et al., 2010]. Montes et al. [2014], using a physical-biogeochemical coupled model, simulated the change in PCUS OMZ due to different intensities of the equatorial circulation. They evidenced a shrinking of OMZ when the secondary Tsuchiya jets was more intense (Fig. 16).
Figure 16. Meridional sections of oxygen annual mean (in µmol kg-1) at 88 °W from two simulations with different equatorial circulation. In contours are shown the zonal currents (in cm s-1). Figure from Montes et al. [2014].
25 d) The mesoscale circulation plays a role in the shaping the OMZ. Vergara et al. [2016] found that mesoscale structures ventilate the OMZ at its lateral boundaries between 100 – 600 m depth (Fig. 17). Besides, nearshore (sub) mesoescale filaments and fronts ventilate the OMZ across its upper limit (Fig. 18; Thomsen et al. [2016]).
e) The large amount of organic matter (OM), which originates from the high surface productivity, eventually sinks into the OMZ and gets remineralized. In this process, OM is oxidized by the microbial pool that produces a high oxygen consumption [e.g. Cavan et al., 2017].
Figure 17. Module (color scale) and direction (black arrows) of the mean DO eddy-flux vector at (a) 100 m, (b) 250 m, (c) 350m and (d) 700m depths. White contours correspond to the 45, 20 and 10 μmol kg-1 mean DO values. From Vergara et al. [2016].
Figure 18. Cross-shore oxygen transect (glider measurements) in a submesoscale cold filament off Peru in January/February 2013. From Thomsen et al. [2016].
The PCUS OMZ is located alongshore and extends westward near 8°S (Fig. 19a). It is thickest between 5°S – 13°S and 500 km offshore. Nearshore, the upper limit of the OMZ (ZO2, proxy of the oxycline in the coastal region) is located at 30 – 50 m depth [Graco et al., 2007].
26 The nearshore OMZ is shallowest between 12°S – 16°S and deepens north of 8°S (Fig. 19). Extremely shallow depths can be reached, such as ZO2~2.5 m during summer 2006 [Ledesma et al., 2011]. Offshore at 85°S, the lower OMZ limit reaches ~ 600 m depth between 4°S – 15°S. The OMZ core can present values less than 5 µmol kg-1 and reaches anoxic conditions (e.g. Czeschel et al. [2015]; Thomsen et al. [2016]). The OMZ core extends vertically between ~ 150 – 500 m depth and at 85°W between 2°S and 18°S [Karstensen et al., 2008].
Figure 19. Annual mean depth of the upper OMZ limit (in meters, contour) and OMZ thickness (in meters, colour) from Fuenzalida et al. [2009] (a). Oxygen vertical profiles at different latitudes (IMARPE data) from Graco et al. [2007] (b). Alongshore oxygen concentration [Ledesma et al., 2011] (c). (b) and (c) are in mL L-1 and 1 mL L-1 is equivalent to 44 µmol L-1. The PCUS OMZ presents a seasonal cycle related to the wind-driven coastal upwelling, intense remineralization and the mesoscale circulation (eddies and filaments) [Vergara et al. 2016]. During summer, a decrease of DO and a shoaling of the OMZ are observed. DO decrease
27 is triggered by the decay of enhanced productivity, which induces high remineralization. Additionally, an intense stratification isolates the subsurface waters from oxygenated surface layer. During winter, a deeper OMZ is found. It is mainly due to the well-mixed water column triggered by enhanced wind stress, while the lower productivity does not have a strong impact in the DO. In this season, the offshore OMZ is ventilated by offshore DO eddy fluxes [Vergara et al., 2016]. Zuta and Guillén [1970], using in situ data, also evidenced the oxygen seasonality in the surface layer. They found DO values of ~ 75 µmol kg-1 and ~ 90 µmol kg-1 during summer and winter respectively, between 0 – 100 m off Callao (12°S).
2. ENSO as driver of the PCUS Interannual Variability
In this section, the main impacts of EN and LN events on the PCUS are described, with emphasis on biogeochemical processes. EN events present different spatial structures. Two types of El Niño have been identified: the so-called “central Pacific” (CP) El Niño (also known as Modoki EN) [Takahashi et al., 2011] and the “Eastern Pacific” (EP) El Niño (also known as Canonical EN) (e.g. 1982-1983, 1997-1998 EN). These EN types have different impacts in the PCUS. For instance, models outputs and satellites data evidenced that the CP EN is related to negative (positive) SST anomalies in the PCUS, while the EP EN presents strong positive (negative) SST anomalies in the Eastern Pacific Ocean [Dewitte et al., 2012; Lee et al., 2014]. These different impacts of the CP and EP EN are associated with the upwelling and downwelling CTW respectively, generated by the equatorial Kelvin waves (see section 2 and 3; Dewitte et al., [2012]). In this section, the impacts of EP EN and LN events off the Peruvian coasts are described.
2.1. Impacts of El Niño events
EN is an ocean-atmospheric coupled phenomenon occuring in the Equatorial Pacific. It occurs every 3 to 5 years and substantially alters the ecosystem functioning associated to coastal upwelling. During EN a weakening of the trade winds in the western equatorial Pacific triggers the eastward displacement of the warm pool [Picaut et al., 1996]. It generates positive SST anomalies in the Central and Eastern Pacific Ocean. The subsurface ocean structure is also impacted. The equatorial thermocline, typically deeper in the Western Equatorial Pacific, deepens in the Eastern Pacific (Fig 20). These changes in ocean conditions are associated to a weakening of the atmospheric pressure in the Eastern Pacific and to a southward displacement of the Intertropical Convergence Zone (ITCZ).
28 Figure 20. Schematic representation of the modifications of the oceanic and atmospheric zonal circulation during El Niño (left panel) and La Niña (right panel) in the equator. Figure from https://pirca.org.
The westerly winds anomalies generate Equatorial Kelvin Waves (EKW), which propagate eastward across the Equatorial Pacific [Kessler and McPhaden, 1995]. When they reach the coasts of America (Ecuador), EKW trigger Coastal Trapped Waves (CTW), which propagate poleward along the coasts of Peru and Chile. EKW generation occurs every year. However, “warm” (downwelling) and “cold” (upwelling) CTWs are particularly frequent and intense during EN and LN events respectively [McPhaden, 1999; Picaut et al., 2002].
In contrast with LN, EN events strongly impact oceanic conditions in the PCUS. During the propagation of CTW, the Sea Surface Height (SSH) rises. Carr and Broad [2000] using satellite data, showed that two SSH rises (~20 cm anomalies) were found during the 1982-1983 and 1997-1998 EN events (see also Colas et al., [2008]).
29 Figure 21. Interannual variability of (a) sea surface temperature (°C), (b) surface salinity (UPS), (c) depth of the 15 °C isotherm (meters), (d) depth of the 1ml L-1 iso-oxygen at the base of the oxycline (meters), (e) surface chloroplyll-a content (mg m-3). The timeseries are monthly averages calculated from IMARPE data (period: 1960–2008; latitude range: 3.5°S–20°S, distance to the coast: 0–100km). Shaded rectangles correspond to El Niño events. From Gutiérrez et al. [2016].
The nearshore temperature and salinity are also strongly impacted (Fig. 21) [Gutiérrez et al., 2016]. Using an extended data set from IMARPE (1960 – 2014), Grados et al. [2018] computed temperature and salinity anomalies composites during EN (Fig. 22) and LN (Fig. 26). During EN, the positive SST anomalies reach maximum values on the Peruvian shelf (~3-4°C) and decrease south of 16°S (~1-1.5°C) (Fig. 22a). The warm waters are observed from the surface to ~ 150 m depth, and the maximum positive anomalies (~ +3°C) are found at 20 m depth between 5°S – 12 °S (Fig. 22b). For example, at Callao station (~12°S), the thermocline (defined as isotherm of 15°C) was found at large depths (~ 100 m depth) during 1997-1998 EN [Barber and Chavez, 1983; Gutiérrez et al., 2008; Graco et al., 2017]. The warming is initiated by the “warm” downwelling CTWs which deepen the thermocline during their propagation, an sustained by the horizontal advection of positive SST anomalies [Chavez et al., 1984] associated with the intrusion of Equatorial Surface Water (ESW) and Tropical Surface
30 Water (TSW) in the coastal region [Flores et al., 2013]. Furthermore, more saline waters are observed between 7°S – 20°S. Flores et al. [2013] found values up to ~35.5 during 1982-1983 and 1997-1998 EN events. The highest positive salinity anomalies were observed in the center-south region of Peruvian coast (12°S – 20°S) and between surface and 100 m depth (Fig. 22c, d). Thus, the halocline deepens due to an onshore transport of the Subtropical Surface Waters (STSW) [Grados et al., 2018] and the presence of Equatorial Subsurface Water (ESSW) [Llanillo et al., 2013].
Figure 22. Temperature (in °C, top panel) and salinity (in ups, bottom panel) anomalies during El Niño at surface (left) and within alongshore between 0 and 300m depth (right). From Grados et al. [2018].
The CTWs also impact the biogeochemical conditions. Echevin et al. [2014], using a regional model, demonstrated that the passage of the downwelling (upwelling) CTW triggers the deepening (shoaling) of the thermocline and nutricline. Negative (positive) Chl anomalies also propagate poleward, although with slower propagation speed than the physical signal (Fig. 23).
31 Figure 23. Time-latitude diagram of (a) sea level (in m), (b) depth of the 2 μmol L-1 iso-nitrate (in m), (c) depth of the 17°C isotherm (in m), and (d) surface chlorophyll anomalies (in mg m -3) from a ROMS-PISCES simulation. All variables have been averaged in a 100-km-wide coastal band, and band-pass filtered in the [50-80] days band to highlight the intraseasonal signal. From Echevin et al. [2014].
Nutrient-poor waters are also found offshore of the PCUS during EN. Barber and Chavez [1983] evidenced a marked nitrate decrease during 1982–1983 EN: nitrate was lower than 4 µmol L-1 (12 µmol L-1 in neutral periods) at 85°W between 0°S and 10°S and above 50 m (Fig. 24a). Near the coast at 12°S, Graco et al. [2017] observed a nitrate decrease during the 1997–1998 EN peak. The isolines of 15 µmol L-1 for nitrate, 10 µmol L-1 for silicate (Fig. 24b) and 1 µmol L-1 for phosphate reached greater depths (~ 100 m) than during normal conditions. In addition to CTWs, the onshore displacements of the ESW and TSW might reduce the nutrient concentration close to the coast [Graco et al., 2007].
32 Figure 24. Nitrate concentration off Peru during neutral and El Niño periods from Barber and Chavez [1983] (a). Evolution of the silicate concentration (from 1996 to 2010) from Graco et al. [2017] (b) and oxygen (from 1993 to 2006) from Gutiérrez et al. [2008] (c) at Callao station (12°S).
Expectedly, productivity is strongly impacted during EN (Fig 25). During the last decades, the lowest Chl concentration was observed during 1982-1983 and 1997-1998 EN [Calienes et al., 2014; Gutiérrez et al., 2016]. Strong negative Chl anomalies (< –1 mg m-3) were evidenced using SeaWIFS data during the strong 1997-1998 EN (Fig. 25a, b), mainly between 5°S – 16°S, suggesting that the offshore extension of high Chl coastal band was reduced [Thomas et al, 2001; Carr et al., 2002; Thomas et al., 2009]. A merged SeaWIFS– MODIS product was used to compute EN and LN composites from 1997 to 2017. EN presents negative Chl anomalies alongshore. However, the productivity was less impacted within ~ 20 km to the coast (Fig. 25c). Barber and Chavez [1983] also evidenced a productive narrow coastal band during the 1982-1983 EN, in March 1983. Calienes et al. [2014] hypothesized that
33 this might be triggered by the nutrient discharge from the Guayas River off Ecuador transported poleward during EN.
Figure 25. Annual variation of Chl between 1996 and 1999 (a) [Carr et al., 2002]. Chl anomalies alongshore from 1997 to 2008 averaged in a coastal band [Thomas et al., 2009] (b). Mean of Chl anomalies during El Niño (c). (a) and (b) come from SeaWIFS data and (c) from SeaWIFS-MODIS product.
The Chl decrease during EN could be due to various processes: (i) strong downwelling CTWs, which deepen the thermocline/nutricline; (ii) changes in equatorial circulation, which triggers changes in the intensity of nutrient transport fueling the PCUC, and (iii) changes in the mesoscale activity. Gruber et al. [2011] demonstrated that mesoscale eddies and filaments subduct and transports nutrients offshore in the California and West African EBUS. During EN, the frequent passage of intense CTWs may generate enhanced baroclinic instabilities and an EKE increase [Chaigneau et al., 2008]. Mogollon and Calil [2017] found an offshore and downward nitrate eddy fluxes at Pisco (~ 12°S) in a model study of the 1997-1998 EN.
The impact of EN on phytoplankton community has been documented. Diatoms, the most abundant specie in the Peruvian waters [Sánchez, 2000], dominate during cold periods (mainly near 13°S – 16°S), whereas dinoflagellates (smaller phytoplankton cells) dominate in warm periods [Ochoa et al. 2010]. During 1982-1983 EN, Calienes et al. [2014] evidenced abundant presence of the dinoflagellate Chaetoceros atlanticus. It could be due to the presence
34 of offshore waters, which present typically smaller phytoplankton species more tolerant to conditions of stress (e.g. low nutrient levels).
Oxygenated waters are present nearshore during EN [e.g. Llanillo et al., 2013]. Gutiérrez et al [2016] showed a deepening of the oxycline during most EN events (between 1960 and 2008; Fig. 24c). During strong 1997-1998 EN, the oxycline reached ~ 100 m depth at 12°S. Other episodes of less intense oxygenation correspond to moderate EN events (e.g. 2002 – 2003) [Gutiérrez et al., 2008; Graco et al., 2017]. Furthermore, the oxygenation during EN event varies with latitude. Mogollón and Calil [2017]'s regional model simulated a nearshore OMZ vanishing at Chimbote (9°S) during 1997–1998 EN. It was deeper than during normal conditions but persisted further south, off Callao (~ 12°S) and Pisco (~ 15°S). The OMZ core could also be reduced during EN [Llanillo et al., 2013; Yang et al., 2017] and even disappear from the water column [e.g. Gutiérrez et al., 2008; Graco et al., 2017]. Overall, the volume of the PCUS OMZ core could decrease by ~60% with respect to neutral conditions in the PCUS [Yang et al., 2017]. The strong correlation between of the oxycline and thermocline depth variations due to the impact of CTWs [Graco et al., 2017] has been observed for other OMZ regions, as along the west coasts of India. There Vallivattathillam et al. [2017] found a correlation between oxycline and thermocline depths close to 1.0 and 0.9 at seasonal cycle and interannual time scales, respectively. This shows the important role of the remote forcing (e.g. CTWs) in the interannual variability of the OMZ.
Oxygen fluxes into the PCUS associated with the equatorial jets (EUC and Tsushiya jets) contribute to the enhanced ventilation of the OMZ during EN. Stramma et al. [2016] found a strong weakening of the EUC during the onset (October) of 2015 – 2016 EN. However, the SSCCs increase during EN, as shown by Montes et al. [2011] for the moderate 2002-2003 EN. The enhanced eastward SSCC flux of oxygen could thus reduce the offshore OMZ [Montes et al., 2014].
2.2. Impacts of La Niña events
LN is characterized by enhanced easterly trade winds and the predominance of cold waters in the surface and subsurface layer in the Central and Eastern Equatorial Pacific. In the PCUS, upwelling-favorable winds are intensified. Negative SST anomalies (Fig. 26) [Moron et al., 2000; Grados et al., 2018], poorly-oxygenated waters [Graco et al., 2007; Mogollón and
35 Calil, 2017] and slightly higher phytoplankton biomass (Fig. 27) [Calienes et al., 2014; Gutiérrez et al., 2016] are observed.
The cold (15 – 16 °C) and fresh waters (34.9 – 35) span alongshore and present an offshore extension. The negative SST (from -1°C to -3°C) and salinity (from -0.1 ups to -0.15 ups) anomalies predominate alongshore. However, maximum values are observed offshore (Fig. 26a, b). This could be due to an enhanced Ekman transport triggering a large offshore displacement of near-shore cold waters [Grados et al., 2018].
At subsurface, relatively strong negative SST anomalies are observed north of 12°S and above 50 m (< - 1°C, Fig. 26b). Negative salinity anomalies (< - 0.1) are distributed mainly in three regions above 50 m: 1°S – 4°S, 11°S – 14°S and 17°S – 20°S (Fig. 26d). The shoaling of the thermocline/halocline is related to the passage of upwelling CTWs [Echevin et al., 2014] and enhanced wind forced upwelling.
Figure 26. Temperature (in °C, top panel) and salinity (in ups, bottom panel) anomalies at surface (left) and at subsurface alongshore (right) during La Niña. From Grados et al. [2018]. A shoaling of the OMZ and nutricline are also evidenced during LN, partly due to the same processes generating an enhanced upwelling. During the 2009 LN, Llanillo et al. [2013] evidenced an increase of nitrate between 3°S and 10°S offshore at 86°W. During this event, the 25 µmol L-1 nitrate isoline reached the surface owing to an upward flux of nutrient-rich ESSW.
36 Mogollón and Calil [2017] simulation displays an increase of nitrate below 20 m off Chimbote (9°S), Callao (12°S) and Pisco (15°S) during the 1998 – 1999 LN. In contrast, Graco et al. [2017] observed a nitrate decrease off Callao during the same event, which they related to an intensification of the OMZ producing a nitrogen loss. Thus, nitrate loss (by annamox and denitrification) may increase during LN, due to the expansion of the volume of the OMZ core [Yang et al., 2017]. Denitrification and anammox are responsible for 30% and 70% of the nitrogen loss respectively, with high production of N2O [Graco et al., 2007; Mogollón and Calil, 2017] in LN conditions.
In situ observations do not indicate a higher productivity during LN than during neutral periods from in situ data. Using SeaWIFS data, Thomas et al. [2009] and Carr et al. [2002] evidenced an alternation of positive and negative Chl anomalies alongshore. A LN composite displays positive Chl anomalies (0.5 – 1.5 mg m-3) within the 200 km to the coast. The highest anomalies are found between 12°S – 14°S. In contrast, slightly negative Chl anomalies are observed within the 20 km to the coast and between 6°S – 9°S. They could be produced by the stronger Ekman transport, which displaces further offshore the Chlorophyll-rich waters.
Figure 27. Mean of Chl anomalies (in mg m-3) during La Niña from SeaWIFS-MODIS satellite data (Sept. 1997 to Dec. 2017).
37
3. Long Term Variability
3.1. SST and wind trends in the PCUS
During the last century an SST increase was evidenced in the global ocean [Smith et al., 2008] associated to the increase of the CO2 emissions (mainly in the last 50 years). In contrast, the PCUS SST decreased between 1950 and 2010, mainly in the center-south coastal region [Gutiérrez et al., 2011b; Fig. 28]. The SST trend spatial pattern is not homogeneous along the Peruvian coast. IMARPE in situ SST data show a positive trend in the north of Peru at Paita (~ 5°S) (+ 0.26 °C dec-1), whereas no trend is found at Chicama (7°S) and at Chimbote (9°S). Along the southern coast between Callao (~ 12°S) to Ilo (~ 17°S), negative SST trend predominates, with maximum values at Callao and at San Juan (~ - 0.42 °C dec-1) [Gutiérrez et al., 2011b] (Fig. 28a). The Reynolds SST product, which merges data from buoys, ships and satellite [Reynolds et al., 2007], also shows the contrast between positive and negative SST trends alongshore (from 1984 to 2010; Fig. 28b). Dewitte et al. [2012], using the ROMS model, reproduced an SST decrease and a shoaling of the thermocline between 3°S – 18°S from 1958 to 2008.
Figure 28. Timeseries of SST from IMARPE coastal stations (in °C) (a) and spatial pattern of the SST trend from Reynold database (in °C dec-1) (b). From Gutiérrez et al. [2011b].
38 Previous works mentioned that the coastal cooling might be related to the increase of the coastal upwelling during the last years [Gutiérrez et al., 2011a, 2011b; Demarcq, 2009; Narayan et al., 2010]. An increase of alongshore windstress has been reported by Bakun [1990] in the major EBUS and off the Peruvian coasts (from 4.5°S to 14.5°S). Bakun [1990] suggested that enhanced cross–shore atmospheric pressure gradient, which supports the alongshore geostrophic wind, could trigger the wind increase. The increase of the cross–shore pressure gradient is associated to enhanced land-sea thermal gradient [Falvey and Garreaud, 2009]. The increased land-sea thermal gradient could be created by a stronger shortwave downward flux over land associated to a reduction of nearshore cloudiness (e.g. during EN; Enfied, 1981). Besides, Bakun [2010, 2015] suggested that radiative cooling during night time may be suppressed due to the increase in greenhouse gas (e.g. CO2 or water vapour during EN) concentration, generating a warmer land surface (Fig. 29). Bakun’s hypothesis about the increase of the winds in EBUS due to climate change has been supported by some studies (e.g. Sydeman et al. [2014]). However, Chamorro et al. [2018], using an atmospheric model, demonstrated that the increase of the winds during EN events is due to alongshore SST gradients instead of sea-land temperature gradient.
Figure 29. Low-passed (12-month running means) Southern Oscillation Index (SOI), upwelling favorable wind stress off Peru, ‘precipitable water’ (or ‘total water column water vapor’) from the National Centre for Environmental Prediction (NCEP) and European Centre for Medium-range Weather Forecasts (ECMWF) reanalysis data sets, at a grid point near the Peru coast (10°S, 80°W). Gray vertical bars identify EN periods. From Bakun et al. [2010]
Jacox et al. [2015] evaluated the influence of the remote (e.g CTW) and local (e.g. winds) forcing in the oceanic trends in the Californian EBUS. They showed that the positive
39 wind trend increases the upwelling and drives the negative SST trend. In the PCUS, the different wind datasets do not agree on the amplitude of the trends. Gutiérrez et al. [2011a] using the ERA-40 Reanalysis, Bakun at al. [1990, 2008, 2010, 2015] using ICOADS observations and Varela et al. [2015] using the NCEP CFSR reanalysis, found a positive wind trend mainly south of 15°S. In contrast, Goubanova et al. [2010], using a statistical downscaling of NCEP at ~50 km scales (i.e. the wind product used in the model simulations presented in Chapters 3, 4 and 5), found no significant wind trend between 1958 and 2008. Last, Narayan et al. [2010], using NCEP/NCAR reanalysis dataset, showed a negative wind trend between 10°S – 16°S from 1960 to 2006.
3.2. Biogeochemical trends in the PCUS
Biogeochemical trends, such as the increase of coastal productivity and nutrients concentration, an enhanced deoxygenation of the water column, have been evidenced over periods of several decades in the PCUS.
A productivity increase has been observed using in situ [Gutiérrez et al., 2011a; 2016] and satellite data [Demarcq, 2009]. Using SeaWIFS data from Sept. 1998 to Dec. 2007, the latter found a significant positive Chl trend (1.5 – 2 mg m-3 dec-1) in most EBUS. In the PCUS, a strong Chl increase was observed mainly between 7°S – 15°S (> 1 mg m-3 dec-1) (Fig. 30a). The authors evidenced the strong consistency between the productivity increases and enhanced upwelling-favorable winds (based on QuikSCAT satellite wind data). Gutiérrez et al. [2011a, 2016] evidenced a positive Chl trend (0.7 mg m-3 dec-1) at ~ 14°S from in situ data between 1965 to 2005 (Fig. 30b). They also evidenced a significant positive wind trend (from ERA – 40) during spring. Thus, this study hypothesized that the wind increase during warming seasons could influence the positive productivity trend provided the wind mixing depth does not exceed critical levels for phytoplankton growth. Furthermore, the productivity increase could be related to a greater input of nutrients from the offshore equatorial region. Czeschel et al. [2015] found significant positive subsurface (50-300 m) nitrate and phosphate trends in the EUC (2°N – 2°S) and SSCC (5°S – 8°S) latitude ranges, at 84°W – 87°W, whereas silicate does not present a significant trend (Fig. 31).
40 Figure 30. (a) Surface Chl trend from SeaWIFS (1997-2007) [Demarcq et al., 2009] and (b) IMARPE data off Pisco (14°S) (1965 -2005) [Gutiérrez et al., 2011a].
Figure 31. (a) Oxygen, (b) nitrate, (c) phosphate, and (d) silicate trends (in μmol kg−1 yr−1) computed between 50–300 m, 2°S–5°S and 84°W–87°W from 1976 to 2010. From Czeschel et al. [2015].
During the last decades, a progressive deoxygenation was observed in the open ocean [Stramma et al., 2008; Breitburg et al., 2018; Duteil et al., 2018]. Stramma et al. [2008] showed that the oxygen decreased at intermediate waters (300 – 700 m) in the eastern Tropical Atlantic and the Equatorial Pacific between 1960 and 2008. They also found an expansion of the OMZ
41 thickness at 100°W (Fig. 32). Desoxygenation in the eastern equatorial Pacific could be related to the positive phase of Pacific Decadal Oscillation (PDO) [Duteil et al., 2018] in recent decades. Indeed, a positive PDO phase is associated by a decrease of the equatorial trade winds and a slow-down of the eastward equatorial circulation (i.e. EUC).
Figure 32. Vertical structure of the oxygen evolution (in µmol kg-1, 5°S – 5°N,105°W - 115°W) between 1960 and 2008. The thick white line represents the isolines of 66 µmol kg-1. Figure from Stramma et al. [2008].
A deoxygenation was also evidenced in the PCUS. The OMZ upper limit shoaled during the last decades. Using shipboard measurements from IMARPE, Bertrand et al. [2011] and Gutiérrez et al. [2016] found a shoaling of the isoline of 22 µmol kg-1 (the upper limit of the “biogeochemical OMZ”) and 88 µmol kg-1 (upper limit of the “biological OMZ”) in the coastal region between 6°S – 14°S, from 1980 to 2008. Before the 80's, the PCUS was getting more ventilated. This interdecadal variability of the coastal oxycline depth is associated to the PDO [Bertrand et al., 2011]. Deoxygenation could be driven by different processes: (i) an increase in oxygen consumption caused by an increase in productivity and export of OM, (ii) a decrease of ventilation associated with the equatorial undercurrents (Fig.33a), mainly the EUC and pSSCC [Stramma et al., 2010]. Czechel et al. [2015] evidenced a subsurface oxygen decrease (by ~50 µmol kg-1) between 1993 to 2009 in the equatorial offshore regions where the equatorial undercurrents are located (Fig. 31d).
In contrast, an oxygenation of the nearshore upper water column (0-100m) was observed by in situ data at ~ 12°S during the last decade [Graco et al., 2017]. It seems to be related to more frequent downwelling CTWs, which deepen the coastal oxycline (Fig. 33b).
42 Figure 33. Distribution of oxygen differences (μmol kg−1, in color) between February 2009 and March 1993 at 85°50′W (a). Zonal velocity differences from ADCP measurements are also shown (black contours, in cm s−1) (a). Evolution of oxygen anomalies in the water column at Callao station (12°S, in μmol kg−1) (b). Black line represents the isoline of 44 μmol kg−1. Figures adapted from Czechel et al. [2015] (a) and Graco et al. 2017 (b).
4. Biogeochemical Modelling Studies
Models allow to study processes in the ocean, which are often difficult to observe in situ. The possibility to formulate experiments to test different hypotheses make them very useful tools. Both relatively simple and more complex physical-biogeochemical models have been used to investigate the main physical and biogeochemical processes and their interplay in the PCUS. One of the model most widely used in the PCUS is the Regional Ocean Modelling System (ROMS) [Shcheptekin and Mcwilliams, 2005]. ROMS was first used to simulate the seasonal variability of temperature, salinity and currents in the PCUS [Penven et al., 2005], to investigate the pathways of the PCUC source waters [Montes et al., 2010] and their variability during ENSO phases [Montes et al., 2011]. Dewitte et al. [2012] reproduced the interannual variability and trends of the SST and thermocline during the last 50 years using ROMS forced at open boundaries by the SODA reanalysis. Colas et al. [2008] focused on the dynamics of the 1997 – 1998 EN. Belmadani et al. [2012] studied the propagation of the intraseasonal CTW and their impact on Rossby waves and mesoscale eddies. Colas et al. [2013] focused on the role and impact of the mesoscale variability on the cross-shore transport of heat. ROMS was used to evaluate the response of the PCUS to regional climate change. An enhanced stratification of the water column and increase of coastal SST have been evidenced by Echevin et al. [2011] and Oerder et al. [2015] under pessimistic climate projections (e.g. the idealized 4xCO2 scenario).


![Figure 10. Schematic of the oceanic Nitrogen cycle. From Lam et al. [2009].](https://thumb-eu.123doks.com/thumbv2/123doknet/14593720.730321/21.892.264.629.188.450/figure-schematic-oceanic-nitrogen-cycle-lam-et-al.webp)


![Figure 25. Annual variation of Chl between 1996 and 1999 (a) [Carr et al., 2002]. Chl anomalies alongshore from 1997 to 2008 averaged in a coastal band [Thomas et al., 2009] (b)](https://thumb-eu.123doks.com/thumbv2/123doknet/14593720.730321/35.892.144.754.200.536/figure-annual-variation-anomalies-alongshore-averaged-coastal-thomas.webp)