EUROPEAN ORGANISATION FOR NUCLEAR RESEARCH (CERN)
JHEP 05 (2019) 164
DOI:10.1007/JHEP05(2019)164
CERN-EP-2018-226 19th August 2019
Search for single production of vector-like quarks
decaying into W b in p p collisions at
√
s
= 13 TeV
with the ATLAS detector
The ATLAS Collaboration
A search for singly produced vector-like quarks Q, where Q can be either a T quark with charge +2/3 or a Y quark with charge −4/3, is performed in proton–proton collision data at
a centre-of-mass energy of 13 TeV corresponding to an integrated luminosity of 36.1 fb−1,
recorded with the ATLAS detector at the LHC in 2015 and 2016. The analysis targets Q → W b decays where the W boson decays leptonically. No significant deviation from the expected Standard Model background is observed. Upper limits are set on the QW b coupling strength and the mixing between the Standard Model sector and a singlet T quark or a Y quark from a (B, Y ) doublet or a (T, B, Y ) triplet, taking into account the interference effects with the Standard Model background. The upper limits set on the mixing angle are as small as
| sin θL| = 0.18 for a singlet T quark of mass 800 GeV, | sin θR|= 0.17 for a Y quark of mass
800 GeV in a (B, Y ) doublet model and | sin θL| = 0.16 for a Y quark of mass 800 GeV in a
(T, B, Y) triplet model. Within a (B,Y) doublet model, the limits set on the mixing parameter
| sin θR| are comparable with the exclusion limits from electroweak precision observables in
the mass range between about 900 GeV and 1250 GeV.
© 2019 CERN for the benefit of the ATLAS Collaboration.
Contents
1 Introduction 2
2 ATLAS detector 5
3 Physics object reconstruction 6
4 Background and signal modelling 8
4.1 Background modelling 8
4.2 Signal modelling 10
5 Event selection and background estimation 12
5.1 Signal and control regions definition 13
5.2 Estimation of non-prompt and fake lepton backgrounds 14
5.3 Signal candidate mass reconstruction 15
6 Systematic uncertainties 16
6.1 Experimental uncertainties 18
6.2 Theoretical modelling uncertainties 19
7 Results 20
7.1 Statistical interpretation 20
7.2 Fit results 20
7.3 Limits on the VLQ production 24
8 Conclusion 31
1 Introduction
Vector-like quarks (VLQs) are hypothetical spin-1/2 coloured particles with left-handed and right-handed components that transform in the same way under the Standard Model (SM) gauge group. Therefore, their
masses are not generated by a Yukawa coupling to the Higgs boson [1]. While the discovery of the Higgs
boson (H) at the Large Hadron Collider (LHC) [2,3] excludes a perturbative, fourth generation of chiral
quarks [4], since their contribution to loop-mediated Higgs boson couplings would significantly alter the
production cross-section and the decay rates of the Higgs boson, the effects on Higgs boson production and decay rates from loop diagrams including VLQs are much smaller than the uncertainty in the current
measurements [1]. In many models, VLQs mix mainly with the SM quarks of the third generation due to
the large masses of the bottom and top quarks [5,6]. Vector-like quarks appear in several extensions of the
SM that address the hierarchy problem, such as extra dimensions [7], composite Higgs [8,9] and Little
Higgs [10] models, where they are added to the SM in multiplets. They can also appear in supersymmetric
models [11] and are able to stabilise the electroweak vacuum [12].
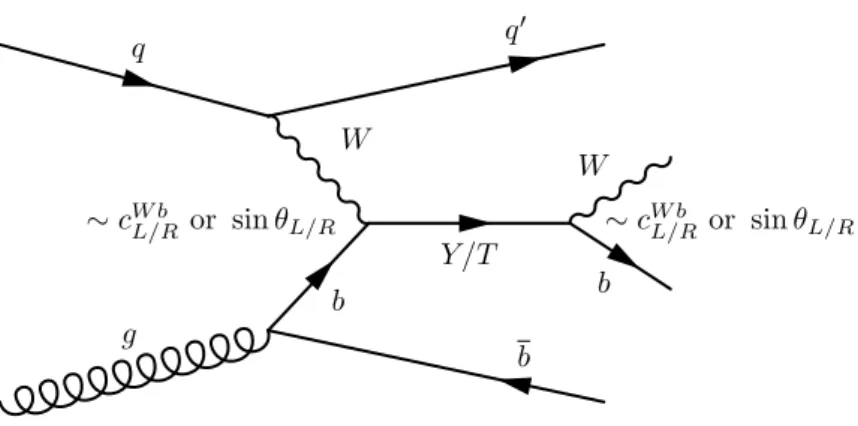
This analysis concentrates on searches for single production of heavy vector-like quarks Q produced in proton–proton (pp) collisions via W b fusion, pp → Qqb + X, with a subsequent decay Q → W b. Here Q can be either a T quark with charge +2/3 or a Y quark with charge −4/3 or their antiquarks. An example
g q b W q0 b W Y /T b ∼ cW b L/Ror sin θL/R ∼ cW bL/Ror sin θL/R
Figure 1: Leading-order Feynman diagram for single Y /T production in W b fusion and subsequent decay into W b. The production amplitude scales with sin θL,R[1] or c
W b
L,R [13,14] as described in the text.
Vector-like T quarks can belong to any weak-isospin multiplet, while Y quarks cannot exist as singlets. The interpretation used in this analysis focuses on Y quarks from a (B, Y ) doublet or a (T, B, Y ) triplet, and on
singlet T quarks, since T quarks in a (T, B, Y ) triplet do not couple to W b [1]. For singlet T quarks, the
branching ratios (Bs) are model- and mass-dependent, but in the high-mass limit, which is considered in
this analysis, they converge towards 2:1:1 (W b:Zt:Ht) [1]. Due to its charge, the Y quark can decay only
into W b and therefore B(Y → W b) = 100%. As a consequence, Y quarks can be singly produced in pp collisions only via W b fusion, while T quarks can be produced not only by W b fusion but also by Zt and Ht fusion.
Single production of vector-like quarks is enabled by their coupling to SM quarks. As a result, searches for singly produced VLQs in pp collisions can be used to probe these couplings as a function of the VLQ mass, whereas searches for pair-produced VLQs allow limits to be set on VLQ masses; these mass limits are rather insensitive to the couplings. because the signals are produced through strong couplings. At high VLQ masses, single VLQ production can become the dominant production mechanism at the LHC, depending on the strength of the Qqb coupling. Results are presented here for two different models that use different formulations of the Lagrangian that describes these new particles and their interactions. In the
model discussed in Ref. [1] (renormalisable theory), a mixing term between the SM and vector-like quarks
is introduced in a renormalisable extension of the SM, while Refs. [13,14] (non-renormalisable theory) use
a phenomenological Lagrangian that is parameterised with coupling terms, but is non-renormalisable. The
main difference between these approaches is that the Lagrangian in Refs. [13,14] has additional terms that
allow larger production cross-sections, while the Lagrangian in Ref. [1] gives a complete description of the
dependence of the B on the multiplet dimension, with left- and right-handed mixing angles θLand θRas
model parameters. Within a given multiplet, θLand θRare functionally related. Therefore, a given value of
either the left- or right-handed mixing angle fully determines all Bs for any given heavy-quark mass. For the
interpretation in terms of coupling parameters cW bL and cW bR as introduced in Refs. [13,14], assumptions
must be made about the Q → W b, Q → Zt and Q → Ht Bs in case of Q = T . The relative contribution of the left- and right-handed components of the mixing and coupling also depends on the dimension of the
VLQ multiplet. For T singlets, only the left-handed component (sin θL or cW bL ) contributes. For a (B, Y )
doublet model, results are interpreted in terms of the dominant right-handed (sin θR) component; for a
(T, B, Y) triplet model, results are interpreted in terms of the dominant left-handed (sin θL) component [1].
The formulation of Ref. [1] also allows within a certain multiplet model a comparison of the mixing angles
with constraints from electroweak precision observables, such as the ratio Rb of the partial width for
Z → b ¯b to the total hadronic Z-boson width and the oblique parameters S and T [15]. A comparison of
the respective Lagrangians of the renormalisable models described in Ref. [1] and the non-renormalisable
models described in Refs. [13,14] yields a simple relation between sin θL,Rand cW bL,R: cW bL,R =
√
2 sin θL,R
for the T singlet model and (B, Y ) doublet model and cW bL = 2 sin θLfor the (T, B, Y ) triplet model. This
relationship is only true within the regime of validity of the renormalisable formulation, and if one considers only the interactions between Q, W and b.
The ATLAS and CMS Collaborations have published searches for single and pair production of vector-like T
quarks in all three decay channels [16–34] and set 95% confidence level (CL) lower limits on T - and Y -quark
masses. Assuming a B of 100% for the corresponding decay channel, the best observed T -quark mass
limits are mT > 1430 GeV for T → Ht [23], 1340 GeV for T → Zt [33] and 1350 GeV for T → W b [20],
independent of the size of the cW bcoupling strengths. In Ref. [34], seven individual analyses searching for
B ¯B or T ¯T pair production were combined improving model-independent cross-section limits significantly
over individual analyses. T quarks with a mass lower than 1310 GeV are excluded for any combination of decays into SM particles by this analysis. The observed lower limit on the pair-produced Y -quark
mass is 1350 GeV [26]. These searches also report limits as a function of the assumed Bs. The best
observed limits are mT > 1310 GeV and mT > 1280 GeV for a weak-isospin doublet [23] and singlet [27]
respectively. Searches for single production of T quarks with decays into Zt [31] and single T /Y -quark
production with decays into W b [22] were carried out by the ATLAS Collaboration using the Run-1 pp
dataset a centre-of-mass energy √
s = 8 TeV. In the T → Zt decay channel, assuming a mixing parameter
sin θL as low as 0.7, T quarks with masses between 450 GeV and 650 GeV are excluded [31], while
for a QW b coupling strength of q
(cW b L )2+ (c
W b
R )2 = 1, the observed lower limit on the T-quark mass
assuming B(T → W b) = 0.5 is 950 GeV [22]. The CMS Collaboration studied single T - and Y -quark
production using the Run-2 dataset at √
s = 13 TeV collected in 2015 [25, 28–30, 32] and set upper
limits on the single-T -quark production cross-section times B(T → Ht) that vary between 0.31 pb and
0.93 pb for T -quark masses in the range 1000–1800 GeV [32], as well as on the single-T -quark production
cross-section times B(T → Zt) that vary between 0.98 pb and 0.15 pb (0.6 pb and 0.13 pb) for T -quark
masses in the range 700–1700 GeV in the right-handed (left-handed) T b (T t) production channel [25]. For
a mass of 1000 GeV, a T -quark production cross-section times branching fraction above 0.8 pb (0.7 pb) is excluded for the T → Ht decay channel assuming left-handed (right-handed) coupling of the T quark
to SM particles [28]. For Y quarks with a coupling of 0.5 and B(Y → W b) = 1, the observed (expected)
lower mass limit is 1.40 (1.0) TeV [29].
This paper describes a search for Q → W b (Q = T or Y ) production, with the prompt W boson decaying
leptonically, giving a lepton + jets signature characterised by the presence of exactly one electron or muon1,
three or more jets and missing transverse momentum from the escaping neutrino. It is assumed that T quarks are produced in W b fusion only. For single production of a T quark, Zt fusion could in principle contribute as well, but can be neglected for this T -singlet search. For equal values of the T Zt and TW b
couplings, the cross-section for Zt fusion is about one order of magnitude smaller than for W b fusion [14].
For the T -singlet case, the T Zt coupling is about a factor of √
2 smaller than the TW b coupling and as a result B(T → Zt) is about a factor of two smaller than B(T → W b). Since the single-VLQ production cross-section scales with coupling squared, the Zt fusion cross-section is lowered by another factor of two compared to the W b fusion cross-section. In addition, the selection efficiency for t Z → T → W b events in the search presented here is about a factor of two smaller than for bW → T → W b, because in t Z → T → W b the accompanying top quark from the gluon splitting leads to additional jets in the final state.
The analysis is optimised to search for massive VLQs with a high-momentum b-jet in the final state. The b-jet and the charged lepton originating from the Q decay are approximately back-to-back in the transverse plane since both originate from the decay of a heavy object. The outgoing light quark in the process
depicted in Figure1often produces a jet in the forward region of the detector. The second b-jet from the
gluon splitting may be observed in either the forward or central region. Since this b-jet is typically of low energy, it often falls outside the detector acceptance.
The main background processes with a single-lepton signature arise from top-quark pair (t ¯t) production, single-top-quark production and W -boson production in association with jets (W +jets), with smaller contributions from Z -boson production in association with jets (Z +jets) and from diboson (WW , W Z , Z Z ) production. Multijet events also contribute to the selected sample via the misidentification of a jet or a photon as an electron or the presence of a non-prompt electron or muon. To estimate the backgrounds from t ¯t and W+jets events in a consistent and robust fashion, two control regions (CRs) are defined. They are chosen to be orthogonal to the signal region (SR) in order to provide independent data samples enriched in particular background sources. The reconstructed mass of the heavy-quark candidate is used as the discriminating variable in a binned likelihood fit to test for the presence of a signal, taking into account the interference with SM background processes. A background-only fit to the SR and CRs is also performed to determine whether the observed event yield in the SR is compatible with the corresponding SM background
expectation. The results of the binned profile likelihood fits are used to estimate the Y /T cL,RW bcoupling
limits. In the case of the right-handed Y quark in a (Y, B) doublet model, where the interference effect with the SM is much smaller than for the other models under consideration, a limit on the production cross-section is also quoted.
2 ATLAS detector
The ATLAS detector [35] at the LHC is a multipurpose particle detector with a forward–backward
symmetric cylindrical geometry that covers nearly the entire solid angle around the collision point.2 It
consists of an inner tracking detector (ID) surrounded by a thin superconducting solenoid magnet producing an axial 2 T magnetic field, fine-granularity electromagnetic (EM) and hadronic calorimeters, and a muon spectrometer (MS) incorporating three large air-core toroid magnet assemblies. The ID consists of a
high-granularity silicon pixel detector, including an insertable B-layer [36, 37] added in 2014, and a
silicon microstrip tracker, together providing charged-particle tracking information in the pseudorapidity region |η| < 2.5. It is surrounded by a transition radiation tracker, which enhances electron identification information in the region |η| < 2.0. The EM calorimeter is a lead/liquid-argon sampling detector, divided into a barrel region (|η| < 1.475) and two endcap regions (1.375 < |η| < 3.2), which provides energy measurements of electromagnetic showers. Hadron calorimetry is also based on the sampling technique, with either scintillator tiles or liquid argon as the active medium and with steel, copper, or tungsten as the absorber material. The calorimeters cover the region |η| < 4.9. The MS measures the deflection of muons within |η| < 2.7 using three layers of high-precision tracking chambers located in a toroidal field of approximately 0.5 T and 1 T in the central and endcap regions respectively. The MS is also instrumented
with separate trigger chambers covering |η| < 2.4. A two-level trigger system [38], using custom hardware
2ATLAS uses a right-handed coordinate system with its origin at the nominal interaction point (IP) in the centre of the detector. The positive x-axis is defined by the direction from the IP to the centre of the LHC ring, with the positive y-axis pointing upwards, while the beam direction defines the z-axis. Cylindrical coordinates (r, φ) are used in the transverse plane, φ being the azimuthal angle around the z-axis. The pseudorapidity η is defined in terms of the polar angle θ by η = − ln tan(θ/2). The transverse momentum (pT) is defined relative to the beam axis and is calculated as pT= p sin(θ).
followed by a software-based level, is used to reduce the trigger rate to a maximum of around 1 kHz for offline data storage.
3 Physics object reconstruction
The data used in this search correspond to an integrated luminosity of 36.1 fb−1 of pp collisions at
a centre-of-mass energy of √
s = 13 TeV recorded in 2015 and 2016 with the ATLAS detector. Only data-taking periods with stable beam collisions and all relevant ATLAS detector components functioning normally are considered. In this dataset, the average number of simultaneous pp interactions per bunch crossing, or ‘pile-up’, is approximately 24.
The final states considered in this search require the presence of one charged lepton (electron or muon) candidate and multiple hadronic jets. Single-electron and single-muon triggers with low
transverse-momentum (pT) thresholds and lepton isolation requirements (in 2016 only) are combined in a logical
OR with higher-threshold triggers without any isolation requirements to give maximum efficiency. For
electrons, triggers with a pT threshold of 24 (26) GeV in 2015 (2016) and isolation requirements (in 2016
only) are used along with triggers with a 60 GeV threshold and no isolation requirement, and with a 120
(140) GeV threshold with looser identification criteria. For muons, triggers with pT thresholds of 20
(26) GeV and isolation requirements in 2015 (2016) are combined with a trigger that has a pTthreshold of
50 GeV and no isolation requirements in both years. In addition, events must have at least one reconstructed
vertex with two or more tracks with pTabove 0.4 GeV that is consistent with the beam-collision region in
the x–y plane. If multiple vertices are reconstructed, the vertex with the largest sum of the squared pT
of its associated tracks is taken as the primary vertex. For the final states considered in this analysis, the vertex reconstruction and selection efficiency is close to 100%.
Electron candidates [39–41] are reconstructed from isolated energy deposits (clusters) in the EM calorimeter,
each matched to a reconstructed ID track, within the fiducial region of |ηcluster| < 2.47, where ηclusteris the
pseudorapidity of the centroid of the calorimeter energy deposit associated with the electron candidate. A veto is placed on electrons in the transition region between the barrel and endcap electromagnetic
calorimeters, 1.37 < |ηcluster| < 1.52. Electrons must satisfy the tight likelihood identification criterion,
based on shower-shape and track–cluster matching variables, and must have a transverse energy ET =
Ecluster/cosh(ηtrack) > 25 GeV, where Ecluster is the electromagnetic cluster energy and ηtrack the track
pseudorapidity. Muons are reconstructed [42] by combining a track reconstructed in the ID with one in the
MS, using the complete track information from both detectors and accounting for the effects of energy loss and multiple scattering in the material of the detector structure. The muon candidates must satisfy
the medium selection criteria [42] and are required to be in the central region of |η| < 2.5. To reduce the
contribution of leptons from hadronic decays (non-prompt leptons), electrons and muons must satisfy isolation criteria that include both track and calorimeter information, and are tuned to give an overall
efficiency of 98%, independent of the pTof the lepton. Electron and muon candidates are required to be
isolated from additional tracks within a cone around their directions with a radius of ∆R ≡ p
(∆η)2+ (∆φ)2
with ∆R = min(0.2, 10 GeV/pT) [40] for electrons and ∆R = min(0.3, 10 GeV/pT) for muons [42]. The
lepton calorimeter-based isolation variable is defined as the sum of the calorimeter transverse energy deposits in a cone of size ∆R = 0.2, after subtracting the contribution from the energy deposit of the lepton
itself and correcting for pile-up effects, divided by the lepton pT. The significance of the transverse impact
parameter d0, calculated relative to the measured beam-line position, is required to satisfy |d0/σ(d0)| < 5
are matched to the primary vertex of the event by requiring the longitudinal impact parameter z0to satisfy
|z0sin θtrack|< 0.5 mm, where θtrackis the polar angle of the track.3
The leptons satisfying the criteria described above are used in the selection of events in the signal and control
regions. The estimation of background from non-prompt and fake leptons with the Matrix Method [43],
described in Section5.2, uses ‘loose’ leptons in addition to the above ‘tight’ leptons, where the tight sample
is a subset of the loose sample. The ‘loose’ selection requires that the muon (electron) satisfies the medium
(likelihood medium) requirements, but does not need to satisfy isolation criteria as defined in Refs. [40,
42].
Jets are reconstructed from three-dimensional topological calorimeter energy clusters [44] using the anti-kt
algorithm [45, 46] with a radius parameter of 0.4 [47]. Each topological cluster is calibrated to the
electromagnetic energy scale prior to jet reconstruction. The reconstructed jets from the clusters are then calibrated to the particle level by the application of corrections derived from simulation and from dedicated calibration samples of pp collision data at
√
s = 13 TeV [48,49]. Data quality criteria are imposed to
identify jets arising from non-collision sources or detector noise, and any event containing at least one
such jet is removed [50]. Finally, jets considered in this analysis are required to have pT > 25 GeV. The
pseudorapidity acceptance for jets differs between different selections: central jets are required to have
|η| < 2.5, while forward jets are defined to have 2.5 < |η| < 4.5. Furthermore, jets with a pT < 60 GeV
and |η| < 2.4 are required to satisfy criteria implemented in the jet vertex tagger algorithm [51] designed
to select jets that originate from the hard scattering and reduce the effect of in-time pile-up.
The identification of jets from b-quark decays (b-tagging) is beneficial in this analysis. To identify (tag) jets containing b-hadrons (henceforth referred to as b-jets), a multivariate discriminant is used that combines information about the impact parameters of inner-detector tracks associated with the jet, the presence of
displaced secondary vertices, and the reconstructed flight paths of b- and c-hadrons inside the jet [52–55].
Jets are considered to be b-tagged if the value of the multivariate discriminant is larger than a certain
threshold. The criterion in use is only calculated for central jets (|η| < 2.5) with pT > 25 GeV and has
an efficiency of approximately 85% for b-jets in simulated t ¯t events. The rejection factor against jets originating from light quarks and gluons (henceforth referred to as light-flavour jets) is about 34, and
that against jets originating from charm quarks (c-jets) is about 3 [54], determined in simulated t ¯t events.
Correction factors are defined to correct the tagging rates in the simulation to match the efficiencies
measured in the data control samples [54,56].
To avoid counting a single detector response as two objects, an overlap removal procedure is used. Jets overlapping with identified electron candidates within a cone of ∆R = 0.2 are removed, as the jet and the electron are very likely to be the same physics object. If the nearest jet surviving this requirement is within ∆R = 0.4 of an electron, the electron is discarded, to ensure it is sufficiently separated from nearby jet activity. Muons are removed if they are separated from the nearest jet by ∆R < 0.4, to reduce the background from muons from heavy-flavour hadron decays inside jets. However, if this jet has fewer than three associated tracks, the muon is kept and the jet is removed instead; this avoids an inefficiency for high-energy muons undergoing significant energy loss in the calorimeter.
The missing transverse momentumE®Tmiss(with magnitude ETmiss) is a measure of the momentum of the
escaping neutrinos. It is defined as the negative vector sum of the transverse momenta of all selected and calibrated objects (electrons, muons, photons, hadronically decaying τ-leptons and jets) in the event, including a term to account for energy from soft particles which are not associated with any of the selected
3The longitudinal impact parameter z
0is the difference between the longitudinal position of the track along the beam line at the point where the transverse impact parameter (d0) is measured and the longitudinal position of the primary vertex.
objects [57]. This soft term is calculated from inner-detector tracks matched to the selected primary vertex
to make it resilient to contamination from pile-up interactions [57].
4 Background and signal modelling
Monte Carlo (MC) simulation samples are used to model the expected signal and SM background distributions. The MC samples were processed either through the full ATLAS detector simulation
[58] based on Geant4 [59] or through a faster simulation making use of parameterised showers in the
calorimeters [60]. Effects of both in-time and out-of-time pile-up, from additional pp collisions in the
same and nearby bunch crossings, were modelled by overlaying minimum-bias interactions generated with
Pythia 8.186 [61] according to the luminosity profile of the recorded data. The distribution of the number
of additional pp interactions in the MC samples was reweighted to match the pile-up conditions observed
in data. All simulated samples used EvtGen [62] to model the decays of heavy-flavour hadrons, except
for processes modelled using the Sherpa generator [63]. All simulated events were processed using the
same reconstruction algorithms and analysis selection requirements as for the data, but small corrections, obtained from comparisons of simulated events with data in dedicated control regions, were applied to trigger and object reconstruction efficiencies, as well as detector resolutions, to better model the observed
response. The main parameters of the MC samples used in this search are summarised in Table1. Samples
for all SM background processes were generated with the full Geant4 model of the ATLAS detector.
4.1 Background modelling
Top-quark pair events were generated with the next-to-leading-order (NLO) generator Powheg-Box
2.0 [64–66] using the CT10 parton distribution function (PDF) set [67], interfaced to Pythia 6.428 [68]
with the CTEQ6L PDF set [69] and the Perugia 2012 (P2012) set of tuned parameters for the underlying
event (UE) [70]. The hard-process factorisation scale µf and renormalisation scale µr were set to the
default Powheg-Box values µ = (m2t + p2T,top)1/2, where mtis the top-quark mass, mt = 172.5 GeV, and
pT,topis the top-quark transverse momentum evaluated for the underlying Born configuration. The hdamp parameter, which controls the transverse momentum of the first additional gluon emission beyond the Born configuration, is set equal to the mass of the top quark. The main effect of this choice is to regulate the
high-pT emission against which the t ¯t system recoils. The sample was generated assuming that the top
quark decays exclusively through t → W b.
Alternative t ¯t samples were produced to model uncertainties in this process. The effects of initial- and final-state radiation (ISR/FSR) were explored using two alternative Powheg-Box 2.0 + Pythia 6.428
samples: one with hdampset to 2mt, the renormalisation and factorisation scales set to half the nominal
value and using the P2012 high-variation UE tuned parameters, giving more radiation, and another with
P2012 low-variation UE tuned parameters, hdamp= mt and the renormalisation and factorisation scales set
to twice the nominal value, giving less radiation [71]. The values of µr, µfand hdampwere varied together
because these two variations were found to cover the full set of uncertainties obtained by changing the scales
and the hdampparameter independently. To provide a comparison with a different parton-shower model, an
additional t ¯t sample was generated using the same Powheg-Box settings as the nominal Powheg-Box 2.0 + Pythia 6.428 sample, but with parton showering, hadronisation, and the UE simulated with Herwig++
2.7.1 [72] with the UEEE5 tuned parameters [73] and the corresponding CTEQ6L1 PDF set. Additional t ¯t
2.7.1 to determine the systematic uncertainties related to the use of different models for the hard-scattering generation, while maintaining the same parton shower model.
The t ¯t prediction was normalised to the theoretical cross-section for the inclusive t ¯t process of 832+46−51pb
obtained with Top++ [75], calculated at next-to-next-to-leading order (NNLO) in QCD and including
resummation of next-to-next-to-leading logarithmic (NNLL) soft gluon terms [76–80]. Theoretical
uncer-tainties result from variations of the factorisation and renormalisation scales, as well as from unceruncer-tainties
in the PDF and strong coupling constant αS. The latter two represent the largest contribution to the overall
theoretical uncertainty in the cross-section and are calculated using the PDF4LHC prescription [81].
Single-top-quark background processes corresponding to the W t and s-channel production mechanisms
were generated with Powheg-Box 1.0 at NLO [82] using the CT10 PDF set. Overlaps between the t ¯t and
Wt final states were removed using the “diagram removal” scheme (DR) [83,84]. The “diagram subtraction”
scheme (DS) [84] was considered as an alternative method, and the full difference between the two methods
assigned as a shape and normalisation uncertainty [85]. Events from t-channel single-top-quark production
were generated using the Powheg-Box 1.0 [82] NLO generator, which uses the four-flavour scheme. The
fixed four-flavour PDF set CT10f4 was used for the matrix-element calculations. All single-top-quark
samples were normalised to the approximate NNLO theoretical cross-sections [86–88]. Pythia 6.428 with
the P2012 set of tuned parameters was used to model the parton shower, hadronisation and underlying event. Additional single-top-quark samples were generated using the same Powheg-Box settings as the nominal sample, while parton showering, hadronisation, and the UE were simulated with Herwig++ 2.7.1. The ISR/FSR effects were explored using alternative Powheg-Box 2.0 + Pythia 6.428 samples with a set of P2012 high- and low-variation UE tuned parameters. Another set of single-top-quark samples was generated using Madgraph5_aMC@NLO 2.2.1 interfaced to Herwig++ 2.7.1 to determine the systematic uncertainties associated with the choice of NLO generator.
Samples of W /Z +jets events were generated with the Sherpa 2.2.0 generator. The matrix-element calculation was performed with up to two partons at NLO and up to four partons at leading order (LO)
using Comix [89] and OpenLoops [90]. The matrix-element calculation was merged with the Sherpa
parton shower [91] using the ME+PS@NLO prescription [92]. The PDF set used for the matrix-element
calculation was CT10 with a dedicated parton shower tuning developed by the Sherpa authors. The W +jets and Z+jets samples were normalised to the NNLO theoretical cross-sections for inclusive W and Z
production calculated with FEWZ [93]. Samples generated with Madgraph5_aMC@NLO 2.2.1+ Pythia
8.186 were compared with the nominal W +jets samples to determine the systematic uncertainties associated with the choice of generator.
Diboson events (WW /W Z /Z Z +jets) with one of the bosons decaying hadronically and the other leptonically were generated with the NLO generator Sherpa 2.1.1 and include processes containing up to four electroweak vertices. The matrix element included up to one (Z Z ) or zero (WW , W Z ) additional partons at NLO and up to three partons at LO using the same procedure as for W /Z +jets. All diboson samples were normalised to their NLO theoretical cross-sections provided by Sherpa. Processes producing smaller backgrounds are also considered, and include t ¯tV (V = W ,Z ) and t ¯tH. The t ¯tV processes were simulated
with Madgraph5_aMC@NLO generator using the NNPDF2.3 PDF set, interfaced to Pythia8 [94] with
the A14 UE tune. The t ¯tH process was modelled using Madgraph5_aMC@NLO interfaced to Herwig++ 2.7.1.
Table 1: Generators used to model the signals and different background processes. The parameter tune for the underlying event, PDF set, and the highest-order perturbative QCD (pQCD) accuracy used for the normalisation of each sample is given. All processes, except for Y qb signals, were generated at NLO in QCD. The LO cross-sections calculated for the Y qb signal processes in the simulation were normalised to the NLO theoretical cross-section taken from Ref. [14].
Process Generator Tuned parameters PDF set Inclusive cross-section
+ parton showering/hadronisation order in pQCD
Y q b Madgraph5_aMC@NLO 2.2.3 A14 NNPDF2.3 NLO
+ Pythia 8.210
t ¯t Powheg-Box 2.0 P2012 CT10 NNLO+NNLL
+ Pythia 6.428
Single top Powheg-Box 1.0 P2012 CT10 NNLO+NNLL
+ Pythia 6.428
Dibosons Sherpa 2.1.1 Default CT10 NLO
WW , W Z, Z Z
W /Z + jets Sherpa 2.2.0 Default CT10 NNLO
t ¯tV Madgraph5_aMC@NLO 2.2.3 A14 NNPDF2.3 NLO
+ Pythia 8.210
t ¯tH Madgraph5_aMC@NLO 2.2.3 CTEQ6L1 CT10 NLO
+ Herwig++ 2.7.1
4.2 Signal modelling
Simulated events for signal processes were generated at LO in the four-flavour scheme with the Mad-graph5_aMC@NLO 2.2.3 generator using the NNPDF2.3 PDF set, interfaced to Pythia8 for parton showering and hadronisation. Samples of Y qb signals were produced for masses ranging from 800 GeV to
2000 GeV in steps of 100 GeV with equal left-handed and right-handed coupling strengths of κT = 0.5 [95].
The coupling parameter κT in the model described in Ref. [95] used for the signal production is related to
the coupling parameters cL,RW bin Ref. [14] via κTf (m)= cW bL,R/ √
2, where f (m) ≈ q
1/(1 + O(m−4Q)) with
mQthe VLQ mass in GeV, and therefore κT ≈ cW bL,R/
√
2 to a very good approximation. These samples were processed either through the full detector simulation or through the faster simulation. The normalisation of signal events produced with the faster simulation was scaled up by 7.2% to correct for efficiency differences.
Since the kinematic distributions of the decay products for the T quark and Y quark in the W b decay channel are the same, only Y signal samples were generated and they were used to derive the results also for the T qb signals. Other possible decay modes of the T quark (T → Zt, T → Ht) have negligible acceptance in this search. The kinematics of the final-state particles are very similar for left-handed and right-handed couplings, and hence the acceptances for the two chiralities are found to be equal. The LO cross-sections calculated for the signal processes in the simulation were normalised to the next-to-leading-order benchmark
calculation from Ref. [14], which is performed in the narrow-width approximation (NWA). The single-VLQ production cross-sections and the decay widths of the VLQ resonances are mass- and coupling-dependent. The VLQ width increases with increasing mass and coupling values such that, for sufficiently large masses and couplings, the NWA is no longer valid. The ratio of the single-VLQ production cross-section without the NWA to that with the NWA, calculated at LO using Madgraph5_aMC@NLO 2.2.3, was used to
correct the NLO cross-section from Ref. [14] as function of VLQ mass and coupling.
Sizeable interference effects between the amplitude for VLQ signal production and the SM are possible. In the analysis, two scenarios are considered:
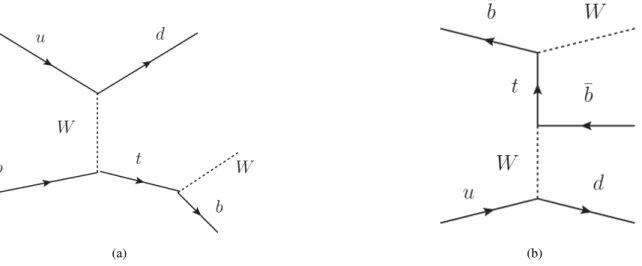
1. T -quark production in a T singlet model, in which the T quark has only a left-handed coupling [1].
The SM process that interferes in this case is t-channel single-top-quark production where the top
quark is far off-shell as illustrated in Figure2(a).
2. Y -quark production in a (T, B, Y ) triplet or (B, Y ) doublet model, in which the Y quark has only a left-handed coupling or right-handed coupling. The SM process that interferes with Y -quark
production is electroweak W−bq production4as shown in Figure2(b). Two cases are considered:
a) the Y quark has only a left-handed coupling, which is realised e.g. in a (T, B, Y ) triplet model,
in which the right-handed coupling is heavily suppressed [1]. Since in the (T, B, Y ) triplet model
the T quark does not couple to W b, T -quark production does not contribute to the final state under consideration; b) the Y quark has only a right-handed coupling, which is realised e.g. in a (B, Y ) doublet model, in which the left-handed coupling is heavily suppressed. The interference effect for the Y quark with a right-handed coupling is much smaller than that for the Y quark with a left-handed coupling.
These SM contributions (i. e. σSM) were not modelled in the ATLAS MC simulations.
(a) (b)
Figure 2: Leading-order Feynman diagrams for the SM processes that interfere with T -quark or Y -quark production, respectively, as described in the text:(a)t-channel single-top-quark production where the top quark is far off-shell
and(b)electroweak W−bq production.
In order to determine the signal yield and acceptance for different signal couplings, the samples of simulated
signal events produced with the nominal coupling strength of κT = 0.5 are corrected on an event-by-event
basis using reweighting factors. These factors are obtained by comparing the target VLQ mass distribution in generated signal samples, at particle level, with the nominal one. The reweighting takes three effects into account: 1) the effect of interference calculated at LO, 2) the change in cross-section when going from LO to NLO, 3) the effect from the variation of the coupling strength. The method is validated with fully reconstructed signal samples with varied coupling strengths. The matrix-element squared for the process pp → W bq is given by
| M |2= |M
SM|2+ |MVLQ|2+ 2Re(M
∗
SMMVLQ).
As a result, the total cross-section for pp → W bq at LO can be written as σtotLO= σSMLO+ σVLQLO + σILOwith
the LO SM cross-section σSMLO, the LO VLQ cross-section σVLQLO and the interference-term cross-section
σLO
I . Since the K-factor quantifying the ratio between NLO and LO cross-sections is significantly larger
than one for VLQ production, the interference effect has to be modelled at NLO. This modelling uses
the K-factors for SM production, KSM, and for VLQ production, KVLQ, writing the total cross-section for
pp → W bq at NLO as
σNLO
tot = KSMσSMLO+ KVLQσVLQLO + pKSM· KVLQσILO. (1)
The KVLQvalues as a function of the VLQ mass are taken from Ref. [14]. There is no dedicated NLO
calculation available for the KSMfactor for t-channel single-top-quark production with t-quarks far off-shell.
This KSMfactor is set to unity since the K-factor for t-channel single-top-quark production for on-shell
t-quarks is very close to one [96]. Since there is no dedicated NLO calculation in the literature for
electroweak SM W−bq production interfering with the Y production amplitude, KSMis set to unity in this
case as well. No systematic uncertainties are assigned to any of the KVLQor KSM factors, because it is
assumed that they correspond to the particular model assumptions. To obtain the reweighting factors r, events were generated at LO using Madgraph5_aMC@NLO 2.2.3 and r calculated as
r(mW b; c, c0)=
KVLQfVLQ(mW b; c) +pKSM· KVLQfI(mW b; c)
fVLQ(mW b; c0)
, (2)
where c0is the nominal coupling used in the simulation, c is the coupling value of interest, and the functions
fVLQ(mW b; c) and fI(mW b; c) describe the W b invariant mass distributions at particle level scaled to the
LO cross-sections σSMLOand σILOrespectively. The reweighting assumes that the phase change as a function
of mW bfor the VLQ and SM amplitudes at NLO is the same as at LO.
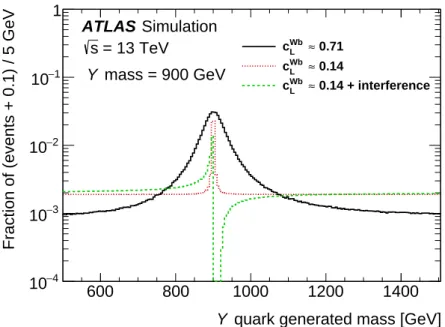
Figure3shows the generated mass distribution at particle level for a Y quark with a mass of 900 GeV,
produced with a coupling strength of 0.5 and scaled to the LO cross-section. It is compared with the generated mass distributions reweighted to a coupling strength of 0.14 with and without the interference term, which is also scaled to the LO cross-section. For the case without interference, it was explicitly checked that events generated with one coupling and reweighted to another target coupling result not only in the same VLQ mass distribution but also in the same distributions of other kinematical variables when generated directly with this target coupling.
5 Event selection and background estimation
This search focuses on final states with a leptonically decaying W boson and a b-quark, originating from the decay of a singly produced Q quark. Events are required to have exactly one isolated identified lepton
quark generated mass [GeV]
Y
600 800 1000 1200 1400
Fraction of (events + 0.1) / 5 GeV
4 − 10 3 − 10 2 − 10 1 − 10 1 0.71 ≈ L Wb c 0.14 ≈ L Wb c 0.14 + interference ≈ L Wb c Simulation ATLAS = 13 TeV s mass = 900 GeV Y
Figure 3: The generated mass distributions at particle level for a Y quark with a mass of 900 GeV, for a coupling strength of c0= κT ≈ 0.5 and cW bL ≈ 1/
√
2 (cRW b= 0 , solid line) and of c0= cLW b= 0.14 (dotted line) as defined in
Ref. [95]. The distribution for a right-handed only and left-handed only Y quark (solid line) is the same. The dashed line shows the generated vector-like quark mass distribution at particle level of a left-handed Y signal with a mass of 900 GeV, coupling strength of cW bL = 0.14 and interference effects with the SM included. The interference effects lead to negative entries in some bins of the distribution. For better visualisation of the tail distribution including the interference effect, the bin contents of all distributions were shifted by +0.1 before normalisation.
missing transverse momentum ETmiss> 120 GeV from the escaping neutrino, and at least one central jet
with pT > 25 GeV satisfying the quality and kinematic criteria discussed in Section3. The requirement on
the missing transverse momentum reduces the fraction of selected events originating from non-prompt or misidentified leptons as well as diboson events. In the following, unless stated otherwise, only events satisfying this selection, referred to as “preselection”, are considered. If there are any forward jets in the event, their transverse momentum is required to be larger than 40 GeV.
5.1 Signal and control regions definition
Events must have at least one b-tagged jet. The highest-pT jet in the event must be b-tagged and
have pT > 350 GeV. To further exploit the low multiplicity of high-pT jets in the signal process, an
additional requirement is applied: events containing any jet with pT > 75 GeV and |η| < 2.5 and
satisfying ∆R(jet, leading jet) < 1.2 or ∆R(jet, leading jet) > 2.7 are rejected. This requirement reduces
background from production of t ¯t events, which are characterised by a higher multiplicity of high-pT
central jets than in signal events. A requirement on the azimuthal separation between the lepton and the b-tagged leading jet, |∆φ (lepton, leading jet)| > 2.5, as well as on the minimum distance ∆R between the lepton and any central jet, ∆R(lepton, jet) > 2.0, increases the signal-to-background ratio because, in signal signatures, leptons from the leptonic W -boson decays should be isolated and recoil against the b-quark jet in the event. Furthermore, similar to t-channel single-top production, the single production of VLQs gives rise to a forward jet (2.5 < |η| < 4.5). Only events with at least one forward jet with
pT> 40 GeV are considered. For a Y signal with a mass between 800 GeV and 2000 GeV and a coupling strength of q (cW b L ) 2+ (cW b R ) 2≈ 1/ √
2, the signal-to-background ratio (S/B) and the signal-to-background significance ratio (S/
√
B) in the SR are in the range 1.0–0.003 and 22.1–0.3 respectively. The acceptance
times efficiency including the leptonic W decay branching fractions5for these Y signals ranges from 0.7%
to 1.8% in the SR.
The normalisation of W +jets and t ¯t processes is partially constrained by fitting the predicted yields to data in CRs enriched in W +jets and t ¯t events. Two CRs are defined for this purpose, and also provide samples depleted in expected signal events. The selection requirements for the W +jets CR are the same as for the SR, except that each event is required to have exactly one b-tagged jet and the requirement on the azimuthal separation between the lepton and the b-tagged jet is reversed, |∆φ (lepton, leading jet)| ≤ 2.5.
In addition, the b-tagged jet has a slightly lower transverse momentum requirement of pT > 250 GeV and
no hard or forward jet veto is applied. The W +jets CR definition results in a composition of W +light-jets and W +heavy-flavour-jets final states similar to that in the SR. The selection requirements for the t ¯t CR
are the same as for the SR, except that the leading jet pTmust be greater than 200 GeV and there must
be at least one high-pTjet with pT> 75 GeV and |η| < 2.5 fulfilling either ∆R (jet, leading jet) < 1.2 or
∆R (jet, leading jet) > 2.7. Table2summarises the main selection criteria in the SR and the orthogonal
CRs. For Y /T signals with masses of ≥ 800 GeV and a coupling strength of q (cW b L )2+ (c W b R )2≈ 1/ √ 2, the contamination in the t ¯t control region is at most 1% and in the W +jets CR at most 0.6%.
A mismodelling of the W +jets background is observed at high jet pT.
To correct for this mismodelling, the leading jet pTdistributions in data and MC-simulated W +jets events
are compared after applying the preselection criteria and requiring that the leading jet is a b-tagged jet. The ratio of the distributions is taken as a scaling factor, which is applied to the simulated W +jets events in all kinematic distributions. The correction factors are between approximately 0.9 and 1.1 with statistical
uncertainties of 4–10% for a jet pTbelow 500 GeV, and 0.4–0.8 with a statistical uncertainty of about 11%
for higher pTvalues. These reweighting factors are treated as a systematic uncertainty in the final fit.6
5.2 Estimation of non-prompt and fake lepton backgrounds
Multijet production results in hadrons, photons and non-prompt leptons that may satisfy the lepton selection criteria and give rise to so called “non-prompt and fake” lepton backgrounds. The multijet background
normalisation and shape in the mVLQdistributions are estimated with a data-driven method, referred to as
the Matrix Method [43]. This method uses the efficiencies of leptons selected using loose requirements
(loose leptons) to pass the default tight lepton selection requirements. The efficiencies are obtained in dedicated control regions enriched in real leptons or in non-prompt and fake leptons, and applied to events selected with either the loose or tight lepton definition to obtain the fraction of multijet events.
The fake-enriched control regions are defined using the preselection criteria, except that events with electrons
are required to have a reconstructed transverse W mass7mWT < 20 GeV and to have ETmiss+ mWT < 60 GeV,
5Events with leptonic τ decays are included.
6The residual difference of about 10% between the data and the SM simulation in the tail of the invariant mass distribution of the reconstructed VLQ candidate after applying the W +jets leading-jet pTcorrection is included in this systematic uncertainty. 7The transverse W mass mW
T is computed from the missing transverse momentum ®p miss
T and the charged lepton transverse momentum ®p`T, and is defined as mWT =
q
2p`TETmiss(1 − cos ∆φ( ®p`T, ®pTmiss)), where ∆φ( ®p`T, ®pTmiss) is the azimuthal angle between ®p`Tand ®pTmiss.
Table 2: Summary of common preselection requirements and selection requirements for the SR compared to those for the t ¯t and W +jets CRs. All other selection requirements are the same for all three regions.
Requirement Region SR t ¯t CR W +jets CR Preselection Leptons 1 Emiss T > 120 GeV
Central jets (pT > 25 GeV) ≥ 1
Selection
b-tagged jets ≥ 1 ≥ 1 1
Leading jet pT > 350 GeV > 200 GeV > 250 GeV
Leading jet is b-tagged Yes Yes Yes
|∆φ(lepton, leading jet)| > 2.5 > 2.5 ≤ 2.5
Jets (pT > 75 GeV) with
∆R (jet, leading jet) < 1.2 or
0 ≥ 1 –
∆R (jet, leading jet) > 2.7
∆R (lepton, jets) > 2.0 – > 2.0
Forward jets (pT > 40 GeV) ≥ 1 ≥ 1 –
and for events with muons it is required that the leading muon have |d0/σ(d0)| > 5. The real lepton
efficiencies are measured using the tag-and-probe method from Z → ee and Z → µµ control regions.
Further details can be found in Refs. [22,43].
5.3 Signal candidate mass reconstruction
In the SR, the invariant mass of the reconstructed VLQ candidate mVLQis used to discriminate the signal
from the background processes. It is calculated from the leading b-tagged jet and the decay products of the leptonically decaying W -boson candidate. The W -boson candidate is reconstructed by summing the four-momenta of the charged lepton and the neutrino. To obtain the z-component of the neutrino
momentum (pz,ν), the invariant mass of the lepton–neutrino system is set to the W -boson mass and the
resulting quadratic equation is solved. If no real solution exists, theE®Tmissvector is varied by the minimum
amount required to produce exactly one real solution. If two real solutions are found, the one with the
smaller | pz,ν| is used. The W-boson candidate and the leading b-tagged jet are then used to reconstruct
the Q candidate. The mass resolutions for Y signals with masses between 800 GeV and 1600 GeV for a coupling of q (cW b L )2+ (c W b R )2≈ 1/ √ 2 are 150–550 GeV.
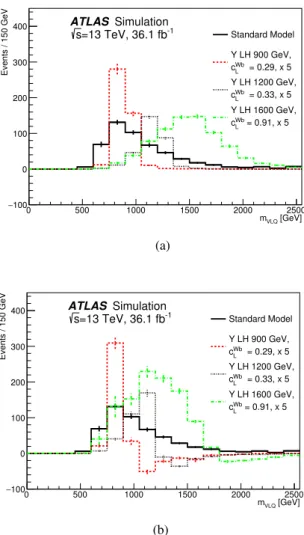
Figure4shows the VLQ candidate invariant mass distribution in the SR for three simulated left-handed
Y signal masses, 900 GeV, 1200 GeV and 1600 GeV, with couplings of cW bL ≈ 0.29, ≈ 0.33 and ≈ 0.91
respectively, without (left figure) and with (right figure) interference included, together with the total SM background. The distribution provides good discrimination between signal and background events in the SR. Depending on the coupling and signal mass it is possible that negative entries occur in some bins of
[GeV] VLQ m 0 500 1000 1500 2000 2500 Events / 150 GeV 100 − 0 100 200 300 400 Standard Model = 0.29, x 5 Wb L c Y LH 900 GeV, = 0.33, x 5 Wb L c Y LH 1200 GeV, = 0.91, x 5 Wb L c Y LH 1600 GeV, ATLAS Simulation -1 =13 TeV, 36.1 fb s (a) [GeV] VLQ m 0 500 1000 1500 2000 2500 Events / 150 GeV 100 − 0 100 200 300 400 Standard Model = 0.29, x 5 Wb L c Y LH 900 GeV, = 0.33, x 5 Wb L c Y LH 1200 GeV, = 0.91, x 5 Wb L c Y LH 1600 GeV, ATLAS Simulation -1 =13 TeV, 36.1 fb s (b)
Figure 4: Distribution of VLQ candidate mass, mVLQ, in the SR for three different signal masses(a)without and(b)
with interference effects, for a left-handed Y signal with a mass of 900 GeV (dashed line), 1200 GeV (dotted) and 1600 GeV (dash-dotted line) and a coupling of cW bL ≈ 0.29, ≈ 0.33 and ≈ 0.91 respectively, together with the total SM background (solid line). The error bars represent the statistical uncertainties. The signal event yield is scaled by a factor of five. Depending on the coupling and signal mass it is possible that negative entries occur in some bins of the signal-plus-interference mVLQdistribution due to the interference effect. The distributions for a right-handed and
left-handed Y signal without considering any interference effects are the same.
6 Systematic uncertainties
Several sources of systematic uncertainty in this analysis can affect the normalisation of the signal and
background and/or their corresponding mVLQdistributions, which are used for the statistical study. They
are included as nuisance parameters in the statistical analysis. Sources of uncertainty include the modelling of the detector response, object reconstruction algorithms, uncertainty in the theoretical modelling of the signals and backgrounds, as well as the uncertainty arising from the limited size of the simulated event samples.
The following section describes each of the systematic uncertainties considered in the search. Table3
uncertainty in the expected SM background are uncertainties that arise from the jet energy scale, flavour-tagging efficiencies (b, c and light) as well as the background modelling, where t ¯t generator uncertainties
and single-top-quark DS/DR uncertainties are significantly constrained by the fit (see Section7.1).
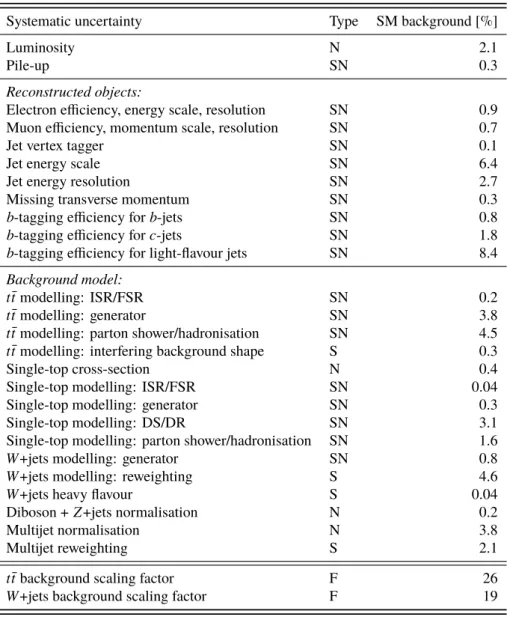
Table 3: Systematic uncertainties considered in this analysis. An uncertainty that affects normalisation only (cross-section only) for all processes and channels is denoted by “N", whereas “SN" means that the uncertainty affects both shape and normalisation and “F" means a floating normalisation uncertainty. Some of the systematic uncertainties are split into several components for a more accurate treatment. The relative systematic uncertainties in the inclusive expected SM background yields determined from the VLQ candidate invariant mass distribution after the fit to the background-only hypothesis are given in the last column in percentage. The t ¯t and W +jets background scaling-factor uncertainties (last two rows in the table) are the relative systematic uncertainties in the predicted t ¯t and W +jets background respectively.
Systematic uncertainty Type SM background [%]
Luminosity N 2.1
Pile-up SN 0.3
Reconstructed objects:
Electron efficiency, energy scale, resolution SN 0.9
Muon efficiency, momentum scale, resolution SN 0.7
Jet vertex tagger SN 0.1
Jet energy scale SN 6.4
Jet energy resolution SN 2.7
Missing transverse momentum SN 0.3
b-tagging efficiency for b-jets SN 0.8
b-tagging efficiency for c-jets SN 1.8
b-tagging efficiency for light-flavour jets SN 8.4
Background model:
t ¯t modelling: ISR/FSR SN 0.2
t ¯t modelling: generator SN 3.8
t ¯t modelling: parton shower/hadronisation SN 4.5
t ¯t modelling: interfering background shape S 0.3
Single-top cross-section N 0.4
Single-top modelling: ISR/FSR SN 0.04
Single-top modelling: generator SN 0.3
Single-top modelling: DS/DR SN 3.1
Single-top modelling: parton shower/hadronisation SN 1.6
W +jets modelling: generator SN 0.8
W +jets modelling: reweighting S 4.6
W +jets heavy flavour S 0.04
Diboson + Z +jets normalisation N 0.2
Multijet normalisation N 3.8
Multijet reweighting S 2.1
t ¯t background scaling factor F 26
6.1 Experimental uncertainties
The uncertainty in the combined 2015+2016 integrated luminosity is 2.1%. It is derived, following
a methodology similar to that detailed in Ref. [97], and using the LUCID-2 detector for the baseline
luminosity measurements [98], from calibration of the luminosity scale using x-y beam-separation scans.
Experimental sources of systematic uncertainty arise from the reconstruction and measurement of jets [49],
leptons [40,42] and ETmiss[57]. Uncertainties associated with leptons arise from the trigger, reconstruction,
identification, and isolation efficiencies, as well as the lepton momentum scale and resolution, and are
studied using Z → `+`−and J/ψ → `+`−decays in data. Uncertainties associated with jets primarily
arise from the jet energy scale, jet energy resolution, and the efficiency of the jet vertex tagger requirement.
The largest contribution is from the jet energy scale, where the dependence of the uncertainty on jet pTand
η, jet flavour, and pile-up is split into 21 uncorrelated components that are treated independently in the
analysis [49]. The systematic uncertainty in the ETmissreconstruction is dominated by the uncertainties in
the energy calibration and resolution of reconstructed jets and leptons, which are propagated to ETmissand
thus are included in the uncertainties in the corresponding objects. In addition, uncertainties in the pT
scale and resolution of reconstructed tracks that are associated with the hard-scatter vertex but not matched to any reconstructed objects are included.
The efficiency of the flavour-tagging algorithm to correctly tag b-jets, or to mis-tag c-jets or light-flavour jets, is measured for each jet flavour. The efficiencies are measured in control samples of simulated events,
and in data samples of t ¯t events, D∗mesons, and jets with impact parameters and secondary vertices
consistent with a negative lifetime. Correction factors are defined to correct the tagging rates in the
simulation to match the efficiencies measured in the data control samples [54, 56]. The uncertainties
associated with these measurements are factorised into statistically independent sources and include a total of six independent sources affecting b-jets and four independent sources affecting c-jets. Each of these
uncertainties has a different dependence on jet pT. Seventeen sources of uncertainty affecting light-flavour
jets are considered, and depend on jet pT and η. These correction factors are only determined up to a
jet pT of 300 GeV for b- and c-jets, and pT of 750 GeV for light-flavour jets. Therefore, an additional
uncertainty is included to extrapolate these corrections to jets with pTbeyond the kinematic reach of the
data calibration samples used; it is taken to be correlated among the three jet flavours. This uncertainty is evaluated in the simulation by comparing the tagging efficiencies while varying, e.g., the fraction of tracks with shared hits in the silicon detectors or the fraction of fake tracks resulting from random combinations
of hits, both of which typically increase at high jet pTdue to growing track multiplicity and density of hits
within the jet. Finally, an uncertainty related to the application of c-jet scale factors to τ-jets is considered,
but has a negligible impact in this analysis [56].
The flavour-tagging systematic uncertainties are the leading sources of experimental uncertainties (added in quadrature, about 8.7% in the expected background yield in the SR). Other large detector-specific uncertainties arise from jet energy scale uncertainties (about a 6.4% effect on the expected background yield) and jet energy resolution uncertainties (2.7% in the expected background yield). The total systematic
uncertainty associated with ETmissreconstruction is about 0.3% in the SR. The combined effect of all these
uncertainties results in an overall normalisation uncertainty in the SM background of approximately 6.3% taking into account correlations between the different systematic uncertainties.
For the data-driven multijet background, which has a very small contribution in the SR and CRs, a 100% normalisation uncertainty is used, to fully cover discrepancies between the observed data and the SM expectation in multijet-background-enriched regions. The large statistical uncertainties associated with
the multijet background prediction, which are uncorrelated bin-to-bin in the final discriminating variable,
do not cover shape differences in the multijet background electron pTdistribution. This mismodelling is
corrected by determining reweighting factors in a multijet-background-enriched region which are used as additional shape uncertainties in the final discriminant. These reweighting factors are obtained for electrons with |η| < 1.2 and |η| > 1.2 separately in a region requiring the same selection requirements as
the preselection, but loosening the minimum ETmissrequirement to 20 GeV and requiring the leading jet is a
b-jet.
6.2 Theoretical modelling uncertainties
A number of systematic uncertainties affecting the modelling of t ¯t and single-top-quark processes as
described in Section4.1are considered: uncertainties associated with the modelling of the ISR and FSR,
uncertainties associated with the choice of NLO generator, modelling uncertainties in single-top-quark production (for t-channel) based on comparison of the nominal sample with an alternative MC sample
described in Section4.1, differences between single-top-quark W t samples produced using the diagram
subtraction scheme and W t samples produced using the diagram removal scheme, as well as an uncertainty due to the choice of parton shower and hadronisation model. The t ¯t background normalisation is a free
parameter in the fit, while the normalisation of the single-top background has an uncertainty of 6.8% [87].
Uncertainties affecting the modelling of the Z +jets background and diboson background processes include
a 5% effect from their respective normalisations to the theoretical NNLO cross-sections [93,99,100].
Since both these backgrounds are very small, this uncertainty is applied to the sum of the predicted Z +jets and diboson background processes. The W +jets background normalisation is a free parameter in the fit.
The W +light-jets and W +heavy-flavour-jets predictions have similar mVLQdistributions in the SR and CRs.
Since the predicted ratios of W +light-jets to W +heavy-flavour-jets events in the SR and CRs are similar, but not identical, a systematic uncertainty is derived by comparing the shape of the complete W +jets sample with the W +heavy-flavour-jets portion alone. In addition, alternative W +jets samples were generated using Madgraph+Pythia8 and compared after applying the preselection criteria plus requiring that the leading jet is a b-tagged jet.
To account for the mismodelling of the leading-jet pT spectrum in W +jets events, reweighting factors
are obtained at preselection for W +jet events. The mVLQ distributions with and without these W +jets
jet-pTcorrection factors applied to W +jet events are compared in the SR and CRs and used to quantify the
systematic uncertainty in the mVLQshape of W +jets events in the fit.
All normalisation uncertainties in the different background processes are treated as uncorrelated. For background estimates based on simulations, the largest sources of theoretical modelling uncertainties are due to the choice of parton shower and hadronisation model (2–4%), the choice of generator (about 1–3% in the expected background yield) and varying the parameters controlling the initial- and final-state radiation (about 0.1% in the expected background yield), where the theoretical modelling uncertainties from t ¯t contribute the most.
The systematic uncertainties in the modelling of the high-mass Y /T signal sample which correspond to
the choice of PDF set are evaluated following the PDF4LHC15 prescription [81]. No further systematic
uncertainties in the signal modelling and no uncertainties in the NLO signal production cross-section are considered. In addition, a systematic uncertainty of about 2.5% is applied to cover small differences in the reconstructed VLQ mass between signal samples passed through the full simulation of the detector and
The ATLAS MC production used in this analysis does not contain simulated events from the SM contributions that lead to interference with the VLQ signal. Therefore, these SM contributions can not be explicitly considered in the background modelling of the fit. A recent MC production at reconstruction
level using the four-flavour scheme for one mass point for a left-handed Y quark shows that the mVLQ
distribution of the interfering SM contribution is similar but not identical to that of the other background contributions (W +jets, t ¯t, single top). To account for the presence of interfering SM contributions in the fit,
an additional shape uncertainty is applied to the t ¯t mVLQtemplate, which leads to an uncertainty of 0.2%
in the t ¯t yield.
7 Results
7.1 Statistical interpretation
A binned maximum-likelihood fit to the data is performed to test for the presence of a signal. A separate fit is performed for each signal hypothesis with given mass and couplings. The inputs to the fit are
the distributions of reconstructed VLQ candidate mass mVLQin the SR and the two CRs. The binned
likelihood function L(µ, θ) is constructed as a product of Poisson probability terms over all mVLQbins
considered in the search. It depends on the signal-strength parameter µ, a multiplicative factor to the theoretical signal production cross-section, and θ, a set of nuisance parameters that encode the effect of systematic uncertainties in the signal and background expectations and are implemented in the likelihood function as Gaussian constraints, as well as on the two scale factors for the free-floating t ¯t and W +jets SM
background normalisations. Uncertainties in each bin of the mVLQdistributions due to the finite numbers
of events in the simulation samples are included using dedicated fit parameters and are propagated to µ. The nuisance parameters θ allow variations of the expectations for signal and background according to
the corresponding systematic uncertainties, and their fitted values ˆθ correspond to the deviations from
the nominal expectations which globally provide the best fit to the data. This procedure reduces the impact of systematic uncertainties on the search sensitivity by taking advantage of the well-populated background-dominated CRs included in the likelihood fit. It also allows the CRs to improve the description of the data.
The test statistic qµis defined as the profile log-likelihood ratio: qµ= −2 ln(L(µ, ˆˆθµ)/L( ˆµ, ˆθ)), where ˆµ
and ˆθ are the values of the parameters that maximise the likelihood function (with the constraint 0 ≤ ˆµ ≤ µ),
andθˆˆµare the values of the nuisance parameters that maximise the likelihood function for a given value
of µ. In the absence of any significant deviation from the background expectation, qµis used in the CLs
method [101,102] to set an upper limit on the signal production cross-section times branching ratio at the
95% CL. For a given signal scenario, values of the production cross-section (parameterised by µ) yielding
CLs< 0.05, where CLsis computed using the asymptotic approximation [103], are excluded at 95% CL.
7.2 Fit results
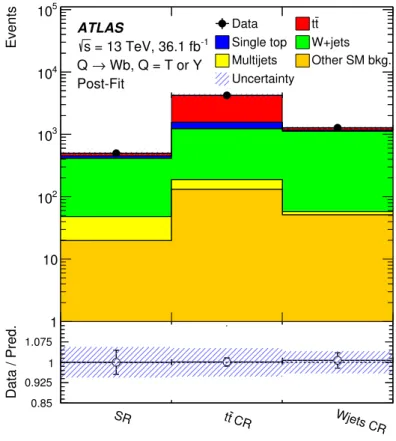
The background-only fit results for the yields in the SR and the two CRs are shown in Figure5. Figure6
presents the mVLQ distributions after the background-only fit in the SR and the two CRs with the SR
binning as used in the background-only fit. The overall t ¯t (W +jets) normalisation is adjusted by a factor of 0.95 ± 0.26 (1.18 ± 0.19), where 0.26 (0.19) is the total uncertainty in the normalisation. An example
a signal would look like. Good agreement between the data and the SM backgrounds is found, in particular
in the SR for the mVLQdistribution, where no peak above the expected SM background is observed.
SR tt CR Wjets CR Data / Pred. 0.85 0.925 1 1.075 1.15 Events 1 10 2 10 3 10 4 10 5 10 ATLAS -1 = 13 TeV, 36.1 fb s Wb, Q = T or Y → Q Post-Fit Data tt
Single top W+jets Multijets Other SM bkg. Uncertainty
Figure 5: Observed background yields in the SR and in the two CRs after the fit to the data in the control regions and the signal region under the background-only hypothesis. The lower panel shows the ratio of data to the fitted background yields. The error bars, being smaller than the size of the data points and hence not visible in the top part of the plot, represent the statistical uncertainty in the data. The band represents the total (statistical and systematic) uncertainty after the maximum-likelihood fit.
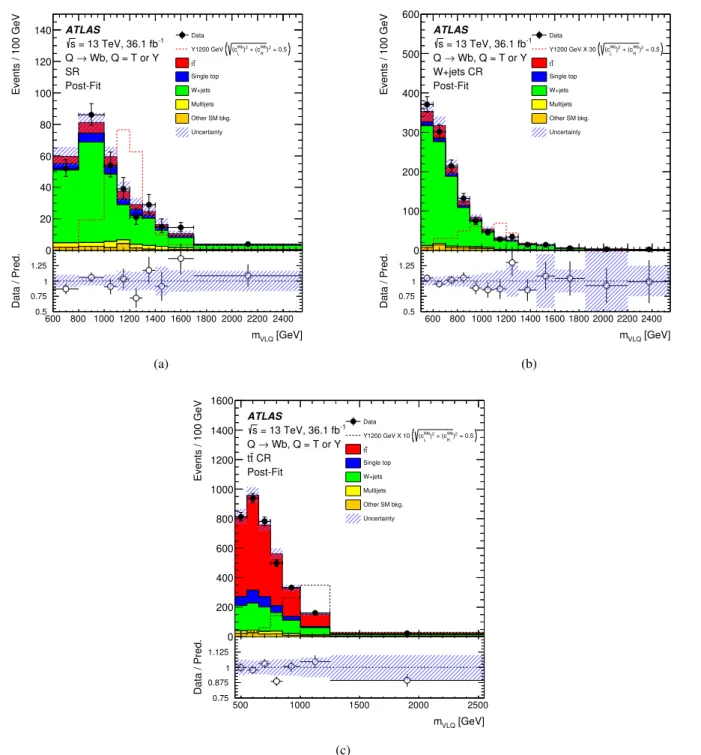
The numbers of data events in the SR and CRs, and the event yields after fitting the background-only
Table 4: Event yields in the SR and the t ¯t and W +jets CRs after the fit to the background-only hypothesis. The uncertainties include statistical and systematic uncertainties. Due to correlations among the SM backgrounds and the corresponding nuisance parameters, the uncertainties in the individual background components can be larger than the uncertainty in the sum of the background, which is strongly constrained by the data.
Source SR t ¯t CR W +jets CR t ¯t 58 ± 21 2715 ± 295 100 ± 29 Single top 29 ± 15 271 ± 118 34 ± 18 W +jets 373 ± 45 1052 ± 143 1077 ± 84 Multijet e 22 ± 20 35 ± 40 0 ± 4 Multijet µ 7 ± 7 92 ± 71 26 ± 20 Z+jets, diboson 20 ± 5 102 ± 20 50 ± 8 t ¯t V 0.3 ± 0.1 21 ± 3 1.6 ± 0.3 t ¯t H 0 ± 0 7 ± 1 0.2 ± 0.1 Total 500 ± 30 4300 ± 210 1290 ± 70 Data 497 4227 1274
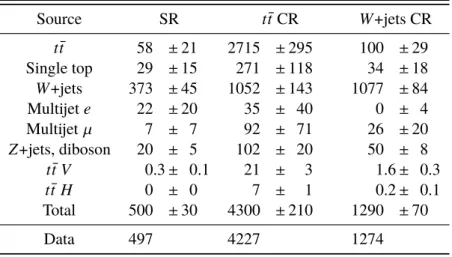
[GeV] VLQ m 600 800 1000 1200 1400 1600 1800 2000 2200 2400 Data / Pred. 0.5 0.75 1 1.25 1.5 Events / 100 GeV 0 20 40 60 80 100 120 140 ATLAS -1 = 13 TeV, 36.1 fb s Wb, Q = T or Y → Q SR Post-Fit Data = 0.5 2 ) R Wb + (c 2 ) L Wb (c Y1200 GeV t t Single top W+jets Multijets Other SM bkg. Uncertainty (a) [GeV] VLQ m 600 800 1000 1200 1400 1600 1800 2000 2200 2400 Data / Pred. 0.5 0.75 1 1.25 1.5 Events / 100 GeV 0 100 200 300 400 500 600 ATLAS -1 = 13 TeV, 36.1 fb s Wb, Q = T or Y → Q W+jets CR Post-Fit Data = 0.5 2 ) R Wb + (c 2 ) L Wb (c Y1200 GeV X 30 t t Single top W+jets Multijets Other SM bkg. Uncertainty (b) [GeV] VLQ m 500 1000 1500 2000 2500 Data / Pred. 0.75 0.875 1 1.125 1.25 Events / 100 GeV 0 200 400 600 800 1000 1200 1400 1600 ATLAS -1 = 13 TeV, 36.1 fb s Wb, Q = T or Y → Q CR t t Post-Fit Data = 0.5 2 ) R Wb + (c 2 ) L Wb (c Y1200 GeV X 10 t t Single top W+jets Multijets Other SM bkg. Uncertainty (c)
Figure 6: Distribution of the VLQ candidate mass, mVLQ, in(a)the SR,(b)the W +jets CR, and(c)the t ¯t CR, after
the fit to the background-only hypothesis. The first and last bin include the underflow and overflow respectively. The lower panels show the ratios of data to the fitted background yields. The error bars represent the statistical uncertainty in the data. The band represents the total systematic uncertainty after the maximum-likelihood fit. An example distribution for a Y signal with a coupling of
q (cW b
L )2+ (c W b
R )2≈ 0.5 without considering any interference
effects is overlaid; for better visibility, it is multiplied by a factor of 30 in the W +jets CR and by a factor of 10 in the t ¯t CR. While the total uncertainty decreases when performing the fit, the total uncertainty in the bins around 1450-1600 GeV and 1850-2200 GeV in(b)does not decrease due to significant statistical MC uncertainties in these two bins.