HAL Id: hal-01606829
https://hal.archives-ouvertes.fr/hal-01606829
Submitted on 26 May 2020
HAL is a multi-disciplinary open access
archive for the deposit and dissemination of sci-entific research documents, whether they are pub-lished or not. The documents may come from teaching and research institutions in France or abroad, or from public or private research centers.
L’archive ouverte pluridisciplinaire HAL, est destinée au dépôt et à la diffusion de documents scientifiques de niveau recherche, publiés ou non, émanant des établissements d’enseignement et de recherche français ou étrangers, des laboratoires publics ou privés.
Impact of fluidized bed granulation on structure and
functional properties of the agglomerates based on the
durum wheat semolina
Bettina Bellocq, Bernard Cuq, Thierry Ruiz, Agnès Duri-Bechemilh, Kevin
Cronin, Denis Ring
To cite this version:
Bettina Bellocq, Bernard Cuq, Thierry Ruiz, Agnès Duri-Bechemilh, Kevin Cronin, et al.. Impact of fluidized bed granulation on structure and functional properties of the agglomerates based on the durum wheat semolina. Innovative Food Science and Emerging Technologies, Elsevier, 2017, 45, �10.1016/j.ifset.2017.09.001�. �hal-01606829�
Version preprint
Impact of fluidized bed granulation on structure and functional properties of the
1
agglomerates based on the durum wheat semolina
2 3
Bettina Bellocq1, Bernard Cuq1, Thierry Ruiz1,Agnès Duri1, Kevin Cronin2, Denis Ring2
4 5
1UMR IATE 1208 CIRAD/INRA/Montpellier SupAgro/Université Montpellier.
6 7
2Department of Process & Chemical Engineering, University College, Cork, Ireland.
8 9 10
Abstract - The granulation step determines the production yield and the final characteristics
11
of the agglomerated couscous grains of durum wheat. The objective of the present work was 12
to explore the capability of the fluidised bed technology to produce agglomerates of durum 13
wheat semolina. The impacts of different processing conditions have been investigated on the 14
structure and functional properties of the agglomerates. The size, shape, water content, 15
compactness, and mechanical strength of the granules were measured. The fluidized bed 16
agglomeration process has been found to produce agglomerates of durum wheat with 17
different attributes compared to those produced by granulation using the low shear mixers. 18
The results were discussed in regard to the hydro-textural approach, in order to get a better 19
understanding of the mechanisms and relationships between process, structure, and 20
properties. Two major agglomeration mechanisms contribute to the growth of the wet 21
agglomerates: a fractal-structuring process followed by a phenomenon of densification. By 22
studying the evolution of the compactness, diameter and water content, it was demonstrated 23
that inter granular arrangements led to an expansion followed by a densification of the wet 24
agglomerates. A relationship was proposed to describe the growth using a fluidized bed of the 25
wet agglomerates of durum wheat semolina. 26
27
Keywords - Fluidized bed ; agglomeration ; couscous grains structure ; hydrotextural
28
diagramm 29
Version preprint
1. Introduction
31
Wet agglomeration is based on the coupling of two phenomena: mixing the powder and 32
incorporating a binder. The structuration of associated sticky particles takes place under shear 33
stress (Iveson, Litster, Hapgood, & Ennis, 2001). Agglomeration of powders using a fluidized
34
bed has been largely investigated either in batch or in open mode (Boerefijn & Hounslow,
35
2005; Nienow, 1995; Philippsen, Vilela, & Zen, 2015; Rambali, Baert, & Massart, 2001;
36
Rieck, Hoffmann, Bück, Peglow, & Tsotsas, 2015; Turchiuli et al., 2005; Zhai et al., 2009). 37
This technology can be used to agglomerate powders by spraying a binder solution directly 38
onto the fluidised powder bed (Saleh & Guigon, 2009; Turchiuli, Eloualia, El Mansouri, &
39
Dumoulin, 2005). The growth mechanisms of the agglomerates depend on the ability of 40
process parameters to activate the surface reactivity of particles and promote collisions. The 41
liquid binder is usually distributed by means of an atomising nozzle, above or inside the 42
powder bed. A vertical air stream agitates the fluidized particle’s bed and contributes to the 43
heat and moisture transfers. Several simultaneous and/or competitive mechanisms occur 44
(wetting/drying, growth/rupture, swelling/shrinkage, consolidation, chemical reactions…) 45
and contribute to the agglomeration (Leuenberger, Puchkov, Krausbauer, & Betz, 2009).
46
Spray nozzle orientation and design, binder flow rate, flows and distribution of the 47
fluidization gas inside the processing chamber, relative humidity, and temperature are the 48
multiple process parameters involved (Jacob, 2007; Pathare, Baş, Fitzpatrick, Cronin, &
49
Byrne, 2012). As the binding liquid is sprayed as small droplets, the agglomeration 50
mechanisms are initiated by the coating of the native particles. The formation of initial nuclei 51
is followed by the coalescence mechanisms (Banjac, Stakic, & Voronjec, 1998; Barkouti,
52
Turchiuli, Carcel, & Dumoulin, 2013; Turchiuli, Smail, & Dumoulin, 2013). The pneumatic 53
agitation of the powder bed produces collisions between the wetted particles that could 54
coalesce by the formation and the persistence of liquid bridges. The growth of granules is 55
also affected by the rupture mechanisms of the structures due to shear stress between the wall 56
and/or breakage induced by the intensity of the collisions. The distinction between these 57
coupled phenomena in terms of rate and spatial localisation in the reactor represents a 58
challenge to improve agglomeration (Hemati, Cherif, Saleh, & Pont, 2003; Smith & Nienow,
59
1983). The shape and texture of the agglomerates are essentially depending on the
60
mechanical environment generated in the reactor. Due to the low shear stresses developed by 61
the air flow, the granules formed using a fluidised bed are generally more porous and have 62
Version preprint
more irregular shape than those produced by using rotating drums and mechanical shear 63
mixer (Jacob, 2007; Ji, Fitzpatrick, Cronin, Fenelon, & Miao, 2017; Morin & Briens, 2014).
64
The food powders can be agglomerated to improve their properties (e.g. size distribution, 65
shape, flowability, instant properties, colour, etc.) (Barkouti et al., 2013; Dacanal &
66
Menegalli, 2010; Palzer, 2011). Fluid bed agglomeration has been used to improve the instant 67
properties and the flowability of dairy powders, instant coffee, cocoa beverages, or culinary 68
powders (Palzer, 2011; Turchiuli et al., 2013). The binder solution is simply water when
69
processing amorphous water-soluble particles, but viscous liquids are used to agglomerate 70
crystalline water-soluble particles (Cuq, Mandato, Jeantet, Saleh, & Ruiz, 2013). The
71
agglomeration is a key operation in the elaboration of couscous grains of durum wheat 72
semolina (Barkouti, Rondet, Delalonde, & Ruiz, 2012; Saad, Barkouti, Rondet, Ruiz, & Cuq,
73
2011). Industrial couscous grains are made by successive operations: wet agglomeration,
74
rolling, cooking, drying, and screening. In the industrial context, the durum wheat semolina is 75
granulated using mechanical low shear mixers, to imitate the traditional homemade 76
processing (Abecassis, Cuq, Boggini, & Namoune, 2012). Wet granulation stage is one of the
77
critical stage that determines the production yield, the final size, shape and functionalities of 78
the couscous grains (Barkouti, Delalonde, Rondet, & Ruiz, 2014; Hafsa et al., 2015; Hébrard,
79
2002; Oulahna, Hebrard, Cuq, Abecassis, & Fages, 2012; Saad et al., 2011). Only few 80
technical and scientific works are available to rationalize the management of the process, 81
which restricts the potential of rupture innovation by only optimization and incremental 82
solutions. 83
The objective of the present paper is to explore the capability of the fluidised bed technology 84
to produce agglomerates of durum wheat semolina. The impact of different processing 85
conditions on the structure characteristics and functional properties of the agglomerates have 86
been investigated by experiments. Results are discussed in regard to the hydrotextural 87
approach (Thierry Ruiz, Rondet, Delalonde, & Desfours, 2011), in order to get a better
88
representation and understanding of the mechanisms and relationships between process, 89
structure, and properties. 90
Version preprint
2. Material and Methods
92 93
2.1. Raw materials 94
Two different durum wheat semolina were used as raw material for the agglomeration 95
experiments: standard industrial semolina (Panzani group, France) and coarse semolina 96
(UMR IATE, France). Semolina were stored in hermetic containers at 4°C until experiments 97
were carried out. Semolina were characterized using standardized methods (Table 1). The
98
water content was determined according to the approved method 44-15A (AACC, 2000), by
99
weighing after oven drying at 105°C for 24 h. The characteristics values of particle diameters 100
were measured by a laser particle size analyser (Coulter TMLS 230, Malvern, England) at 101
room temperature. The semolina true dry density (𝜌"∗) was measured by using a nitrogen
102
pycnometer (ULTRAPYC 1200e, Quatachrom) after oven drying at 105°C for 24 h. The 103
semolina apparent density (𝜌) was measured by a hydrostatic balance (RB 360, WC Heraeus 104
GmbH, Hanau, Germany). From these values, the compactness of the semolina particles at 105
each water content was calculated as: 𝜙' = (+,-).))
/
∗ . The total nitrogen content (TN) of
106
semolina was determined by the Kjeldahl method, and the crude protein content was 107
calculated according to TN-5.7 based on the AFNOR method V 03-050 (AFNOR, 1970). All
108
experimental measurements were carried out in triplicate. 109
110 111
2.2. Agglomeration process 112
The wet agglomeration process was conducted by using a glass fluidised bed granulator 113
(Mini-Airpro, ProcepT, Belgium) (Fig. 1), whereby the lower portion is conical in shape and
114
the upper portion is cylindrical (height = 0.73 m). Water was used as the liquid binder. Water 115
was sprayed using a nozzle in a downward direction (i.e. in the counter current to the air 116
flow). The temperature of the inlet airflow was kept constant during experiments (25°C) and 117
controlled using a temperature probe (Fig. 1). A constant weight of semolina (300 g) was first
118
introduced inside the unit and was fluidized by ascendant airflow at constant rate (0.70 119
m3/min) for 2 min to equilibrate the temperature. The flow rate of water was kept constant
120
using a peristaltic pump (8 mL/min), and controlled by the continuous measurement of the 121
weight of the water tank. The time for water addition (3, 6, 9, 12.5, or 16.3 min) was defined 122
in regards with the amount of added water (24, 48, 72, 100, or 130 g) that was incorporated 123
inside the reactor, in order to reach specific amount of added water (0.08, 0.16, 0.24, 0.33, or 124
Version preprint
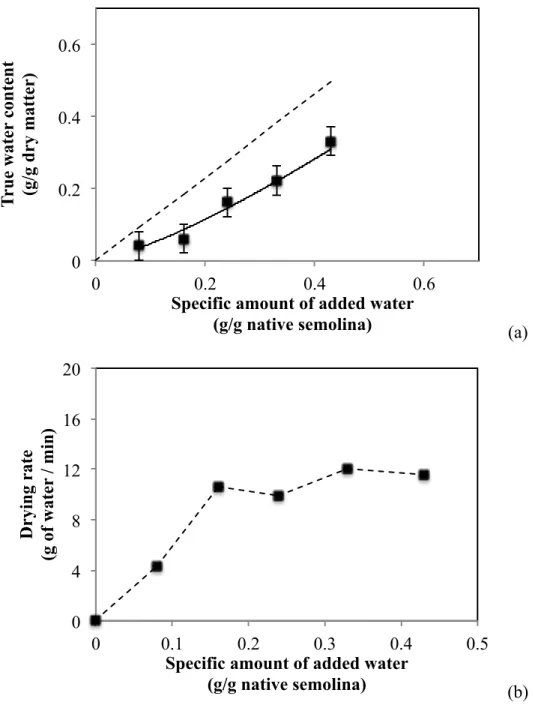
0.43 g of added water / g of semolina), and specific values of apparent process water contents 125
(0.24, 0.33, 0.42, 0.53, or 0.65 g of water / g dry matter). Due to the simultaneous drying 126
mechanisms occurring during processing, the values of the apparent process water content 127
were significantly higher than the true water content measured in the bed at the end of the 128
process (Fig. 2). An almost constant value of the drying rate (11.0 ±0.9 g of water / min) was
129
determined whatever the process conditions. Immediately after the end of the water addition 130
stage, the wet agglomerates were collected. Trials were conducted in triplicate. 131
132 133
2.3. Cooking and drying process 134
Immediately after the agglomeration stage, the collected wet agglomerates were sieved over a 135
column of 2 metallic sieves of decreasing mesh (1.4 and 0.85 mm) for 2 min at ambient 136
temperature. The sieve column was softly shaken manually to limit the possible breakage of 137
the wet agglomerates. The range of mesh size was determined in regards with the capacities 138
of the experimental equipment and with the values classically used for the industrial 139
production of the couscous grains. The wet agglomerates that were collected over the 0.85 140
mm sieve, were immediately spread as a thin layer (about 3 mm) over a stainless steel plate 141
inside a steam cooker (Kenwood rice cooker RC310), and steamed for 10 min at 100°C using 142
saturated steam at atmospheric pressure. The steamed agglomerates were immediately 143
collected, spread as a thin layer (about 3 mm) over stainless steel mesh and then drying in an 144
oven (GallenKamp Plus II oven 150L) for 25 min at 50°C and 15% relative humidity. The 145
dried agglomerates were collected and stored inside hermetic plastic cups until 146
characterization. 147
148 149
2.4. Characterization of the agglomerates 150
Water content - The water content (w) of agglomerates (dry base) was determined on 3-5 g 151
samples, by a drying method in an oven at 105°C for 24 h (AACC, Method 44-15A): 𝑤 =
152
𝑚-/𝑚", mw is the mass of water (g) and ms is the mass of dry matter (g) in the sample. Mean
153
values were determined from triplicate. 154
155
Compactness - The compactness of the agglomerates (𝜙) is calculated using Eq. (1). 156
Version preprint 𝜙 =3/ 3 = 4/ 3.)/∗ (1) 158 159
Where Vs is the solid volume of the agglomerate (cm3 of solid matter); V is the total volume
160
of the agglomerate (cm3); ms is the solid mass (g of dry matter), 𝜌"∗ is the solid real density of
161
durum wheat semolina. The apparent volume (Va) of the agglomerates was measured by
162
using a Camsizer (Retsch, Germany) digital image analyser. The solid mass (ms) was
163
measured with a digital balance with sensitivity of 0.001 g. In the case of unsaturated 164
structures, the compactness is a function of the water content and the saturation degree 165
(S=Vw/Vvoid) and for strictly wet media (0 < S ≤ 1) Eq. (2) can be written as follow:
166 167 𝜙(𝑤, 𝑆) = + +,7/∗89 (2) 168 169
Size distribution of the wet agglomerates - The wet agglomeration process generates 170
agglomerates with dispersed sizes, which were measured directly after the agglomeration 171
stage. Size distribution was determined by sieving all the collected agglomerates over a 172
column of 7 metallic sieves of decreasing mesh size (3.35, 2.8, 2.36, 1.40, 0.85, 0.71, and 173
0.425 mm). The sieve column was manually shaken for only 1 min, to limit the possible 174
particle breakage. The size distribution was obtained by weighing the mass of agglomerates 175
remaining on each sieve. The weight distribution according to size criteria was expressed as 176
the percent of total weight. Even if the particle size distribution curves were not fully 177
unimodal, the apparent median diameter (d50) and apparent span: (d90-d10)/d50, of the size
178
distribution were calculated as global apparent descriptors. The agglomerates, that were 179
collected on the sieves of 0.425, 0.71, 0.85, 1.40, or 2.36 mm mesh size, were characterized 180
by their size, water content, and compactness. 181
182
Median diameter of the dried agglomerates - Samples of agglomerates (about 10 g) were 183
used to determine the median diameter on each sieve, using the Camsizer (Retsch, Germany) 184
digital image analyser. Particle size distributions were characterized by the value of the 185
median diameter. Measurements were conducted in triplicate. 186
187
Agglomerates shape – The sphericity of the dried agglomerates was determined by using the 188
Camsizer (Retsch, Germany) digital image analyser. Samples of agglomerates (about 10 g) 189
were used. Sphericity is a aspect ratio defined by the measurement of the length/width 190
Version preprint
relationship. The values range between 0 (perfect circle) and 1 (needle shaped object). 191
Measurements were conducted in triplicate. 192
193
Agglomerates microstructure - The microstructure of the dried agglomerates was observed by 194
scanning electron microscopy (Inspect F by FEI operating at 5kV). A sample of agglomerates 195
was dispersed on a conducting carbon tape prior to analysis. Representative pictures were 196
selected for each sample. 197
198
Agglomerates strength - The strength of the dried agglomerates was measured using a texture 199
analyser (TA-HD Plus, Stable Micro Systems, UK). The agglomerates strength is defined as 200
the force needed to compress one agglomerate over a distance of 400 µm. A 5 kg load cell 201
was used with a compressive probe operating at 100 µm.s−1. Texture experiments were
202
conducted by characterizing the agglomerates one by one. It was thus not possible to 203
characterize a large number of agglomerates. A restricted number of agglomerates (about 10) 204
having some homogeneity in their size, to be statistically representative of the sample were 205
tested. Mean values were determined from 10 measurements. 206
207
2.5. Statistical analysis 208
The statistical significance of results was assessed using single factor analysis of variance 209
(ANOVA). Multiple comparisons were performed by calculating the least significant 210
difference using Microsoft Excel 2010, at a 5% significance level. 211
212 213
Version preprint
3. Results
214 215
3.1. Characterisation of the wet agglomerates after the agglomeration stage 216
The wet agglomeration process by using the fluidized bed was first conducted with the 217
standard semolina and apparent process water content of 0.53 g/g dry matter. As expected, 218
the wet agglomerates collected after the fluidized bed processing were characterized by high 219
values of measured water content (0.37 ±0.04 g/g dry matter) and low values of compactness 220
(0.41 ±0.04), compared to the native semolina particles (0.148 g/g dry matter and 0.85, 221
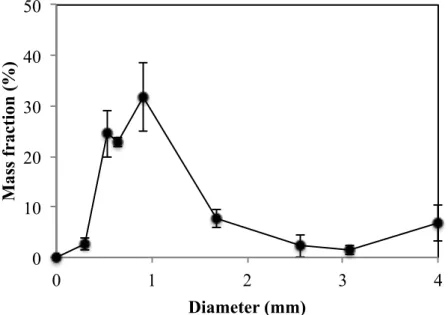
respectively). The size distribution of the wet agglomerates (Fig. 3) demonstrated a relatively
222
large range in the diameter values (from 500 to more than 4000 µm), with median diameter 223
(d50) close to 650 µm (±3 µm). The value of the span (2.27) was relatively low, indicating
224
that the majority of the grains were centred on the median diameter. The mass fraction of the 225
wet agglomerates with diameter ranging between 1000 and 2000 µm was about 40%. This 226
value is almost similar than the mass yield usually observed during the industrial processing 227
of the couscous grains using low shear mechanical mixers (Abecassis et al., 2012).
228
The physicochemical characteristics of the wet agglomerates were measured for each class of 229
agglomerates as a function to their diameter (Fig. 4). The water content of the wet
230
agglomerates was positively correlated with their diameter (Fig. 4a). Similar positive
231
correlations have already been observed for the wet agglomerates of durum wheat semolina 232
processed by the mechanical mixing under low shear conditions (Barkouti et al., 2012;
233
Bellocq, Ruiz, Delaplace, Duri, & Cuq, 2017). 234
The increase in the median diameter of the wet agglomerates is also associated to changes in 235
compactness (Fig. 4b). The compactness of the wet agglomerates decreases (from 0.43 to
236
0.36) with an increase in the median diameter until 1600 µm. Above 1600 µm, the 237
compactness tends to increase as the median diameter increases. 238
The results also demonstrated a positive relationship between the values of sphericity and the 239
diameter of the wet agglomerates (Fig. 4c). The large agglomerates were more spherical than
240
the small ones. It should be noticed that the wet agglomerates with diameters between 1000 241
and 2000 µm were characterized by high values of sphericity (0.82 - 0.87) and low values of 242
compactness (0.36 - 0.40), when compared to the wet agglomerates obtained by using a low 243
shear mechanical mixer (0.67 and 0.61, respectively) (Bellocq et al., 2017).
244 245 246
3.2. Impact of the process parameters of the fluidized bed 247
Version preprint
248
3.2.1. Impact of the amount of water 249
The impact of the water content of the bed was studied by applying different processing times 250
for water spraying. The physicochemical characteristics of the wet agglomerates were 251
measured for each class of wet agglomerates according to their diameter, and plotted for the 252
different measured true water content from 0.19 to 0.48 g/g dry matter (Fig. 5-7). Increasing
253
the water content did not significantly change the shape of the curve of the size distribution, 254
but generated higher amounts of the fractions of the large agglomerates (Fig. 5). An increase
255
in the water content improved the capability of the fluidised bed to produce higher amounts 256
of the wet agglomerates of larger diameter. The mass fraction of agglomerates between 1000 257
and 2000 µm reached a value of 66% when processed at 0.48 g / g dry matter. 258
An increase in the water content induced an almost linear increase in the median values (d50
259
from 349 µm to 1032 µm) of the diameter (Fig. 6). The values of the diameter span were
260
constant (from 1.49 to 1.10) with true water content from 0.24 to 0.42 g/g dry matter. It then 261
increased with values of water content higher than 0.37 g/g dry matter. 262
The relationships between the diameter and measured water contents for the different wet 263
agglomerates did not change (Fig. 7a), whatever the amount of added water. There were
264
positive relationships between diameter and water content of the wet agglomerates. The large 265
agglomerates were more hydrated than the small ones. 266
The impact of an increase of the amount of added water on the measured water content of the 267
wet agglomerates depended on their diameter (Fig. 7a). Increasing the amount of water
268
largely increased the water content of the agglomerates. We could suppose that the fluidized 269
bed homogeneously distributed the added water over the small grains and the grains of 270
intermediate size. 271
An increase in the amount of added water decreased the compactness of the wet 272
agglomerates, irrespectively of their diameter. Nevertheless, increasing the amount of added 273
water did not significantly change the dependence observed previously, between the 274
compactness and the diameter of the wet agglomerates (Fig. 7b). The compactness decreased
275
with an increase in the median diameter until a median diameter close to 1600 µm. The 276
compactness then slightly increase with an increase in diameter above 1600 µm. Similar 277
phenomena were observed whatever the amount of added water added during processing. 278
Whatever the amount of added water, the large agglomerates were more spherical than the 279
small ones (Fig. 7c). An increase in the amount of water did not have a significantly impact
Version preprint
on the sphericity of the wet agglomerates. The wet agglomerates were characterized by the 281
same values of sphericity, depending on their diameter. 282
283 284
3.2.2. Impact of the particle size of the native semolina 285
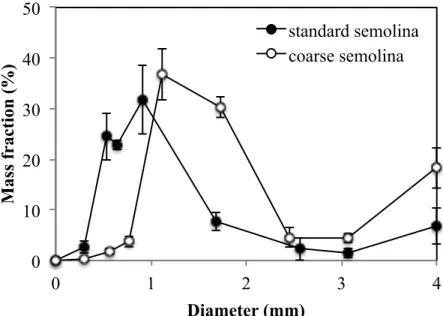
We evaluated the influence of the diameter of the native raw material, by comparing the 286
agglomeration behaviour of the standard semolina (d50 = 280 µm) and coarse semolina (d50 =
287
619 µm) (Fig 8-9). It was possible to produce wet agglomerates by the fluidised bed using the
288
coarse semolina. Using coarse semolina favoured the production of larger wet agglomerates 289
(Fig 8), with higher value of median diameter (d50 = 1273 µm) and similar span (2.11), when
290
compared to those previously determined using the standard semolina (d50 = 650 µm and
291
span = 2.27). It is recognized that the wet agglomeration process increases the diameter of the 292
structures of approximately a decade, regarding to the size of the native particles (T. Ruiz, 293
2012). 294
Using the coarse semolina gave wet agglomerates with lower values of water content and 295
compactness (Fig 9a-9b). By incorporating the same amount of water in the fluidized bed
296
(100 g), we could expect the same measured water content in the bed and for the wet 297
agglomerates at the end of the wet agglomeration, whatever the type of semolina. However, 298
the measured water content of the collected powder is close to 0.30 ±0.04 g/g dry matter, 299
which is broadly lower than the value measured using the standard semolina (0.37 ±0.04 g/g 300
dry matter). The lower values of compactness of the wet agglomerated of coarse semolina 301
could lead to higher water evaporation mechanisms during fluidized bed processing and to 302
lower values of water content. 303
Using the coarse semolina significantly affected the values of sphericity (Fig 9c). A slight
304
decrease in the values of sphericity was observed from the small to the large wet 305
agglomerates, while a positive relationship was demonstrated for the standard semolina. The 306
large agglomerates were less spherical than the small ones. It could be more difficult to form 307
a spherical grain with fewer and larger particles. 308
309 310
3.3. Characterisation of the agglomerates after cooking and drying 311
After sieving, the wet agglomerates that were collected between the sieves 850 and 1400 µm 312
were processed by two successive stages: steam cooking and final drying. The 313
Version preprint
characterization of the agglomerates was conducted after the cooking stages and after the 314
final drying stage (Fig. 10 and Table 2).
315
The steam cooking stage and the drying stage did not change the shape of the distribution 316
curves of the diameters of the agglomerates of semolina (Fig. 10). The size distribution of the
317
wet agglomerates was almost fixed by the wet granulation stage (Table 2) and only slightly
318
affected by the steam cooking stage and by the drying stage. The median diameter of the wet 319
agglomerates (d50 = 910 µm) was slightly increased by the subsequent steam-cooking stage
320
(d50 = 1000 µm) due to partial water absorption and swelling mechanisms. The final drying
321
stage slightly reduced the median diameter of the agglomerates through possible shrinking 322
mechanisms (d50 = 950 µm). The results also demonstrated that the span of the distribution of
323
the diameters of the wet agglomerates (0.47) was slightly increased by the cooking stage 324
(0.53) and by the drying stage (0.64). It could be associated with some breakage or collapse 325
mechanisms generated by these two stages, that increase the range of the diameters. The 326
present results indicated that distribution of the diameters of the agglomerates of durum 327
wheat was mainly controlled by the agglomeration process stage. This stage greatly 328
controlled the total yield of dried agglomerates production of correct diameter, according to 329
the classic couscous manufacturing. 330
The steam-cooking stage induces swelling caused by hydration. This phenomenon reduced 331
the compactness (0.30), which corresponds to the increase of the agglomerates volume 332
exactly due to the increasing of the water content (0.45 g/g dry matter) (Table 2). The
333
cooking stage promotes mechanisms of expansion due to water absorption and swelling 334
mechanisms, which take place at the scale of the wheat components. These heat and mass 335
transfers impact some physico-chemical changes under high temperature, such as starch 336
gelatinization. The swelling of the agglomerates seemed to be more important than the 337
progressive filling of their internal pore by the water molecules. 338
The drying stage induced an increase in the compactness (0.49) and a decrease in the water 339
content (0.14) of the agglomerates (Table 2). The dewatering generates slight mechanisms of
340
shrinking, which induce a decrease of the internal porosity and diameter of the agglomerates. 341
The drying stage contributes to the texturation of the grains by the densification of the 342
structure. 343
We observed that swelling and shrinking mechanisms generated by the successive steam 344
cooking and drying stages did not significantly affect the sphericity of the agglomerates 345
(Table 2). Water penetration and water extraction were in isotropic condition of the transfers 346
in this case. The sphericity ranged from 0.687 after the wet agglomeration stage and 0.662 347
Version preprint
after the drying stage. The wet agglomeration stage mainly determined the sphericity of the 348
agglomerates. 349
The microstructure of the dried agglomerates were observed by scanning electron microscopy 350
and compared to those of industrial couscous grains (Fig. 11). The dried agglomerates of
351
durum wheat semolina processed by the fluidised bed are characterized by irregular shape, 352
with very rough surfaces. The native semolina particles were clearly visible and 353
distinguishable in the dried agglomerates: they appeared as semi discrete particles glued to 354
each other. The dried agglomerates were not dense objects as internal porosity between 355
adjacent particles was observed demonstrating that solid fusion between the semolina 356
particles had not occurred. On the other hand, the classical couscous grains were 357
characterized by spherical shape with regular surfaces. The native semolina particles were 358
poorly visible in the grains, as they were partly glued to each other. The grains were almost 359
dense objects, as only little internal porosity can be observed demonstrating that solid fusion 360
between the semolina particles had largely occurred. 361
The mechanical properties of the agglomerates were measured by the mean force required to 362
compress them (Table 3). As expected, the wet agglomerates were characterized by lower
363
values of mechanical strength. The cooking and drying stage improved the mechanical 364
resistance of the agglomerates by increasing the mechanical strength (from 1.23 to 4.25 N). 365
However, the force required compressing the dried agglomerates produced by the fluidized 366
bed processing remained significantly lower than those measured for the classical couscous 367
grains (23 N). 368
Version preprint
4. Discussion
370
Granulation process by using the fluidized bed technology generates agglomerates of durum 371
wheat semolina with specific functional attributes. The present results describe the 372
potentialities of the fluidized bed to agglomerate wheat powders and investigate the process - 373
structure - properties relationships. The final properties of the dried agglomerates can be 374
discussed in regards with the classical couscous grains that are granulated by using low shear 375 mixers. 376 377 378 4.1 Hydrotextural analysis 379
Whatever the investigated process conditions using the standard semolina, the growth of the 380
wet agglomerates was characterized by one positive correlation between water contents and 381
diameters (Fig. 7a), and by a specific diameter (d50 = 1600 µm) that separated two
382
correlations between compactness and diameter: a negative slope at d50 ≤ 1600 µm and a
383
positive slope at d50 ≥ 1600 µm (Fig. 4b and7b).
384
For the d50 ≤ 1600 µm, a power law (Eq. 3) can be used to describe the relationship between
385
the compactness and the median diameter: 386
387
𝜙 = 𝐴;𝑑;(=>?@) (3)
388 389
where Ai is a prefactor characterizing the amplitude of the phenomenon and Df is the mass
390
fractal dimension linked to the growth mechanism of the grain. The existence of a power law 391
relationship between the diameter and the compactness was demonstrated by Rondet et al.
392
(2010) during the wet agglomeration of various powders (kaolin, microcrystalline cellulose, 393
and calcium phosphate) using low shear mixers. Our results could be interpolated with a good 394
agreement by the power law (R2 from 0.68 to 0.98) (Table 4). For d50 ≤ 1600 µm, the
395
calculated values of the Df factor (2.81 - 2.90) were not affected by the changes in the water
396
content. We only observed a decrease in the Ai values (from 0.48 to 0.32) when increasing
397
the water content. The prefactor is linked to the nuclei characteristics (compactness and 398
median diameter). Explanation of this variation needs to characterise the nuclei, elementary 399
association of semolina, which lead to the agglomerate structure by association, unrealised in 400
this study. By this analyse, mechanism for the wet agglomeration using the fluidized bed in 401
the cited process conditions can be considered as fractal morphogenesis for the smaller 402
Version preprint
structures (d50 ≤ 1600 µm). Saad et al. (2011) also found a fractal-structuring model to
403
describe the agglomeration of durum wheat semolina using a low shear mixer with a value of 404
Df = 2.89 and Ai = 0.56.
405
For d50 ≥ 1600 µm, the value of the compactness slightly increased with the diameter of the
406
agglomerates (Fig. 4b and 7b). This increase in compactness could be associated to the values
407
of Df close to 3. We could then suppose that some phenomena of densification of the grains
408
occurred for the larger structures (d50 ≥ 1600 µm) due to collisions with the wall and/or
409
between the agglomerates themselves in the fluidized bed velocity field. 410
Considering the coarse semolina, the calculated value of Df = 2.56 was lower than this
411
obtained with the standard semolina (Fig. 9b). The lower value of Df could indicate that the
412
agglomeration process induces less mechanisms of densification on the investigated range of 413
water contents. 414
The values of the physico-chemical characteristics of the wet agglomerates can also be 415
discussed according to the hydrotextural analysis (Ruiz, Delalonde, Bataille, Baylac, &
416
Dupuy de Crescenzo, 2005). The wet agglomerates were considered as the superposition of 417
three dispersed phases: solid particles, liquid and gaseous phases. Three non-reduntant 418
variables provide a description of the system in term of mass and volume. The easiest chosen 419
variables are generally the apparent volume (V), the mass of water (Mw) and the mass of solid
420
(Ms). These variables were used to calculate the water content, the compactness and the
421
saturation degree. 422
The hydrotextural diagram is limited in its upper part by the saturation curve, which 423
represents the maximum water content that a grain of a given constant compactness can 424
contain (Fig. 12). The saturation curve is calculated using Eq. (4):
425 426 𝜙"AB = + +,7/∗-/CD (4) 427 428
Whatever the process conditions, the values of water content and compactness measured for 429
the wet agglomerates were located under the saturation curve (Fig. 12). The wet agglomerates
430
were porous structures at the scale of semolina particles (intraparticle porosity) and between 431
particles (interparticle porosity). The range of variation of the compactness is essentially due 432
to the particle re-arrangment. During the add of water, the filling of the interparticle voids did 433
not occur by a simple remove of the air trapped. Capillary forces induced a re-arrangment 434
Version preprint
between the particles that was observed by a variation of the compactness (Fig. 12) and the
435
saturation degree. 436
The saturation degree increased (from 0.20 to 0.44) with an increase in the water content: 437
experimental values became closer to the saturation curve (Fig. 12). It was observed that the
438
growth could be fitted by a sigmoidal curve, comparable to this purposed by Ruiz et al.
439 (2005) : 440 441 𝑆 𝑤 = 1 − + +,G8H8IJ (5) 442 443
where wm is the water content at S=50% and d is the reverse slope of the central quasi-linear
444
section of the sigmoidal curve. The relationship between water content and compactness (Fig.
445
12) means that inter granular arrangements led to an expansion followed by a densification of
446
the wet agglomerates. The first stage of expansion was induced with an addition of water: the 447
compactness decreased significantly and the saturation degree slightly increased. During the 448
second stage, the structures continued to grow up but with densification mechanisms due to 449
the capillarity influence. During this stage, the compactness slightly changed but the 450
saturation degree highly increased, which correspond to a high filling of the inter granular 451
voids. By associating Eq. (2) and Eq. (5), it was possible to describe the variation of the
452
compactness by the water content, the real densities of the solid and liquid phases and the two 453 parameters (wm and d): 454 455 𝜙 𝑤 = + +,7/∗-(+?GH 8H8I J ) (6) 456 457
This relationship (Eq. 6) reduces to one (water content) the number of state variables
458
necessary and sufficient to describe the structure of the wet agglomerates of durum wheat 459
semolina produced by using the fluidized bed. In all case, our results could be interpolated 460
with a good agreement (R2 = 0.93) by the relationship using Eq. (6), wm = 0.822 and d =
461
0.513. Our experimental results did not investigate the properties of the wet agglomerates 462
beyond this stage. Consolidation mechanisms could follow the stage of densification (Ruiz et
463
al. 2005). The values of water content and compactness of the agglomerates measured after 464
the agglomeration, cooking, and drying stages were presented on the hydro-textural diagram 465
(Fig. 13). The cooked and dried agglomerates were not dense grains as they remain under the 466
Version preprint
saturation curve. It can be observed that the phenomenon of retraction during the drying stage 467
increased the compactness of the grains. The dried grains of wheat semolina produced using 468
the fluidized bed technology were significantly different from the classical couscous grains, 469
which were more compact and almost saturated. 470
471 472
4.2 Comparison with the couscous grains 473
The dried grains of durum wheat semolina produced by the fluidized bed were more brittle 474
and less compact than the classical couscous grains. Using the fluidized bed technology, the 475
water addition stage was critical as it promotes the cohesion between the particles and the 476
physicochemical reactivity of the wheat components. The simultaneous agglomeration and 477
drying mechanisms restricted the contribution of the physicochemical reactivity of the wheat 478
components at the surface of particles, which were briefly in contact with water. Adhesion 479
between the particles could mainly comes from physical forces, as capilarity forces, and 480
liquid bridges involving superficial mechanisms. This may explain the lower compactness in 481
the grain prepared by fluidized bed processing. It can be supposed that partial starch 482
gelatinisation mechanisms only occurs at the interface between the particles. The resulting 483
strength to compress the granules was significantly lower than those measured for the 484
classical couscous grains. The classical couscous grains were more compact and consolidated 485
by complete starch gelatinisation during the cooking stage. The fluidized bed technology 486
produced agglomerates of durum wheat semolina with specific functional attributes, which 487
were significantly different from those associated with the couscous grains. 488
489 490
4.3 Process efficiency 491
The process efficiency is related to the mass fraction of wet agglomerates with diameter 492
between 1000 and 2000 µm collected after the granulation stage. It is admitted that the wet 493
agglomeration stage controls for the process efficiency of the manufacture of the industrial 494
couscous grains (Abecassis et al., 2012). The classical low shear mixers generate low process
495
yield, with only 30 to 40% of grains with correct diameter and high amounts of out of 496
specification wet grains that do not have the correct diameter. In the present study, the 497
fluidized bed technology allowed reaching high values of yield of agglomeration, close to 498
66%. The fluidized bed granulation process generated low dispersion in the diameter of the 499
wet agglomerates, with a low proportion of the too large grains (only 10%), compared to 500
Version preprint
those obtained by a low shear mixer (20-25%). Fluidized bed technology could be a novel 501
way to produce high amounts of agglomerates of durum wheat semolina. 502
Version preprint
5. Conclusion
503
The agglomeration process using a fluidized bed has been found to produce agglomerates of 504
durum wheat with different attributes compared to those produced by granulation using low 505
shear mixers. The dried agglomerated grains obtained using the fluidized bed were less 506
compact than the traditional couscous grains manufactured using low shear mixers. Fluidized 507
bed granulation allowed producing higher amounts of agglomerates with diameter between 508
1000 and 2000 µm. Whatever the process conditions, the relationship between the 509
compactness and the median diameter can be described using a power law model. It allowed 510
demonstrating that agglomeration is driven by a fractal formation process for the wets 511
agglomerates with d50 ≤ 1600 µm, and by densification mechanisms for the large
512
agglomerates (d50 ≥ 1600 µm). This result indicates that the mechanisms which occur in the
513
fluidized bed present analogy between low shear mixer agglomeration. By using the 514
hydrotextural diagram, we proposed a specific model to describe the interparticle 515
arrangements, which associated expansion and densification of the wet agglomerates. The 516
relationship between the saturation degree and the compactness of the wet agglomerates was 517
reduced to only one state variables to describe the agglomeration mechanisms of durum 518
wheat semolina using a fluidized bed. This result is interesting because by using Eq. (3) and
519
Eq. (6), we could predict the variation of the median diameter of agglomerates at different 520
water contents. Investigation of the nucleation phase needs to be conduct to describe the 521
agglomeration mechanism with more details. As in the case of agglomeration in high shear 522
mixer, nucleation regimes could be identified in relation to the hydrodynamic conditions of 523
the fluidized bed process. 524 525 526 Acknowledgments 527 528
The authors would like to thank the Agence Nationale de la Recherche (ANR ALID 2013) 529
for its financial support through the program “Dur Dur”. 530
531 532
Version preprint
References
533
AACC. (2000). American Association of Cereal Chemists (Official M). The Association, St. 534
Paul, MN, USA. 535
Abecassis, J., Cuq, B., Boggini, G., & Namoune, H. (2012). Other traditional durum derived 536
products. In Durum wheat: chemistry and technology (2nd Ed. AA, pp. 177–200). 537
AFNOR. (1970). Directives générales pour le dosage de l’azote avec minéralisation selon la 538
méthode de Kjeldahl. In Norme Française V03-050. 539
Banjac, M., Stakic, M., & Voronjec, D. (1998). Kinetics of agglomeration of milk powder in 540
a vibro-fluidized bed. In 11th International Drying Symposium (pp. 998–1005). 541
Barkouti, A., Delalonde, M., Rondet, E., & Ruiz, T. (2014). Structuration of wheat powder by 542
wet agglomeration: Case of size association mechanism. Powder Technology, 252, 8–13. 543
Barkouti, A., Rondet, E., Delalonde, M., & Ruiz, T. (2012). Influence of physicochemical 544
binder properties on agglomeration of wheat powder in couscous grain. Journal of Food 545
Engineering, 111(2), 234–240. 546
Barkouti, A., Turchiuli, C., Carcel, J. A., & Dumoulin, E. (2013). Milk powder agglomerate 547
growth and properties in fluidized bed agglomeration. Dairy Science and Technology, 548
93, 523–535. 549
Bellocq, B., Ruiz, T., Delaplace, G., Duri, A., & Cuq, B. (2017). Screening efficiency and 550
rolling effects of a rotating screen drum used to process wet soft agglomerates. Journal 551
of Food Engineering, 195, 235–246. 552
Boerefijn, R., & Hounslow, M. J. (2005). Studies of fluid bed granulation in an industrial 553
R&D context. Chemical Engineering Science, 60(14), 3879–3890. 554
Cuq, B., Mandato, S., Jeantet, R., Saleh, K., & Ruiz, T. (2013). Agglomeration / granulation 555
in food powder production. In Handbook of Food Powders: Processes and Properties 556
(pp. 150–177). Woodhead publishing. 557
Dacanal, G. C., & Menegalli, F. C. (2010). Selection of operational parameters for the 558
production of instant soy protein isolate by pulsed fluid bed agglomeration. Powder 559
Technology, 203(3), 565–573. 560
Hafsa, I., Mandato, S., Ruiz, T., Schuck, P., Jeantet, R., Mejean, S., Chevallier, S., Cuq, B. 561
(2015). Impact of the agglomeration process on structure and functional properties of the 562
agglomerates based on the durum wheat semolina. Journal of Food Engineering, 145, 563
25–36. 564
Hébrard, A. (2002). Granulation de semoules de blé dur. Thèse de doctorat. Ecole nationale 565
supérieure d’agronomie de Montpellier. 566
Version preprint
Hemati, M., Cherif, R., Saleh, K., & Pont, V. (2003). Fluidized bed coating and granulation: 567
Influence of process-related variables and physicochemical properties on the growth 568
kinetics. Powder Technology, 130, 18–34. 569
Iveson, S. M., Litster, J. D., Hapgood, K. P., & Ennis, B. J. (2001). Nucleation, growth and 570
breakage phenomena in agitated wet granulation processes: a review. Powder 571
Technology, 117(1), 3–39. 572
Jacob, M. (2007). Granulation Equipment. In Handbook of Powder Technology vol.11 (pp. 573
417–476). Amsterdam: Elsevier. 574
Ji, J., Fitzpatrick, J., Cronin, K., Fenelon, M. A., & Miao, S. (2017). The effects of fluidised 575
bed and high shear mixer granulation processes on water adsorption and flow properties 576
of milk protein isolate powder. Journal of Food Engineering, 192, 19–27. 577
Leuenberger, H., Puchkov, M., Krausbauer, E., & Betz, G. (2009). Manufacturing 578
pharmaceutical granules: Is the granulation end-point a myth? Powder Technology, 189, 579
141–148. 580
Morin, G., & Briens, L. (2014). A comparison of granules produced by high-shear and 581
fluidized-bed granulation methods. Pharmaceutical Science and Technology, 15(4), 582
1039–48. 583
Nienow, A. W. (1995). Fluidised Bed Granulation and Coating: Applications To Materials, 584
Agriculture and Biotechnology. Chemical Engineering Communications, 139(1), 233– 585
253. 586
Oulahna, D., Hebrard, A., Cuq, B., Abecassis, J., & Fages, J. (2012). Agglomeration of 587
durum wheat semolina: Thermodynamic approaches for hydration properties 588
measurements. Journal of Food Engineering, 109(3), 619–626. 589
Palzer, S. (2011). Agglomeration of pharmaceutical, detergent, chemical and food powders - 590
Similarities and differences of materials and processes. Powder Technology, 206, 2–17. 591
Pathare, P. B., Baş, N., Fitzpatrick, J. J., Cronin, K., & Byrne, E. P. (2012). Production of 592
granola breakfast cereal by fluidised bed granulation. Food and Bioproducts Processing, 593
90(3), 549–554. 594
Philippsen, C. G., Vilela, A. C. F., & Zen, L. D. (2015). Fluidized bed modeling applied to 595
the analysis of processes: Review and state of the art. Journal of Materials Research and 596
Technology, 4(2), 208–216. 597
Rambali, B., Baert, L., & Massart, D. L. (2001). Using experimental design to optimize the 598
process parameters in fluidized bed granulation on a semi-full scale. International 599
Journal of Pharmaceutics, 220, 149–160. 600
Version preprint
Rieck, C., Hoffmann, T., Bück, A., Peglow, M., & Tsotsas, E. (2015). Influence of drying 601
conditions on layer porosity in fluidized bed spray granulation. Powder Technology, 602
272, 120–131. 603
Rondet, E., Delalonde, M., Ruiz, T., & Desfours, J. P. (2010). Fractal formation description 604
of agglomeration in low shear mixer. Chemical Engineering Journal, 164(2–3), 376– 605
382. 606
Ruiz, T. (2012). Explorations d'archétypes de mélanges grains , gouttes , bulles. Habilitation 607
à diriger des recherches. Université de Montpellier 2. 608
Ruiz, T., Delalonde, M., Bataille, B., Baylac, G., & De Crescenzo, C. D. (2005). Texturing 609
unsaturated granular media submitted to compaction and kneading processes. Powder 610
Technology, 154(1), 43–53. 611
Ruiz, T., Rondet, E., Delalonde, M., & Desfours, J. P. (2011). Hydro-textural and consistency 612
surface states of humid granular media. Powder Technology, 208(2), 409–416. 613
Saad, M. M., Barkouti, A., Rondet, E., Ruiz, T., & Cuq, B. (2011). Study of agglomeration 614
mechanisms of food powders: Application to durum wheat semolina. Powder 615
Technology, 208(2), 399–408. 616
Saleh, K., & Guigon, P. (2009). Mise en œuvre des poudres Granulation humide : bases et 617
théorie. Techniques de L’ingénieur, J2254. 618
Smith, P. G., & Nienow, A. W. (1983). Particle growth mechanisms in fluidised bed 619
granulation - the effect of process variables. Chemical Engineering Science, 38(8). 620
Turchiuli, C., Eloualia, Z., El Mansouri, N., & Dumoulin, E. (2005). Fluidised bed 621
agglomeration: Agglomerates shape and end-use properties. Powder Technology, 157, 622
168–175. 623
Turchiuli, C., Fuchs, M., Bohin, M., Cuvelier, M. E., Ordonnaud, C., Peyrat-Maillard, M. N., 624
& Dumoulin, E. (2005). Oil encapsulation by spray drying and fluidised bed 625
agglomeration. Innovative Food Science and Emerging Technologies, 6, 29–35. 626
Turchiuli, C., Smail, R., & Dumoulin, E. (2013). Fluidized bed agglomeration of skim milk 627
powder: Analysis of sampling for the follow-up of agglomerate growth. Powder 628
Technology, 238, 161–168. 629
Zhai, H., Li, S., Andrews, G., Jones, D., Bell, S., & Walker, G. (2009). Nucleation and 630
growth in fluidised hot melt granulation. Powder Technology, 189(2), 230–237. 631
632 633
Version preprint
634
Fig. 1. Schematic description of the fluidized bed equipment.
635 636
Atomising nozzle air
Air outlet A ir W ate r Filters A ir Heating system Air flow Temperature probe Nozzle Peristaltic pump Distributor place Balance Water
Version preprint (a) 637 (b) 638 639
Fig. 2. Experimental curves of the true water contents (a) and the drying rates (b) as a
640
function of the specific amount of added water in the fluidized bed (the dotted line in figure 641
(a) corresponds to the apparent process water content). 642 643 0 0.2 0.4 0.6 0 0.2 0.4 0.6 T ru e w ate r c on te n t (g/ g d ry matte r)
Specific amount of added water (g/g native semolina) 0 4 8 12 16 20 0 0.1 0.2 0.3 0.4 0.5 D ryi n g r ate (g of w ate r / mi n )
Specific amount of added water (g/g native semolina)
Version preprint
644 645
Fig. 3. Distribution curve of the diameters of the wet agglomerates processed by the fluidized
646
bed (experiments using standard semolina and true water content of 0.37 g/g dry matter). 647 648 0 10 20 30 40 50 0 1 2 3 4 M as s fr ac ti on (%) Diameter (mm)
Version preprint (a) 649 (b) 650 (c) 651
Fig. 4. Distribution curves of the measured values of water content (a), compactness (b) and
652
sphericity (c), as a function of the diameter of the wet agglomerates processed by the 653
fluidized bed (experiments using standard semolina and true water content of 0.37 g/g dry 654
matter). (The dotted line in figure (b) is the fractal model using Eq.(3))
655 656 0.2 0.3 0.4 0.5 0.6 0 0.5 1 1.5 2 2.5 3 M eas u re d w ate r c on te n t (g/ g d ry matte r) Diameter (mm) 0.2 0.3 0.4 0.5 0.6 0 0.5 1 1.5 2 2.5 3 C omp ac tn es s (s ol id vol u me fr ac ti on ) Diameter (mm) 0 0.2 0.4 0.6 0.8 1 0 0.5 1 1.5 2 2.5 3 S p h er ic ity (-) Diameter (mm)
Version preprint
657
Fig. 5. Impact of the true water content on the distribution curves of the diameters of wet
658
agglomerates processed by the fluidized bed (experiments using standard semolina). 659 660 0 10 20 30 40 50 60 0 1 2 3 4 M as s fr ac ti on (%) Diameter (mm) 0.19 0.21 0.31 0.37 0.48
Version preprint
661
Fig. 6. Impact of the true water content on the median diameters (d50) of wet agglomerates
662
processed by the fluidized bed. 663 664 0.3 0.5 0.7 0.9 1.1 0.1 0.2 0.3 0.4 0.5 0.6 M ed ian d iame te r (mm)
Version preprint (a) 665 (b) 666 (c) 667
Fig. 7. Distribution curves of the measured values of the water content (a), compactness (b),
668
and sphericity (c), as a function of the diameter of wet agglomerates processed by the 669
fluidized bed at different true water contents (from 0.19 to 0.48 g / g of dry matter). 670 671 0 0.2 0.4 0.6 0.8 0 1 2 3 M eas u re d w ate r c on te n t (g/ g d ry matte r) Diameter (mm) 0.19 0.21 0.31 0.37 0.48 0.2 0.3 0.4 0.5 0.6 0.3 1.3 2.3 3.3 C omp ac tn es s (s ol id vol u me fr ac ti on ) Diameter (mm) 0.19 0.21 0.31 0.37 0.48 0 0.2 0.4 0.6 0.8 1 0.3 1.3 2.3 3.3 sp h er ic ity (-) Diameter (mm) 0.19 0.21 0.31 0.37 0.48
Version preprint
672
Fig. 8. Impact of the diameter of the semolina on the distribution curves of the diameters of
673
wet agglomerates processed by the fluidized bed. 674 675 0 10 20 30 40 50 0 1 2 3 4 M as s fr ac ti on (%) Diameter (mm) standard semolina coarse semolina
Version preprint (a) 676 (b) 677 (c) 678
Fig. 9. Impact of the diameter of the particles of semolina on the values of water content (a),
679
compactness (b), and sphericity (c) as a function of the diameter of wet agglomerates 680
processed by the fluidized bed. (The dotted lines figure (b) is the power law model using Eq.
681 (3)). 682 683 0 0.2 0.4 0.6 0 0.5 1 1.5 2 2.5 3 M eas u re d w ate r c on te n t (g/ g d ry matte r) Diameter (mm) standard semolina coarse semolina 0.2 0.4 0.6 0.8 0 0.5 1 1.5 2 2.5 3 C omp ac tn es s (s ol id vol u me fr ac ti on ) Diameter (mm) standard semolina coarse semolina 0 0.2 0.4 0.6 0.8 1 0 0.5 1 1.5 2 2.5 3 S p h er ic ity (-) Diameter (mm) standard semolina coarse semolina
Version preprint
684
Fig. 10. Distribution curves of the diameters of the agglomerates after the agglomeration,
685
cooking and drying stages (experiments using standard semolina and true water content of 686 0.37 g/g dry matter). 687 688 0 10 20 30 0 0.5 1 1.5 2 2.5 M aas F re q u en cy (%) Size (mm) Agglomeration Cooking Drying
Version preprint
689
Fig. 11. Microstructure of the agglomerates based on of durum wheat semolina prepared with
690
the fluidized bed (a) and commercial couscous grains (b) at different magnifications. 691
692 693
Version preprint
694
Fig. 12. Hydrotextural description (compactness vs. water content) of the wet agglomerates
695
of durum wheat semolina according to the true water content. The black line represents the 696
saturation curve. The dotted line represents the model curve (Eq. 6)
697 698 0 0.2 0.4 0.6 0.8 1 0 0.2 0.4 0.6 0.8 1 C omp ac tn es s (s ol id vol u me fr ac ti on )
Water content (g/g dry matter)
0.19 0.21
0.31 0.37
Version preprint
699
Fig. 13. Hydro-textural description (compactness vs. water content) of the agglomerates of
700
durum wheat semolina after the agglomeration, cooking, or drying stage. Comparison with an 701
industrial couscous grains. 702 703 0.2 0.4 0.6 0.8 1 0 0.2 0.4 0.6 C omp ac tn es s (s ol id vol u me fr ac ti on )
Water content (g/g of dry matter)
Wet agglomerates Cooked agglomerates Dried agglomerates Industrial couscous grain
Version preprint
Table 1
704
Physicochemical characteristics of the two-selected durum wheat semolina. 705
706
Standard semolina Coarse semolina
Water content (g/g dry semolina) 14.8 (±0.5) 15.0 (±0.5)
Protein content (g/g dry matter 12.4 (± 0.1) 11. 6 (± 0.1)
Particle diameter - d10 (µm) 66 (±1) 434 (±1) Particle diameter - d50 (µm) 283 (±1) 619 (±1) Particle diameter - d90 (µm) 542 (±4) 888 (±1) True density 1.415 (±0.005) 1.453 (±0.003) Apparent density 1.372 (±0.007) 1.414 (±0.006) Compactness 0.845 (±0.009) 0.846 (±0.009) 707 708
Version preprint
Table 2
709
Physicochemical characteristics of the agglomerates after the cooking stage and after the 710 drying stage. 711 712 d50 (mm) Span (-) Water content (g / g dry matter) Compactness (-) Sphericity (-) Wet 0.91 (±0.05) a 0.47 (±0.02) a 0.36 (±0.02) c 0.38 (±0.02) b 0.687 (±0.02) c Cooked 1.00 (±0.01) b 0.53 (±0.02) b 0.45 (±0.06) d 0.30 (±0.03) a 0.572 (±0.05) a Dried 0.95 (±0.02) a 0.64 (±0.02) c 0.14 (±0.01) b 0.49 (±0.04) c 0.662 (±0.01) b Industrial 1.60 (±0.01) c 0.56 (±0,.1) b 0.10 (±0.01) a 0.81 (±0.04) d 0.844 (±0.01) d 713
Values are means (± standard deviation). 714
Values in column with the same letter were not significantly different (P<0.05). 715
716 717
Version preprint
Table 3
718
Comparison of the mechanical strength of the wet agglomerates and of the dried 719
agglomerates of durum wheat semolina prepared with the fluidized bed. Comparison with 720
commercial couscous grains. 721 Strength (N) Wet agglomerates 1.23 (±0.89) a Dried agglomerates 4.25 (±1.19) b Classical couscous grains 22.99 (±5.60) c
Values are means (± standard deviation). 722
Values in column with the same letter were not significantly different (P<0.05). 723
Version preprint
Table 4
725
Model parameters, coefficients of correlation and absolute deviations for all the experiments, 726
using the power law Eq. (3).
727
Semolina w Ai Df R2 Absolute deviation
Standard 0.19 0.48 2.87 0.69 0.25 0.21 0.45 2.90 0.68 0.12 0.31 0.39 2.87 0.98 0.12 0.37 0.39 2.81 0.83 0.13 0.48 0.32 2.87 0.81 0.10 Coarse 0.30 0.46 2.56 0.99 0.03 728