HAL Id: hal-02539732
https://hal.inrae.fr/hal-02539732
Submitted on 15 Apr 2020
HAL is a multi-disciplinary open access
archive for the deposit and dissemination of
sci-entific research documents, whether they are
pub-lished or not. The documents may come from
teaching and research institutions in France or
abroad, or from public or private research centers.
L’archive ouverte pluridisciplinaire HAL, est
destinée au dépôt et à la diffusion de documents
scientifiques de niveau recherche, publiés ou non,
émanant des établissements d’enseignement et de
recherche français ou étrangers, des laboratoires
publics ou privés.
Distributed under a Creative Commons Attribution - NonCommercial - NoDerivatives| 4.0
International License
Coffee agroforestry systems capable of reducing
disease-induced yield and economic losses while
providing multiple ecosystem services
Rolando Cerda, Jacques Avelino, Celia Harvey, Christian Gary, Philippe
Tixier, Clementine Allinne
To cite this version:
Rolando Cerda, Jacques Avelino, Celia Harvey, Christian Gary, Philippe Tixier, et al.. Coffee
agro-forestry systems capable of reducing disease-induced yield and economic losses while providing multiple
ecosystem services. Crop Protection, Elsevier, 2020, 134, pp.105149. �10.1016/j.cropro.2020.105149�.
�hal-02539732�
Journal Pre-proof
Coffee agroforestry systems capable of reducing disease-induced yield and economic losses while providing multiple ecosystem services
Rolando Cerda, Jacques Avelino, Celia A. Harvey, Christian Gary, Philippe Tixier, Clémentine Allinne
PII: S0261-2194(20)30082-X
DOI: https://doi.org/10.1016/j.cropro.2020.105149
Reference: JCRP 105149
To appear in: Crop Protection
Received Date: 11 October 2019 Revised Date: 10 March 2020 Accepted Date: 13 March 2020
Please cite this article as: Cerda, R., Avelino, J., Harvey, C.A., Gary, C., Tixier, P., Allinne, Clé., Coffee agroforestry systems capable of reducing disease-induced yield and economic losses while providing multiple ecosystem services, Crop Protection (2020), doi: https://doi.org/10.1016/j.cropro.2020.105149.
This is a PDF file of an article that has undergone enhancements after acceptance, such as the addition of a cover page and metadata, and formatting for readability, but it is not yet the definitive version of record. This version will undergo additional copyediting, typesetting and review before it is published in its final form, but we are providing this version to give early visibility of the article. Please note that, during the production process, errors may be discovered which could affect the content, and all legal disclaimers that apply to the journal pertain.
Credit autor statement
Rolando Cerda: conceptualization, methodology, formal analysis, investigation, data curation, writing - original draft
writing - review & editing
Jacques Avelino: conceptualization, methodology, investigation, writing - review & editing, supervision Celia A. Harvey: resources, writing - review & editing, visualization
Christian Gary: resources, conceptualization, writing - review & editing Philippe Tixier: formal analysis, investigation, data curation
Clémentine Allinne: conceptualization, methodology, formal analysis, investigation, writing - review & editing,
1
Coffee agroforestry systems capable of reducing disease-induced yield and economic losses
1
while providing multiple ecosystem services
2
Rolando Cerda∗∗∗∗a, Jacques Avelinoa,b,c, Celia A. Harveyd, Christian Garye, Philippe Tixierf, & Clémentine Allinnea,g
3
a
CATIE, Program of Agriculture, Livestock and Agroforestry,7170 Turrialba, Costa Rica;
4
b
CIRAD, UR Bioagresseurs, 34398, Montpellier, France;
5
c
IICA, AP 55, 2200 Coronado, San José, Costa Rica;
6
d
Conservation International, 2011 Crystal Drive Suite 500, Arlington, VA, USA;
7
e
INRA, UMR System, 34060 Montpellier, France;
8
f
CIRAD, UPR GECO, 34398 Montpellier, France;
9
g
CIRAD, UMR System, 34060 Montpellier, France;
10
*Corresponding author: rcerda@catie.ac.cr
11
12
13
14
15
16
17
18
19
20
21
22
23
2
Abstract
24
Crop losses caused by pests and diseases decrease the incomes and threaten the livelihoods of thousands
25
of families worldwide. A good example of the magnitude of these impacts are the massive crop losses
26
experienced by coffee farmers in Central America due to coffee leaf rust. Coffee farmers need
27
agroecosystems that are capable of regulating the negative impacts of pests and diseases while providing
28
other ecosystem services on which their households and society depend. In this study, we aimed to identify
29
the most promising coffee agroforestry systems for regulating diseases and ensuring the provision of other
30
ecosystem services. During two years, in a research network of 61 coffee plots under a wide variety of shade
31
and management conditions in Turrialba, Costa Rica, we quantified primary and secondary coffee losses
32
(yield and economic losses) and indicators of three other ecosystem services: provisioning of agroforestry
33
products (bananas, plantains, other fruits, and timber), maintenance of soil fertility and carbon sequestration.
34
We then performed an analysis of the relationships between losses and ecosystem service indicators. Based
35
on the results of relationships and on three criteria, we identified the coffee agroforestry systems that had the
36
lowest losses due to diseases and that provided desirable levels of agroforestry products, soil fertility and
37
carbon sequestration. We found multiple significant relationships between losses and ecosystem services
38
(including both tradeoffs and synergies) which allowed us to derive recommendations for better management
39
strategies to reduce yield losses. We identified six coffee agroforestry systems (CAFs) as the most promising
40
ones for reducing losses while simultaneously providing other ecosystem services. One of these CAFs was a
41
simple agroforestry system (dominated by service trees), three were medium diversified CAFs and two were
42
highly diversified CAFs (systems including service trees, timber trees, fruit trees and musaceas). The six
43
CAFS differed in their cropping practices and farmer profitability objectives. The six CAFs offer several
44
options for the design of new coffee plantations or for the transformation of existing plantations. Several of
45
this promising CAFs use little fungicides, which is an indicator that the reduction of chemical inputs could be
46
possible. Our results suggest that the regulation of diseases and associated losses in agroforestry systems
47
should be based on, and take advantage of, the positive effects of plant biodiversity, adequate shade cover,
48
good soil fertility, and minimal use of fungicides.
49
Key words: Design; Primary losses; Secondary losses; Soil fertility; Carbon sequestration; Trade-offs
3
1.
Introduction51
Regulation of pests and diseases is an important ecosystem service worldwide. Pests and diseases cause
52
severe crop losses, threatening agricultural production and reducing the food security and incomes of farmers
53
(Oerke et al., 1994; Oerke, 2006). In the countries of Central America in 2011–2012, an outbreak of coffee
54
leaf rust, due to the pathogen Hemileia vastatrix, along with suboptimal cropping practices, caused significant
55
yield losses leading to an average yield reduction of 20% in the following years. Since then, coffee production
56
in the region has continued to be low (Cerda et al., 2017b).
57
Injury profiles, i.e. a given combination of injury levels caused by a range of diseases and pests (Savary et
58
al., 2006), can differ dramatically according to crop systems in terms of encountered injuries and the levels
59
they reach. A specific crop system can help regulate some diseases but promote others. In coffee systems,
60
for instance, it is known that full-sun crops are more prone to coffee berry disease (Colletotrichum kahawae);
61
branch dieback, a syndrome exacerbated by Colletrotrichum fungi; brown eye spot (Cercospora coffeicola),
62
and Phoma leaf blight (Phoma costarricensis). In contrast, shaded coffee systems are deemed prone to
63
coffee leaf rust (Hemileia vastatrix), American leaf spot disease (Mycena citricolor), coffee wilt disease
64
(Fusarium xylarioides) and thread blight (Corticium koleroga) (Avelino et al., 2011; Avelino et al., 2018).
65
Quantifying the overall pest and disease regulation service within coffee systems is therefore difficult;
66
however, valuing this service can be achieved through crop loss assessments (Avelino et al., 2011; Cerda et
67
al., 2017a; Avelino et al., 2018). Crop systems that help reduce crop losses due to pests and diseases are
68
those that will be of interest to farmers, even if some pests and diseases are present.
69
Crop losses due to pests and diseases include losses in quantity and/or quality of the crop product (Oerke,
70
2006), normally resulting in economic losses (Nutter et al., 1993). Both primary and secondary crop losses
71
should be considered. Primary crop losses are those caused in the specific year when pest and disease
72
injuries occur, while secondary crop losses are those resulting from negative impacts of these pests and
73
diseases in subsequent years (Zadoks and Schein, 1979; Avelino et al., 2015). For instance, foliar diseases
74
in coffee cause defoliation and death of branches that will no longer bear fruits, leading to secondary losses.
4
A recent study on coffee has shown that the secondary yield losses (38%) can be higher and therefore more
76
important than primary yield losses (26%) caused by foliar pests and diseases (Cerda et al., 2017b). Since
77
coffee has a biennial production rhythm characterized by a repetitive cycle of high production one year and
78
low production the following year (DaMatta et al., 2007), the interaction between the biennial behavior of
79
production and pests and diseases impacts on coffee yield can lead to strong economic fluctuation and
80
instability for coffee farmers. The main coffee diseases to consider in Latin America and the Caribbean are
81
coffee leaf rust (H. vastatrix), American leaf spot (Mycena citricolor), brown eye spot (Cercospora coffeicola)
82
and anthracnose (Colletotrichum gloeosporioides); ultimately branch dieback must be considered, which is
83
itself aggravated by a complex of opportunistic fungi.
84
Given such a problematic scenario, combating coffee diseases is a priority for governments and private
85
sectors in the Latin American and Caribbean region. There is a need to better understand how different
86
management practices and the agroecosystem structure influence crop losses. Coffee is produced under a
87
wide variety of different conditions with different levels of management intensity. There are coffee plantations
88
in monocultures (full sun) and shaded coffee plantations which range from simple to highly complex
89
agroforestry systems (Toledo and Moguel, 2012).
90
An important and major challenge is to design coffee agroforestry systems capable of regulating pests and
91
diseases and reducing resulting losses while, at the same time, maintaining other ecosystem services
92
necessary for farmers and for society as a whole. For instance, for farmers and their families, the provision of
93
diversified products such as fruits, timber, firewood and others from coffee agroforestry systems is important
94
for household income and food security (Rice, 2008). The maintenance of soil fertility (a regulation service) is
95
of interest to farmers, given that their production depends in great part on soil quality (Müller et al., 2015). For
96
the society in general, carbon sequestration is a key regulation service, as it contributes to the mitigation of
97
climate change (MEA, 2005). All of these services can be provided individually or simultaneously by coffee
98
systems, depending on the type of agroforestry system and its management.
99
It is also important to understand the relationships among different ecosystem services, since management
100
decisions that improve the delivery of a particular service can affect other services (Cheatham et al., 2009;
101
Mora et al., 2016). To increase beneficial or synergetic relationships, trade-offs between ecosystem services
5
must be minimized and synergies promoted (Iverson et al., 2014; Rapidel et al., 2015). In the case of multiple
103
cropping, such as agroforestry systems, knowledge of the trade-offs and synergies among ecosystem
104
services is important for improving the management of the biodiversity. This knowledge is a necessary step
105
towards the ecological intensification of agriculture, i.e. an agricultural intensification to increase yields with
106
improved ecosystem services and reduced negative externalities (Kremen and Miles, 2012; Geertsema et al.,
107
2016). It is also important to estimate the monetary values of ecosystem services and use this information in
108
the assessment of relationships, because this can shed light on the magnitude of trade-offs or synergies (Peh
109
et al., 2016). Several recent studies have already demonstrated the usefulness of assessing relationships
110
among ecosystem services to guide farm management decisions. For instance, trade-off analysis in
111
agroforestry systems (with coffee and cocoa especially) have yielded strategic recommendations to improve
112
the design and management of different types of such systems (Wade et al., 2010; Meylan et al., 2013;
113
Somarriba et al., 2013; Cerda et al., 2017a).
114
With this research, we aimed to identify the most promising coffee agroforestry systems (CAFs) that can
115
serve as production models for farmers. Here we define ‘promising’ CAFs as those capable of reducing yield
116
and economic losses due to diseases while also providing other ecosystem services. We studied a wide
117
variety of coffee agroecosystems with different cropping practices, contrasting types of shade canopies and
118
different altitudinal locations. Our specific objectives were to (1) quantify the delivery of provisioning services
119
(coffee yield, agroforestry products, cash flow, value of domestic consumption) in different CAFs; (2) quantify
120
indicators of regulation services (coffee yield losses and economic losses, incidence of diseases) plus
121
indicators of maintenance of soil fertility and carbon sequestration in the aboveground biomass; and (3)
122
analyze the relationships among those ecosystem services in order to identify the most promising CAFs.
123
From these promising CAFs, we also aimed to derive technical recommendations to prevent losses from
124
diseases. The indicators of ecosystem services chosen in this study are relevant for characterizing the basic
125
needs of farmers´ families, the natural resources in agroforestry systems and the environment in general
126
(Rice, 2011; Somarriba et al., 2013; Cerda et al., 2014; Pinoargote et al., 2016).
127
128
6
2. Materials and methods
130
2.1 Data collection and calculation of indicators of ecosystem services
131
2.1.1 Location and coffee plot network
132
To characterize the delivery of multiple ecosystem services in coffee agroforestry plots, we collected data for
133
two years (2014–2015) in 61 coffee plots in a research network established in Turrialba, Costa Rica.
134
Turrialba is characterized as a premontane wet forest life zone (with mean annual rainfall = 2781 mm and a
135
mean annual temperature = 22.2°C; 10 year averages), where coffee is grown from 600 to 1400 meters
136
above sea level (m.a.s.l.). To sample the diverse set of conditions under which coffee is grown, we selected
137
coffee plots that varied in terms of their management practices (e.g. fertilizers, weeding, pests and disease
138
control, etc.), shade types (ranging from coffee systems in full sun to CAFs with high plant biodiversity) and in
139
different altitudes from 600 to 1200 m.a.s.l. All coffee plots were owned by smallholder farmers and had the
140
coffee variety Caturra as the dominant variety on the farm; this variety is also the most common in the region.
141
2.1.2 Measurements in coffee plants
142
In each coffee plot, we marked a subplot composed of eight coffee rows with 15 plants each and selected
143
eight coffee plants (one per row). In these plants, we measured the number of fruiting nodes (yield
144
component) and the number of dead productive branches (yield-reducing factor) as predictors of yield and
145
yield losses (Cerda et al., 2017b). In the same plants, we measured the presence of foliar diseases in the
146
leaves of three lateral branches (one branch in the lower part of the coffee plant, another in the middle and a
147
third in the upper part) five times during the year, and then we calculated the standardized area under the
148
disease progress curve (sAUDPC) for each disease. We also took measurements of the dieback level in all
149
plants of the subplot. Dieback was considered as a result of negative effects of both biotic and abiotic factors.
150
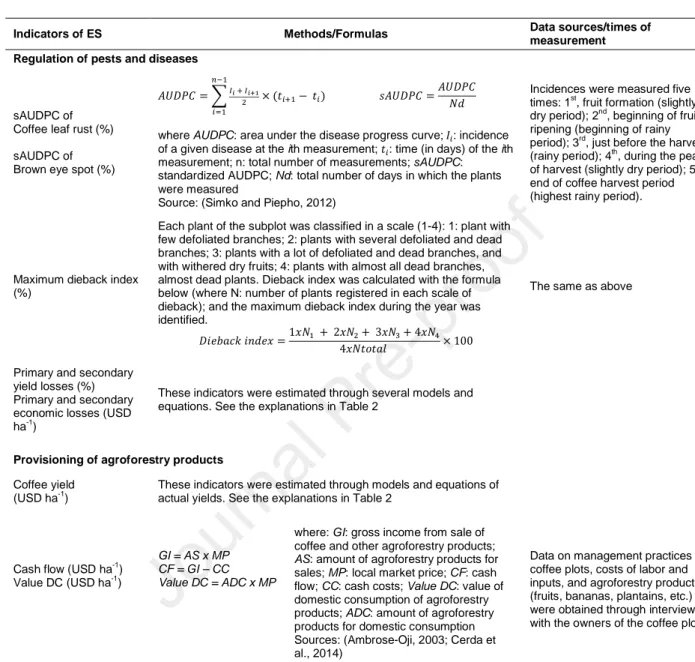
Additional details on the coffee plant measurements can be found in Table 1.
151
152
7
2.1.3 Characterization of shade canopy
154
In order to characterize the structure of the shade canopy, we marked a circular area of 1000 m2 in the center
155
of each subplot for the identification and measurements of plants and trees. We measured the species
156
richness, tree abundance and trunk diameters (at breast height = 1.30 m; for trunks with diameter >5 cm) of
157
each tree and classified shade plants into different types: timber trees, fruit trees, service trees and musacea
158
plants (bananas and plantains). We defined ‘service trees’ as leguminous trees that provide leaf litter
159
biomass to the soil and/or fix nitrogen; these trees can also provide fodder to feed livestock. Four times per
160
year we measured the shade cover with a spherical densitometer in the four corners and in the center of the
161
subplot and obtained yearly averages. We used this data to group coffee plots in three main types of coffee
162
agroecosystems: coffee in full sun (CFS), coffee agroforestry systems with low plant diversification (CLD) and
163
coffee agroforestry systems with high plant diversification (CHD).
164
2.1.4 Farmer surveys
165
We interviewed the farmers to collect data on management and agroforestry production, which we used to
166
calculate indicators of provisioning services such as cash flow and value of domestic consumption. We
167
applied semi-structured interviews to obtain the necessary data on cropping practices and production costs
168
differentiated by inputs and labor (family labor and hired labor); yields of agroforestry products other than
169
coffee (bananas, plantains, other fruits, timber); quantity of agroforestry products for domestic consumption
170
and quantity of agroforestry products sold; and local cost of hired labor and of agroforestry products.
171
2.1.5 Calculation of indicators of ecosystem services
172
We used our field data to calculate indicators of four ecosystem services: regulation of diseases, provisioning
173
of agroforestry products, maintenance of soil fertility and carbon sequestration. Table 1 lists the ecosystem
174
service indicators, along with the main methods used to obtain them. In addition to being relevant for farmers,
175
these indicators meet useful criteria in the study of ecosystem services, such as possible to quantify,
176
sensitive to changes in the system management, respond to change in a predictable manner and reflect the
177
features of the system (Dale and Polasky, 2007). Models and equations to estimate yields and yield losses
8
and economic losses are shown in Table 2; their indicators of prediction quality are presented in
179
supplementary materials.
180
2.2 Analytical methods
181
2.2.1 Characterization of the relationships between indicators of losses and indicators of
182
ecosystem services
183
To analyze the relationships between losses (yield and economic losses) and indicators of ecosystem
184
services, we carried out bivariate linear regressions between losses and indicators of presence of diseases
185
(reflected by the sAUDPC) and between indicators of losses and indicators of the other ecosystem services
186
studied (Table 1). The regressor variables were the indicators of presence of diseases, provisioning of
187
agroforestry products, maintenance of soil fertility and carbon sequestration listed in Table 1. The dependent
188
variables were the indicators of yield losses: primary yield losses (%) and their economic primary losses
189
(USD ha-1) and secondary yield losses (%) and their economic secondary losses (USD ha-1). A total of 48
190
regressions were performed and represented graphically. Since both yield losses and economic losses
191
should be reduced, the relationship is interpreted as a synergy if the relationship between a loss and a given
192
indicator of ecosystem service is negative (Fig. 1B): the increase of this given indicator is related to a
193
reduction of the loss (i.e. greater yield). Conversely, if the relationship is positive, then this relationship is
194
interpreted as a trade-off (Fig. 1C) because the improvement of this given ecosystem service is related to the
195
increase of loss (i.e. lower yield).
196
2.2.2 Identification and characterization of the most promising coffee agroecosystems
197
In each graphical representation of the 48 regressions, a ‘desirable area’ was determined as part of the
198
procedure to identify the most promising CAFs. The desirable area was defined as the area containing points,
199
i.e. coffee plots, delimited by ‘desirable levels’ of the two indicators of ecosystem services analyzed in each
200
regression (Fig. 1). The delimitation of the desirable areas followed three steps: (1) the outlier points of
201
indicators of yield and economic losses were removed from the analysis to avoid bias from uncommon
202
observations; (2) medians for all indicators of ecosystem services were calculated; and (3) each desirable
203
area was delimitated based on the data of the medians, which were considered as boundary values in this
9
study. In the case of regressions between losses and indicators of provisioning services, maintenance of soil
205
fertility and carbon sequestration, the graphical representation was divided into four quadrants according to
206
the medians in each axis and only one quadrant represented the desirable area. In the case of regressions
207
between losses and indicators of diseases, the graphical representation was divided into only two zones
208
according to the median in the axis of losses (because it was considered that low yield loss, even with high
209
levels of a disease, is an acceptable situation). Thus, only one zone represented the desirable area (Fig. 1).
210
This approach of identifying plots that attain desired values of pairs of ecosystem services was proposed as
211
an important part of designing agroecosystems (Rapidel et al., 2015) and has already been applied in a
212
previous study on ecosystem services provided by coffee systems (Cerda et al., 2017a).
213
The most promising CAFs (specific coffee plots) for providing multiple ecosystem services were those that
214
met three criteria. First, the plots had to have lower values of secondary yield losses and secondary
215
economic losses than the median of the dataset, given that secondary losses were the most important
216
(higher than primary losses). This means that promising plots had to be at least within the 50% of the plots
217
with lower secondary losses. Second, the coffee plots could not present negative values of cash flow in either
218
of the two studied years, because cash flow reflects the gain or loss of money in cash taking into account the
219
sales of agroforestry products and the costs of production invested (Table 1). Promising coffee plots,
220
therefore, should never produce a loss of cash for the farmer. Third, and finally, the coffee plots had to be
221
located in at least 32 desirable areas of the 48 regressions (two thirds—67—of the desirable areas). We
222
chose this cutoff in order to identify a reasonable number of most promising coffee plots that can be
223
considered as successful production models from which we can learn. A lower cutoff (e.g. 50%) would have
224
resulted in too many apparently promising plots, and a higher cutoff (e.g. 80%) would have resulted in only
225
one promising plot. We considered that the coffee plots fulfilling all three criteria were the most promising
226
coffee agroecosystems for the regulation of diseases (reduced crop losses), the provisioning of products for
227
farming families and the maintenance of soil fertility and sequestration of carbon. Finally, for each of the most
228
promising CAFs identified, we described its characteristics of structure and composition of the shade canopy,
229
cropping practices, production costs and the indicators of ecosystem services it provides.
230
10
232
3. Results
233
We found 21 significant relationships (p<0.05) between yield losses and economic losses and ecosystem
234
service indicators (out of total 48 regressions). We identified six promising CAFs that hold the greatest
235
potential to provide multiple ecosystem services simultaneously. We first present figures of relationships
236
among different ecosystem service provisions. In each figure, the types of coffee agroecosystems can be
237
differentiated, and the six most promising CAFs are identified. We then describe their characteristics in detail.
238
3.1 Relationship between diseases and losses
239
The percentages of coffee leaf rust and dieback were positively related to yield losses and economic losses,
240
which indicates that these phytosanitary problems are the most dangerous for the crop. According to the
241
determination coefficient (R²), primary yield and economic losses were more related to dieback, and
242
secondary yield and economic losses were more related to coffee leaf rust. The percentage of brown eye
243
spot were low in general and no related losses were highlighted (not significant), which means that this
244
disease was not as important as the other two in our context (Fig. 2).
245
An important finding was that despite several coffee plots having high levels of disease (up to 70% of coffee
246
leaf rust and up to 60% of dieback index), they were still located in the desirable areas with low yield losses
247
and economic losses; most of them were agroforestry systems of CLD and CHD types. This is an important
248
insight that there are systems capable of avoiding high losses despite a high presence of pathogens. The six
249
most promising CAFs were among them (Fig. 2).
250
3.2 Relationships between indicators of losses and indicators of ecosystem services
251
We found five significant relationships of yield losses and economic losses with indicators of provisioning
252
services, three with indicators of maintenance of soil fertility and five with indicators of carbon sequestration,
253
yet, the R2 in most of those relationships were equal or lower than 0.10 (Figs. 2, 3, 4 and 5). Such very low
11
R2s do not indicate clear relationships. Therefore, in the following paragraphs we focus on interpreting only
255
relationships with R2 s higher than 0.10.
256
Most of the coffee plots in the desirable areas with low losses and indicators of provisioning services were
257
agroforestry systems (CLD and CHD). Among them, the systems with high diversification (CHD) were those
258
capable of contributing the most to domestic consumption of agroforestry products, while the systems with
259
low diversification (CLD) contributed the most to both coffee yields and cash flow in both years of evaluation.
260
Very few systems at full sun (CFS) were identified as capable of maintaining low losses and at the same time
261
providing good cash flows. All six most promising CAFs were in desirable areas between low secondary
262
losses and desirable provisioning indicators, but not all of them were in desirable areas with low primary
263
losses (Fig. 3).
264
We found few significant relationships between losses and indicators of maintenance of soil fertility. Only the
265
relationships between soil K and secondary losses registered R2>0.10 and were positive (Fig. 4), but in such
266
figures we noted that only the high K data of two coffee plots could be leading to the positive relationships;
267
therefore, it is not possible to conclude that high K soil contents (specially in CHD) would lead to the increase
268
of losses in general.
269
We found more CAFs (CLD, CHD) than coffee at full sun (CFS) registering low yield losses, low economic
270
losses and good indicators of soil fertility (desirable areas in Fig. 4). This was more evident in the desirable
271
areas with soil acidity and soil K, which reflects the importance of trees and other plants maintaining healthy
272
soils. The six most promising CAFs were in desirable areas between losses and soil acidity, but not all of
273
them in desirable areas between losses and soil K and soil C (Fig. 4).
274
We found a significantly positive relationship between secondary economic losses and carbon in timber trees,
275
with an R2 = 0.16. We also found a similar tendency with carbon in fruit trees (Fig. 5). Although the R2s were
276
low, such relationships provide an insight that there can be trade-offs associated with tree densities, because
277
while the service of carbon sequestration is improved, increased tree densities can lead to the increase of
278
yield losses and resulting economic losses.
12
We noted that none of the coffee plots with carbon in timber trees higher than 8 Mg ha-1, and none of the
280
coffee plots with carbon in fruit trees higher than 4 Mg ha-1 registered low yield and economic losses (out of
281
desirable areas, Fig. 5). It was interesting to find that coffee plots with carbon in service trees up to 27 Mg ha
-282
1
were still located in desirable areas with low secondary losses, which indicates that the presence of that
283
type of tree does not cause trade-offs between services and can contribute to reducing losses (Fig. 5).
284
In general, less than the third part of the coffee agroecosystems (full sun systems and agroforestry systems)
285
evaluated in this study where located in each of the desirable areas between losses and indicators of
286
ecosystem services (Figs. 3, 4 and 5). Among them, two desirable areas were the most difficult to reach: low
287
secondary yield losses in combination with high soil K content, and low secondary yield losses in combination
288
with high carbon content in fruit trees and timber trees. Only less than 16% of coffee agroecosystems
289
reached desirable levels of such combinations.
290
3.3 The most promising coffee agroforestry systems for providing multiple ecosystem services
291
simultaneously
292
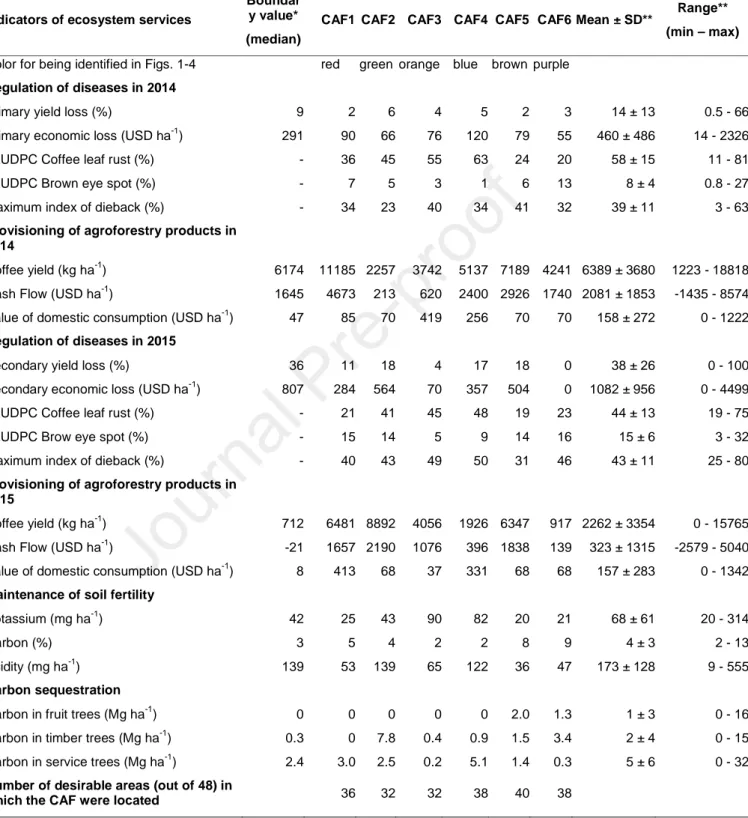
We identified six CAFs as the most promising ones for the simultaneous regulation of diseases (low yield
293
losses and low economic losses) and provision of other ecosystem services. Although they differed in their
294
agroforestry structure, agronomic management and indicators of ecosystem services, all six CAFS metthe
295
three criteria proposed (in section 2.2.2) to be the most promising systems: 1) low secondary losses, 2)
296
positive cash flow, and 3) located in at least 32 of the 48 possible desirable areas, deduced from the bivariate
297
relationships between indicators of ecosystem services. Our results suggest that the provision of important
298
benefits for farmers is not restricted to a given type of shade of the system but can be achieved by different
299
agroforestry systems depending on their particular management strategies.
300
We numbered the CAFs from 1 to 6 according to the complexity of their shade canopies: from the simplest
301
(CAF1) to the most complex (CAF6). The six CAFs were notably different in the structure and composition of
302
their shade canopies, their agronomic management and the ecosystem services they provide. The densities
303
and basal areas per type of tree (service, fruit, timber trees and bananas), as well as the species richness
304
and shade cover of the plot, also differed among the six CAFs (Table 3).
13
The agronomic management differed mostly in the number of fungicide and herbicide applications and in the
306
cost of hired labor and cost of inputs. In general, more practices and higher costs were applied in 2014 than
307
in 2015 (Table 4), because when farmers realize that a given year (2015) is going to produce low yields, they
308
prefer to reduce expenses. The management of shade trees was considered similar among the six CAFs,
309
because farmers in the study area usually prune service trees twice a year in (once a few weeks before the
310
beginning of the coffee harvest season and the other after the end of the harvest season). Farmers do not
311
apply silvicultural practices to fruit or timber trees; and management of bananas is sporadic (they just cut
312
diseased leaves when they are applying practices to coffee plants).
313
In Tables 3 and 4, we present summary data of the 61 coffee plots evaluated in this study (mean, standard
314
deviation, minimum and maximum of all variables) to show the overall characteristics of coffee
315
agroecosystems in the study area. It is possible to note that the most promising CAFs had lower densities of
316
trees than many of the other coffee plots, which indicates that these promising CAFs avoid excessive
317
densities (Table 3). However, the promising CAFs had similar frequencies of cropping practices as others,
318
but lower production costs (Table 4).
319
Although all six CAFs presented good values of most of the indicators of ecosystem services, they were quite
320
different in each indicator. In Table 5 we show the data of ecosystem services for each promising CAF and
321
the summary data for all the 61 coffee plots. The six CAFs, although different among them, in general, were
322
superior to other systems in terms of ecosystem service provision. For instance, yield losses and economic
323
losses were lower than the means of all systems. Finally, in Table 6, we present a summary of the
324
characteristics of the six CAFs related to their agroforestry structure, yield losses, yields and management
325
strategies.
326
4. Discussion
327
4.1 Yield losses to identify crop systems tolerant to diseases
328
Primary and secondary yield losses were positively related to coffee leaf rust and dieback that leads to the
329
death of productive branches, considered as the main yield-reducing factor (Cerda et al., 2017b). However,
330
we highlight as an important finding that the coffee plots with the lower primary and secondary losses were
331
not necessarily associated with lower disease levels. For instance, among the six most promising CAFs, the
14
percentage of coffee leaf rust ranged from 24% to 63%, but their primary yield losses did not surpass 6% and
333
their secondary yield losses did not surpass 18%, much lower than the other coffee agroecosystems. In other
334
words, some crop systems tolerate disease incidences better than others. Plant tolerance to pests and
335
diseases, i.e. the plant’s ability to produce a good harvest even with high disease or pest intensities (Agrios,
336
2005), can be related to good nutrition and appropriate shade cover in agroforestry systems (Toniutti et al.,
337
2017; Villarreyna et al., 2020).
338
Given that reduced yield losses can be considered as indicators for valuing the regulation of pests and
339
diseases as an ecosystem service (Avelino et al., 2011; Avelino et al., 2018), the six most promising CAFs
340
can be considered as crop systems that provide such a service. However, it is important to clarify that these
341
CAFs did not reduce yield losses only due to their natural capacity to tolerate diseases, thanks to their plant
342
biodiversity levels and good soil fertility, but such capacity was reinforced by the control of diseases. In all of
343
these promising systems, fungicides were applied with certain frequency. In this matter, it is also worth
344
mentioning that strict control of diseases based only on pesticide application or on the removal of trees of the
345
canopy to reduce excessive shade cover (such as in agroforestry systems) can be detrimental to the
346
provision of other ecosystem services (Cheatham et al., 2009). Therefore, for effective regulation of diseases
347
without trade-offs with other services, we believe that the control of phytopathogens must be combined with
348
the regulation that the system itself provides, i.e. through the use of plant diversification, adequate shade
349
cover and maintenance of soil fertility. A moderate shade cover (about 30%), for instance, helps avoid
350
excessive fruit loads that increase the susceptibility of coffee plants to diseases, and good soil fertility
351
enhanced by the organic matter provided by shade trees improves the ability of coffee plants to tolerate
352
pathogen attacks (Cerda et al., 2017a; Villarreyna et al., 2020). Thus, shade trees contribute to improve
353
coffee diseases management, reducing the dependence of farmers on chemical pesticides use for disease
354
control. When there is excessive shade cover, instead of removing shade trees, management of these shade
355
trees by pruning should therefore be encouraged.
356
4.2 Management and economic strategies to maintain the crop system sustainability
357
The six most promising CAFs were identified by their ability to provide various ecosystem services
358
simultaneously, which is important to enhancing ecological sustainability while being profitable. Each of the
15
CAFs has a specific agroforestry structure and different combination of cropping practices, showing that there
360
can be several and varied strategies that farmers can choose for the design of new plantations or for
361
transforming existing plantations. There appear to be two pathways for reducing yield losses to disease: 1)
362
applying fungicides to maintain high yields (as in CAF1 and CAF5), or 2) obtaining lower but acceptable
363
yields with limited use of fungicides (e.g., CAF 2, 3, 4 and 6) (Fig. 6). These latter systems indicate that the
364
reduction in fungicide use can be possible. An alternative to fungicides can be the use of biological products
365
with bacteria or fungi that are antagonists to pathogens. In addition, the use of fungicides for avoiding
366
epidemic growth must be planned based on the monitoring of diseases and the rainfall regime (Belan et al.,
367
2015; Zambolim, 2016). Such actions can help reduce the use of chemical fungicides in quantity and
368
frequency and yet help to protect the system, instead of only applying pesticides as an urgent measure when
369
the epidemic has reached loss-inducing levels. The idea is to structure and manage coffee systems to
370
maximize their preventive strengths against pests and diseases (Lewis et al., 1997).
371
It is known that farmers do not apply radical changes to their systems when they want to make improvements
372
in structure or management; instead, they will apply incremental changes step by step according to the
373
availability of resources (Mussak and Laarman, 1989). Therefore, one way to encourage farmers to change
374
their coffee systems to more sustainable systems is to identify what type of coffee plantation they currently
375
have and provide technical advice on how to change this plantation into one of the 6 more promising CAFs,
376
depending on which one they are most interested in and their resources. Figure 6 shows potential
377
transformation pathways for each of the main types of coffee agroecosystems. For instance, monocultures in
378
full sun could be transformed into simple agroforestry systems coffee-service trees (CAF1); depending on the
379
initial level of diversification and on the management strategy, coffee systems with low diversification could
380
be transformed into CAF2, CAF3 or CAF 4; and coffee systems with high diversification could be transformed
381
into CAF5 or CAF6. Then, it is possible to incrementally change the level of shade diversification and so
382
improve ecosystem services while reducing pesticide use to increase sustainability of the crop system, as
383
indicated by the colored arrows in Figure 6. Since our study did not include organic farms, we do not have
384
promising systems without any chemical pesticide use; therefore, the design of a transition pathway toward
385
completely agroecological systems should be a future topic of study.
16
Another important strategy is to replace varieties susceptible to the main diseases with resistant varieties, as
387
is being promoted by development projects in the region. However, it is important to take into account several
388
considerations. The change of varieties implies moderate to high costs to farmers, thus, the process should
389
be gradual and could take several years, especially in the case of smallholder farmers. The resistance of
390
improved coffee varieties is being surpassed after several years due to the evolution of pathogens, so
391
farmers cannot rely on these new varieties to confer long-term resistance; instead, the integral management
392
of agroforestry systems (soil fertility, uniform shade cover, microclimate, plant diversity) will be always
393
necessary to prevent the development of diseases and resulting losses (Avelino and Anzueto, 2020).
394
4.3 Management recommendations derived from the characteristics of the most promising coffee
395
agroforestry systems
396
From the six most promising CAFs, we can identify specific characteristics of their shade canopies and
397
management and use them as guides for reducing losses and providing ecosystem services. Based on the
398
range of characteristics of the six CAFs (Tables 3 and 4), we derived six important recommendations for
399
farmers who want to grow coffee in a sustainable manner and obtain other benefits, not only coffee yield.
400
a. Densities and management of service trees: service trees can be managed with densities up to
401
350 trees ha-1 in simple agroforestry systems where the service tree is used as the main shade
402
species. In more diversified agroforestry systems, service trees could reach up to 200 trees ha-1 when
403
the service tree species are wanted to be the most represented into the system. In diversified
404
systems where bananas and other fruits or timber trees are more important for the farmer, service
405
trees should not surpass 30 trees ha-1. It is important to note that in this study we are referring to
406
service trees of the family Fabaceae, mainly of the species Erythrina poeppigiana, which are easily
407
pruned once or twice per year to maintain low shade cover with crowns of low height. If the user is
408
planning to manage different service trees, for instance Inga spp, which are not easily nor frequently
409
pruned, then the densities should be much lower because these trees tend to have wider and denser
410
crowns, and high densities can result in excessive shade.
411
b. Densities of musaceae plants: the density of museacaea plants can reach up to 300 plants ha-1 in
412
medium diversified agroforestry systems where the production of bananas or plantains is a priority for
17
the farmer apart from coffee. For plantations with high densities of musaceae plants, there should be
414
very low density of shade trees (<40 shade trees ha-1). In highly diversified agroforestry systems
415
where the objective is to cultivate fruit or timber trees, the density of musaceae plants should be
416
much lower (~30 plants ha-1).
417
c. Densities and species of fruit trees: in diversified agroforestry systems, such as CAF 5 and CAF 6,
418
the density of fruit trees reached up to 80 trees ha-1, but with small trees, most of them cas (Psidium
419
friedrichsthalium) and arazá (Eugenia stipitata), which were young trees (according to their basal
420
areas) and had low shade cover. If the farmer wants to use other types of fruit trees, such as oranges
421
or avocados, which have denser crowns, then we estimate that the density of such trees could be
422
between 20 and 30 trees ha-1, in order to avoid risk of excessive shade and competition with coffee
423
plants for soil nutrients.
424
d. Densities and management of timber trees: in diversified agroforestry systems, timber trees
425
should not surpass 30 trees ha-1 when they are tree species similar to Cordia alliodora or Cedrela
426
odorata, as found in this study. One of the CAFs had 170 trees ha-1 but these were young and small
427
trees; the farmer will likely reduce the density of trees in future years. Low densities of timber trees
428
can be managed in agroforestry systems and still sequester important amounts of carbon and
429
produce timber, as long as the silvicultural management favors as much as possible thickness
430
increment of the main trunk (Somarriba et al., 2013).
431
e. Level of shade cover: the shade cover was variable among the most promising CAFs, but none of
432
them surpassed 35%. This should be the maximum percentage of shade cover to manage in a
433
climate such as that of Turrialba, where it is rainy most part of the year (mean annual rainfall = 2781
434
mm).
435
f. Cropping practices: weed control (with herbicides and/or machete weeding) should be done as
436
necessary: at least three controls per year would be ideal. The use of herbicides should be limited if
437
possible, which could be achieved by the use of a uniform shade cover in the plantation. At least one
438
application of fertilizers per year is needed: two would be better. Harvests should be every two weeks
439
in an area such as Turrialba, where ripe fruits can be seen frequently during the six-month harvest
440
season. The application of fungicides per year was variable among the most promising CAFs, from
18
one to six applications. In case of small farmers, we believe the ideal to be two applications per year
442
(as in several of the most promising CAFs). As mentioned, the quantity of fungicides used in the
443
system can be reduced based on disease monitoring, by applying fungicides as soon as the disease
444
reaches specific low incidence thresholds that help prevent the epidemic growth and further control
445
needs. This practice has the potential to reduce the frequency of applications and quantity of inputs.
446
More than four applications of fungicides can be justifiable when there is a strong risk of plant
447
defoliation and high yield losses, but this is not always feasible for small farmers due to the
448
investment needed. The use of fungicides should be the last resort.
449
4.4 Lessons from the analysis of relationships between indicators of ecosystem services
450
The analysis of the relationships between indicators of losses and indicators of other ecosystems services,
451
and the determination of desirable areas (Figs. 2-5) were useful for identifying crop systems that maintained
452
high yields (i.e. low losses to diseases), were financially profitable and ecologically sustainable. Although the
453
R2s were low for most relationships, these relationships can still be considered as indicators of possible
454
trade-offs or synergies, as long as they are significant (p<0.05). Similar approaches, methods and findings
455
were used in an assessment of ecosystem services by a set of agroforestry systems with coffee, cocoa,
456
basic grains, pastures and home gardens (Cerda et al., 2019). In this study, the trade-offs found between
457
ecosystem services become important warnings to avoid high yield losses and economic losses. For
458
instance, the trade-off of increasing carbon sequestration (in fruit and timber trees) that leads to increased
459
losses of coffee yields suggests that excessive presence of that type of tree should be avoided. In the case of
460
relationships that could reflect synergies, such as the one of increasing soil carbon and reducing losses, the
461
indication is that the increase of organic matter could help reduce losses, i.e. not necessarily by regulating
462
diseases directly but by reducing their negative impact on yield (Avelino et al., 2006).
463
Some relationships, such as the ones between losses and domestic consumption, should be interpreted
464
carefully. The positive relationship between the value of domestic consumption of agroforestry products and
465
secondary losses of coffee could be seen as an undesirable relationship (trade-off); however, this can be
466
seen as the farmers’ strategy to face coffee losses by using the biodiversity—they increase the consumption
467
of other products coming from the system when they realize that coffee yield is going to be low. Farmers use
19
agroforestry products (fruits, timber and others) to increase the self-consumption of on-farm products,
469
increase incomes and therefore reduce financial risk (Ramírez et al., 2001; Rice, 2011).
470
When no significant relationships were found, that means that a given ecosystem service can be increased
471
without increasing yield losses and economic losses. Independent of the significance and type of
472
relationships (trade-offs or synergies), the identification of desirable areas in the regression graphics makes it
473
possible to identify which type of agroecosystems are achieving desirable levels of ecosystem services
474
(Rapidel et al., 2015). In addition, this approach was also useful for identifying which desirable combinations
475
of ecosystem services are the most difficult to achieve. For example, few coffee systems achieved desirable
476
combinations of low secondary losses with more soil K, and more carbon in timber and fruit trees. This
477
indicates that soil fertilization strategies and silvicultural tree design-management should be improved.
478
Suggestions for how to improve the structure of the agroforestry systems and their management must be in
479
line with farmer priorities. In this study, our proposed recommendations are primarily focused on improving
480
disease regulation and increasing coffee yields, given that the coffee in the region is in a severe crisis due to
481
the attack of coffee leaf rust and unfavorable socioeconomic and climate conditions; therefore, actions are
482
needed to reduce crop losses (Avelino et al., 2015). The other goals are to promote plant diversity in
483
agroforestry systems in order to provide other tangible products (fruits, timber), maintain soil fertility and
484
contribute to climate mitigation through carbon sequestration. In other regions, the most promising systems
485
should be identified or designed based on the priorities established according to the particular context and/or
486
the interests of the main stakeholders. However, it is always critical to give an important weight and focus to
487
disease regulation and control, given that the actions needed directly or indirectly affect the biodiversity and
488
provision of ecosystem services of the crop system (Cheatham et al., 2009).
489
The quantification of several indicators of ecosystem services and the identification of trade-offs or synergies
490
between them can also be inputs for decision support systems or multi-criteria decision analysis for
491
agroforestry systems at the farm or landscape scale In that kind of analysis, the key stakeholders (farmers,
492
technicians, scientists, decision makers) can combine the quantitative and qualitative information about
493
ecosystem services to rank them according to their priorities to achieve goals and generate possible
20
scenarios of trade-offs or synergies that can guide decision making processes (Domptail et al., 2013;
495
Saarikoski et al., 2015).
496
A caveat of our study is that the boundaries (medians) to demarcate the desirable areas for identifying the
497
most promising agroforestry systems used in this study are not generalizable for studies on coffee in other
498
areas. In this study, the boundaries are dependent both on the indicators of ecosystem services of the
499
sampled coffee plots and on the number of coffee plots. If similar studies were developed in other areas, their
500
boundaries should be the medians registered in that study. Alternatively, the boundaries could be established
501
according to the specific boundaries desired by the user (according to particular objectives of farmers or
502
researchers), as done in a previous study (Cerda et al., 2017a). To define boundaries for a given region, for
503
instance, the sampled plots should represent a huge variability of production situations and management
504
strategies within the studied region so that the medians obtained could be considered as “threshold
505
boundaries” for the region.
506
5. Conclusions
507
Identifying agroforestry systems that enhance the regulation of diseases while delivering good yields and
508
other ecosystem services can help improve the sustainability of coffee farming by providing farmers and
509
technicians with successful coffee production models. The six most promising CAFs identified in this study
510
belonged to different types of agroforestry systems and management strategies. This is an important finding
511
because such systems represent several options to follow (imitate) for the design of new coffee plantations or
512
the transformation of existing plantations.
513
This study allowed us to identify the most important relationships between indicators of yield losses and
514
economic losses and the indicators of other ecosystem services, which gives insights into better
515
management of coffee agroforestry systems. The regulation of diseases must concentrate on reducing coffee
516
leaf rust and dieback, as they were the main diseases that increased losses. The integrated management of
517
diseases should take advantage of combining the management of plant biodiversity, soil fertility and the use
518
of low quantities of fungicides, applied when inoculum pressure is still low. Increasing carbon in timber and
21
fruit trees implied slight trade-offs with disease regulation, because such increments also increased losses,
520
indicating that densities of these types of trees, for caution, should be low.
521
In this study, the analysis focused mainly on yield losses and economic losses as indicators of the regulation
522
of diseases and on their bivariate relationships with indicators of other ecosystem services. This means that
523
for the identification of the most promising agroforestry systems, more weight was put on the service of
524
regulation of diseases, a highly relevant service for farmers currently due to the coffee crises in the region.
525
Despite this specificity, our study provides a useful methodological approach for other contexts (regions,
526
crops), particularly in situations where other ecosystem services not assessed here, as hydric regulation, soil
527
erosion regulation, or habitat for bird biodiversity, could be considered as relevant.
528
6. Acknowledgements
529
This research was supported by the CASCADE project Ecosystem-Based Adaptation for Smallholder
530
Subsistence and Coffee Farming Communities in Central America, funded by the International Climate
531
Initiative (ICI). The German Federal Ministry for the Environment, Nature Conservation, Building and Nuclear
532
Safety (BMUB) supports this initiative on the basis of a decision adopted by the German Bundestag. This
533
research is also a product of a study grant implemented by the Agence inter-établissements of recherche
534
pour le développement (AIRD) on behalf of the Center de coopération internationale en recherche
535
agronomique pour le développement (CIRAD).
536
7. Literature