HAL Id: hal-02411749
https://hal.archives-ouvertes.fr/hal-02411749
Submitted on 8 Jun 2021
HAL is a multi-disciplinary open access
archive for the deposit and dissemination of
sci-entific research documents, whether they are
pub-lished or not. The documents may come from
teaching and research institutions in France or
abroad, or from public or private research centers.
L’archive ouverte pluridisciplinaire HAL, est
destinée au dépôt et à la diffusion de documents
scientifiques de niveau recherche, publiés ou non,
émanant des établissements d’enseignement et de
recherche français ou étrangers, des laboratoires
publics ou privés.
biomes in North and South America
Susy Echeverria-Londono, Brian Enquist, Danilo Neves, Cyrille Violle, Brad
Boyle, Nathan Kraft, Brian Maitner, Brian Mcgill, Robert Peet, Brody
Sandel, et al.
To cite this version:
Susy Echeverria-Londono, Brian Enquist, Danilo Neves, Cyrille Violle, Brad Boyle, et al.. Plant
functional diversity and the biogeography of biomes in North and South America. Frontiers in Ecology
and Evolution, Frontiers Media S.A, 2018, 6, pp.219. �10.3389/fevo.2018.00219�. �hal-02411749�
doi: 10.3389/fevo.2018.00219
Edited by: Daniel M. Griffith, Oregon State University, United States Reviewed by: Joaquín Hortal, Museo Nacional de Ciencias Naturales (MNCN), Spain Mark E. Olson, National Autonomous University of Mexico, Mexico *Correspondence: Susy Echeverría-Londoño susyelo@gmail.com
Specialty section: This article was submitted to Biogeography and Macroecology, a section of the journal Frontiers in Ecology and Evolution Received: 02 June 2018 Accepted: 03 December 2018 Published: 18 December 2018 Citation: Echeverría-Londoño S, Enquist BJ, Neves DM, Violle C, Boyle B, Kraft NJB, Maitner BS, McGill B, Peet RK, Sandel B, Smith SA, Svenning J-C, Wiser SK and Kerkhoff AJ (2018) Plant Functional Diversity and the Biogeography of Biomes in North and South America. Front. Ecol. Evol. 6:219. doi: 10.3389/fevo.2018.00219
Plant Functional Diversity and the
Biogeography of Biomes in North
and South America
Susy Echeverría-Londoño1*, Brian J. Enquist2, Danilo M. Neves2,3, Cyrille Violle4,
Brad Boyle2, Nathan J. B. Kraft5, Brian S. Maitner2, Brian McGill6, Robert K. Peet7,
Brody Sandel8, Stephen A. Smith9, Jens-Christian Svenning10,11, Susan K. Wiser12and
Andrew J. Kerkhoff1
1Department of Biology, Kenyon College, Gambier, OH, United States,2Department of Ecology and Evolutionary Biology,
University of Arizona, Tucson, AZ, United States,3Department of Botany, Federal University of Minas Gerais, Belo Horizonte,
Brazil,4Centre d’Ecologie Fonctionnelle et Evolutive (UMR 5175), CNRS, Université de Montpellier, Université Paul Valéry,
Montpellier, France,5Department of Ecology and Evolutionary Biology, University of California, Los Angeles, Los Angeles,
CA, United States,6School of Biology and Ecology, University of Maine, Orono, ME, United States,7Department of Biology,
University of North Carolina, Chapel Hill, NC, United States,8Department of Biology, Santa Clara University, Santa Clara, CA,
United States,9Department of Ecology and Evolutionary Biology, University of Michigan, Ann Arbor, MI, United States, 10Department of Bioscience, Center for Biodiversity Dynamics in a Changing World (BIOCHANGE), Aarhus University,
Aarhus, Denmark,11Section for Ecoinformatics and Biodiversity, Department of Bioscience, Aarhus University, Aarhus,
Denmark,12Landcare Research New Zealand, Lincoln, New Zealand
The concept of the biome has a long history dating back to Carl Ludwig Willdenow and Alexander von Humboldt. However, while the association between climate and the structure and diversity of vegetation has a long history, scientists have only recently begun to develop a more synthetic understanding of biomes based on the evolution of plant diversity, function, and community assembly. At the broadest scales, climate filters species based on their functional attributes, and the resulting functional differences in dominant vegetation among biomes are important to modeling the global carbon cycle and the functioning of the Earth system. Nevertheless, across biomes, plant species have been shown to occupy a common set of global functional “spectra”, reflecting variation in overall plant size, leaf economics, and hydraulics. Still, comprehensive measures of functional diversity and assessments of functional similarity have not been compared across biomes at continental to global scales. Here, we examine distributions of functional diversity of plant species across the biomes of North and South America, based on distributional information for > 80,000 vascular plant species and functional trait data for ca. 8,000 of those species. First, we show that despite progress in data integration and synthesis, significant knowledge shortfalls persist that limit our ability to quantify the functional biodiversity of biomes. Second, our analyses of the available data show that all the biomes in North and South America share a common pattern–most geographically common, widespread species in any biome tend to be functionally similar whereas the most functionally distinctive species are restricted in their distribution. Third, when only the widespread and functionally similar species in each biome are considered, biomes can be more readily distinguished functionally, and patterns of dissimilarity between biomes appear to reflect a correspondence between climate and
functional niche space. Taken together, our results suggest that while the study of the functional diversity of biomes is still in its formative stages, further development of the field will yield insights linking evolution, biogeography, community assembly, and ecosystem function.
Keywords: biogeography, biomes, functional traits, hypervolumes, macroecology, plant functional diversity
INTRODUCTION
Ecologists and biogeographers organize land plant biodiversity into climatically-determined biomes, with physiognomies characterized by the growth forms and functional traits of the dominant species (Moncrieff et al., 2016). Indeed, the biome concept has a long history dating back to Carl Ludwig Willdenow and Alexander von Humboldt. Willdenow recognized that similar climates support similar vegetation forms, and Humboldt observed the widespread association between plant distribution, physiognomy, and environmental factors. Overall, the biome concept reflects the assumption that similar environmental pressures select for species with similar functional attributes, independent of their evolutionary history. At the same time, Earth’s extant biomes are to some extent phylogenetically distinct, with many/most of the characteristic species being drawn from specific lineages exhibiting key adaptations not just to climatic selection but to additional pressures like fire or megaherbivores (Woodward et al., 2004; Pennington et al., 2006; Donoghue and Edwards, 2014). Because biomes represent broad-scale regularities in Earth’s vegetation, understanding functional differences among biomes is critically important to modeling the global carbon cycle and the functioning of the Earth system, including responses to anthropogenic global change (Bonan et al., 2012; van Bodegom et al., 2014; Xia et al., 2015).
The past two decades has seen rapid growth in understanding the functional dimension of plant biodiversity across continental scales (Swenson et al., 2012; Lamanna et al., 2014; Šímová et al., 2018). Extensive data synthesis and analysis efforts have defined a limited functional trait space incorporating variation in overall plant size, leaf economics, and hydraulics, known as functional trait spectra (Wright et al., 2004; Díaz et al., 2016). Functional trait spectra define physiological and ecological trade-offs that determine plant life-history strategies (Westoby, 1998; Reich et al., 2003; Craine, 2009) and their influence on community assembly (Kraft et al., 2008), ecosystem function (Lavorel and Garnier, 2002; Garnier et al., 2004; Kerkhoff et al., 2005; Cornwell et al., 2008), and even rates of evolution (Smith and Donoghue, 2008; Smith and Beaulieu, 2009). The generality and utility of plant functional trait spectra has hastened their incorporation into models of the global distribution of vegetation (van Bodegom et al., 2014), biogeochemical cycling (Bonan et al., 2012), and ecosystem services (Díaz et al., 2007; Cadotte et al., 2011; Lavorel et al., 2011). However, few studies have examined comprehensive measures of functional diversity at the biome scale across both dominant and subordinate species and life forms.
There are two contrasting sets of predictions about how functional diversity varies among climatically and physiognomically distinct biomes. On the one hand, if the biodiversity of biomes reflects variation in the available ecological niche space, less taxonomically diverse biomes should represent a smaller, largely nested subset of the functional space occupied by more diverse biomes. On the other hand, due to the global nature of fundamental trade-offs in plant structure and function, and similar selection pressures acting similarly across species, assemblages occupying different environments may in fact share similar areas of trait space (Reich et al., 2003; Wright et al., 2004; Díaz et al., 2016). Recent studies confirm that the relationships between climate and functional and taxonomic diversity (i.e., species richness) are complex and scale-dependent. In some cases, functional diversity closely tracks climatic gradients, with lower functional diversity in more variable and extreme conditions (Swenson et al., 2012; de la Riva et al., 2018), and the volume of functional space in local assemblages expands with increasing taxonomic richness (Lamanna et al., 2014; Li et al., 2018). However, analyses of regional-scale species pools suggest that large changes in species richness may be associated with minimal impacts on functional diversity (Lamanna et al., 2014; Šímová et al., 2015). Moreover, the responses of taxonomic and functional diversity to climate may differ among major plant growth forms (Šímová et al., 2018), and the relative diversity of different growth forms may change substantially along the climate gradients that define different biomes (Engemann et al., 2016).
Progress in analyzing functional diversity on continental to global scales has been limited in part by data shortfalls in cataloging the taxonomic, distributional, phylogenetic, and functional aspects of biodiversity (Hortal et al., 2015). Furthermore, even given the limited data available, significant informatics challenges are associated with standardizing and integrating large, disparate datasets describing the geographic distributions, functional traits, and phylogenetic relationships of species (Violle et al., 2014). Here we examine the distribution of functional diversity of plant species across the biomes of North and South America using the Botanical Information and Ecology Network database (BIEN;Enquist et al., 2016; Maitner et al., 2018), which assembles distributional and functional trait information on >100,000 species of land plants. Specifically, we examine variation in the functional diversity and distinctiveness of biomes, based on land plant species distribution maps at a scale of 100 × 100 km grid cells and a comprehensive dataset of six functional traits that reflect the major axes of variation in ecological strategies.
Our goals in this study are 3-fold. First, in order to highlight persistent data shortfalls, we document the extent of the available
data characterizing the functional diversity and distinctiveness of biomes. Second, given the data available, we characterize the distribution of functional diversity within biomes across both dominant and subordinate growth forms. These analyses allow us to better quantify the functional distinctiveness of a biome by identifying the most common functional strategies of the most widespread species within it. Third, we ask whether biomes are in fact characterized by functionally distinct collections of species, based on the overlap of multidimensional hypervolumes in functional trait space.
METHODS
Distribution Data and Biome Classification
To reduce the effects of sampling bias characteristic of occurrence datasets compiled from multiple resources, we used the BIEN 2.0 range maps for 88,417 of plant species distributed in North and South America (Goldsmith et al., 2016). The BIEN database integrates standardized plant observations stemming from herbarium specimens and vegetation plot inventories. Species range maps in the BIEN databases were estimated using one of three approaches, depending on the occurrences available for each species. For species with only one or two occurrences (c. 35% of the species), the geographic range was defined as a square 75,000 km2 area surrounding each data point. The geographic ranges for species with three or four occurrences were identified using a convex hull (c. 15% of the species). Finally, the range maps for species with at least five occurrences were obtained using the Maxent species distribution modeling algorithm, using 19 climatic layers as predictor variables and 19 spatial eigenvectors as filters to constrain over predictions by the models (seeGoldsmith et al., 2016for further details on range map methodology).
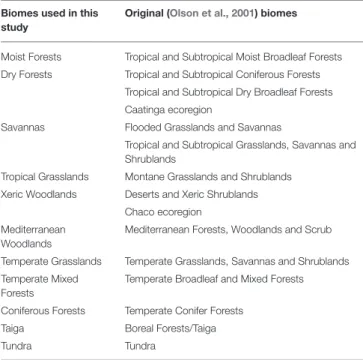
We overlaid the BIEN 2.0 plant species maps on a 100 × 100 km grid map with a Lambert Azimuthal Equal Area projection to obtain a presence/absence matrix of species for each grid cell. Based on the Olson et al. (2001) biome classification, we assigned each matrix grid cell to one of the biomes categories. Because of computational limitations for the subsequent analyses, we joined some biomes based on their similarities in climate and vegetation and literature to obtain a broad classification as described in Table 1 (excluding Inland Water, Rock and Ice and Mangroves). The Chaco and Caatinga ecoregions were classified as Xeric Woodlands and Dry forest, respectively, followingPrado and Gibbs (1993),Pennington et al. (2000),Banda et al. (2016),Silva de Miranda et al. (2018).
Species Composition Among Biomes
To understand the variation in functional trait space among biomes, we first explored the differences in plant species composition among them. Based on the species list for each grid cell and biome, we defined each biome’s characteristic species as those that have the maximum proportion of their range in that biome. These lists of geographically predominant species in a given biome were compared to the list of species in other biomes. This pairwise comparison provides a simple way to infer a directional taxonomic overlap among biomes (i.e., the
TABLE 1 | Overview of the biome classification adopted in this study and the equivalent (Olson et al., 2001) biomes classification (excluding Inland Water, Rock and Ice, and Mangroves).
Biomes used in this study
Original (Olson et al., 2001) biomes
Moist Forests Tropical and Subtropical Moist Broadleaf Forests Dry Forests Tropical and Subtropical Coniferous Forests
Tropical and Subtropical Dry Broadleaf Forests Caatinga ecoregion
Savannas Flooded Grasslands and Savannas
Tropical and Subtropical Grasslands, Savannas and Shrublands
Tropical Grasslands Montane Grasslands and Shrublands Xeric Woodlands Deserts and Xeric Shrublands
Chaco ecoregion Mediterranean
Woodlands
Mediterranean Forests, Woodlands and Scrub Temperate Grasslands Temperate Grasslands, Savannas and Shrublands Temperate Mixed
Forests
Temperate Broadleaf and Mixed Forests Coniferous Forests Temperate Conifer Forests
Taiga Boreal Forests/Taiga Tundra Tundra
Because of computer limitations, some biomes were joined based on their climatic and vegetation similarities. The Chaco and Caatinga ecoregions were classified as Xeric Woodlands and Dry forest, respectively, followingPrado and Gibbs (1993),Pennington et al. (2000),Banda et al. (2016),Silva de Miranda et al. (2018).
proportion of predominant species of a biome shared with another biome). Of the 88,417 species with available range maps, 44,899 species have ranges spanning more than one biome, and 43,518 species are endemic to a specific biome.
Trait Data
We extracted all the trait information for plant species in the New World available in the BIEN 3.0 dataset (retrieved on 7 February 2018) giving a total of 80,405 species levels trait observations. We then filtered the information for six functional traits: maximum plant height (m), seed mass (mg), wood density (mg/cm3), specific-leaf-area SLA (cm2/g) and leaf phosphorus
and leaf nitrogen concentration per unit mass (mg/g). A total of 18,192 species-level observations were left after filtering. From these, the subset of 8,820 species with both range maps and trait information was used for further analyses.
To estimate the functional trait space for each biome, we required complete trait data. For this reason, we phylogenetically imputed missing trait data (Bruggeman et al., 2009; Penone et al., 2014; Swenson, 2014; Swenson et al., 2017) using the R package “Rphylopars” v 0.2.9 (Goolsby et al., 2017) and the recently published phylogeny of seed plants bySmith and Brown (2018)
as a baseline. Phylogenetic imputation is a tool for predicting missing data in functional traits datasets based on the assumption that closely related species tend to have similar trait values (Swenson, 2014). We used the ALLBM tree (i.e., gene bank and Open Tree of life taxa with a backbone provided byMagallón
et al., 2015) because it maximized the overlap between species with available trait and distributional information. After the trait imputation, a total of 7,842 species with complete trait information and range maps remained for further analysis.
Trait Hypervolumes Measurement
We measured the relative functional diversity of biomes by calculating trait hypervolumes from species pools within biomes cells. Due to computational limitations, we constructed the trait hypervolumes using a random sample of 20% of the cells in each biome. The hypervolumes for each grid cell were estimated using the extracted six functional traits and the R package “hypervolume” (Blonder et al., 2014, 2018), using the Gaussian KDE method with the default Silverman bandwidth estimator. Seed mass, height and wood density were log-transformed, whereas SLA was squared-root transformed. All traits were scaled and centered before the analysis. Hypervolumes are reported in units of standard deviations (sd) to the power to the number of traits used (i.e., sd6).
Functional Distinctiveness and
Widespreadness
Because biomes are characterized by their dominant vegetation, we also examined the geographic commonness and functional distinctiveness of species within biomes. Using species range maps and functional trait information, we estimated the functional distinctiveness and widespreadness of each species in each biome, following the conceptual framework of functional rarity byViolle et al. (2017). Using the whole set of (measured and imputed) traits, we first measured the Euclidean distance in standardized trait space between all pair of species. We then calculated the functional distinctiveness (Di) for each species in each biome as the average functional distance of a species to the N other species within the biome species pool. Di was scaled between 0 and 1 within each biome with lower values representing species that are functionally common (redundant) and higher values representing species that are functionally distinctive, compared to the other species in the biome. We also estimate the geographic widespreadness (Wi) of a species in a biome, measured as the number of grid cells occupied by the species within a biome over the total number of cells in that biome. A value of 1 indicates that the focal species is present in all grid cells covered by the biome. Both functional distinctiveness and geographic widespreadness were calculated using the R package “funrar” (Grenié et al., 2017).
Because we lack comprehensive measures of dominance based on local abundance or biomass, we used the measures Di and Wi to identify for each biome the most “common” species as those that are both geographically widespread (Wi > 0.5) and functionally similar (Di < 0.25). This last threshold was used since the third quantile of functional distinctiveness values among biomes ranged from 0.2 to 0.3. To discriminate functionally distinct species vs. functionally similar species in subsequent analyses, we, therefore, used a value of 0.25 as a cut-off (i.e., species with distinctiveness values < 0.25 were considered functional common or redundant within a specific biome).
Functional Space and Biome Similarity
To estimate the overlap among biomes’ hypervolumes we employed the Sørensen similarity index using (i) the total number of species and (ii) the list of species considered as functionally common and geographically widespread for each biome. Functional trait space similarity was calculated as the pairwise fractional overlap of hypervolumes among biomes. The fractional overlap was calculated by dividing twice the volume of the intersection of two hypervolumes by the volume of their unions. All hypervolumes were estimated using the R package “hypervolume” (Blonder et al., 2014, 2018), using the Gaussian KDE method with the default Silverman bandwidth estimator.
RESULTS
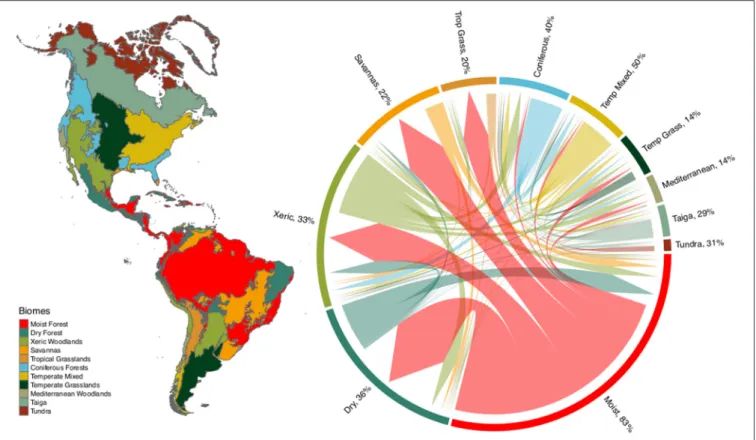
We found substantial overlap in plant species composition across biomes, based on the intersection of modeled species ranges (see Figure 1, and Supplementary Table 1). This taxonomic overlap is greater within tropical and temperate biomes, with relatively few species being shared between these two climatic zones. Interestingly, xeric woodlands share species with both tropical and temperate biomes. Despite the high proportion of species characteristic of tropical moist forest (83%), this biome also shares large numbers of species with other tropical biomes such as dry forests, savannas, xeric woodlands and tropical grasslands. The high taxonomic overlap of temperate biomes such as temperate grasslands, Mediterranean woodlands, taiga and tundra suggests the potential for low functional distinctiveness, with some temperate biomes representing a poorer subset of the more species-rich, functionally-diverse tropical biomes.
With fewer than 10% of the mapped species represented, the trait data were quite sparse for our biome-scale species assemblages (Figure 2A). Moreover, the available trait data varied substantially across traits, plant clades, and biomes. Phylogenetically, leaf P and wood density were particularly poorly represented with whole clades lacking any available data. As a result, of the approximately 2/3 of the trait values for our 7,842 species that had to be imputed, many had to be assigned in the absence of any closely related taxa. Geographically, SLA, height, and seed mass are undersampled in the tropics and temperate South America, while leaf N and wood density are more evenly sampled among regions. Leaf P is poorly sampled across all biomes. Trait hypervolumes created from species pools of a random selection of 20% of cells for each biome mainly show differences between tropical and temperate/cold biomes (Figure 2B). Trait hypervolumes tend to be larger and more variable in tropical biomes, with the highest variation in moist and dry tropical forests. Among temperate/cold biomes, coniferous and temperate mixed forest support the largest trait hypervolumes. Interestingly, xeric shrublands exhibit a distribution of hypervolumes more similar to tropical than to temperate biomes.
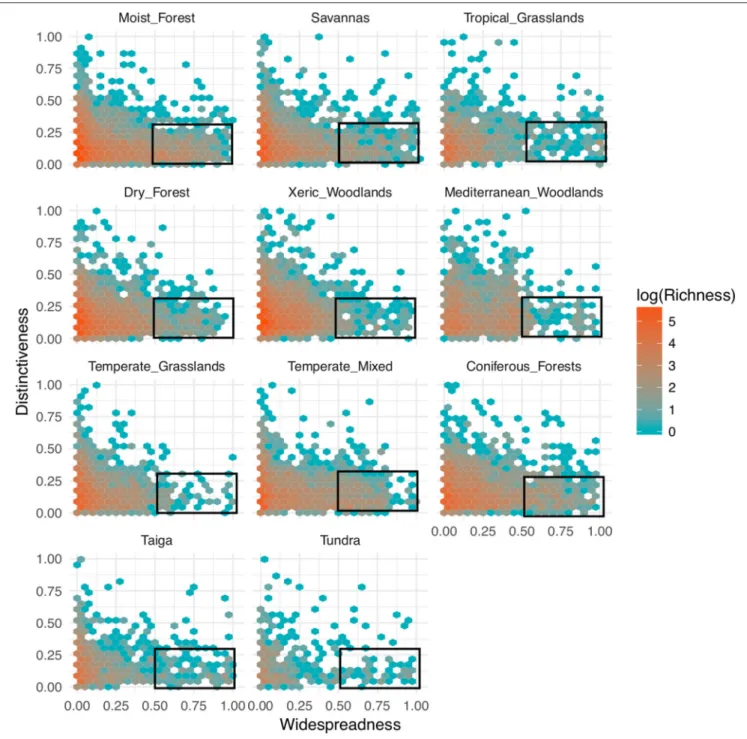
The relationship between functional distinctiveness and geographic distribution is remarkably similar among biomes (Figure 3). In every biome, the vast majority of species are
FIGURE 1 | Overlap of plant species among biomes of the New World. Percentage values express the fraction of species occurring in a biome that have the greatest proportion of their geographic range in that biome, N = 84,413. The base of each branched arrow is positioned to show the biome that includes the greatest proportion of a species range, while the width represents the number of species shared with the biomes at the tips of the arrow. See Supplementary Table 1 for the underlying matrix.
both geographically restricted and functionally similar. At the same time, the most functionally distinctive species within every biome were generally geographically restricted as well, and the most geographically widespread species were almost always functionally similar.
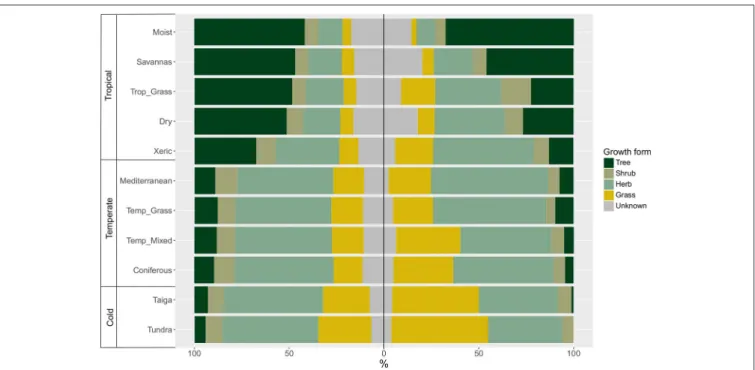
We found considerable variation in the proportional distribution of growth forms within and among biomes. Woody species represent the dominant growth forms in tropical biomes in terms of species numbers, whereas herbaceous species dominate in temperate environments (Figure 4). When we considered only those species that are widespread and functionally common in each biome, the distribution of growth forms across biomes changed, especially in the proportion of trees, herbs and grasses. For instance, in tropical biomes, the proportion of trees decreased in each biome except for moist forest. In temperate biomes, the proportion of grasses increased, especially toward the polar regions. Interestingly, the distribution of growth forms in xeric woodlands more closely resembles the distribution in temperate biomes when only widespread and functionally common species are considered.
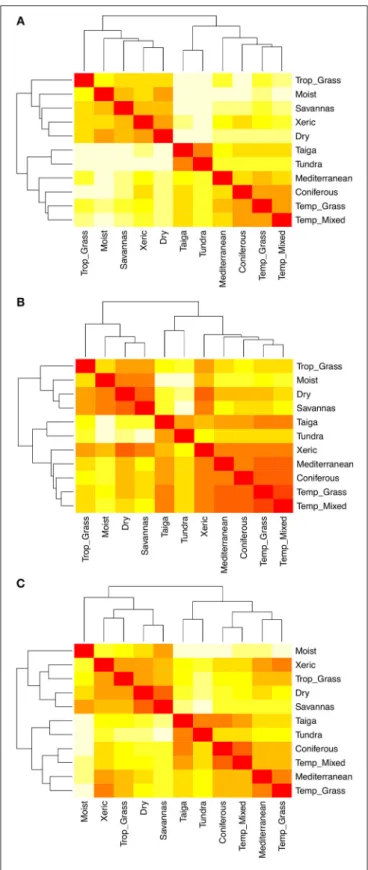
Pairwise comparisons of species composition among biomes reveal three main clusters representing the tropical, temperate and polar climatic zones (Figure 5A), reflecting the high taxonomic overlap within, but not between, these regions (Figure 1). Pairwise comparisons of trait hypervolumes among
biomes show a less clear clustering of climatic zones (Figure 5B). In this case, the functional space of xeric woodlands overlaps significantly with temperate biomes. This analysis also reveals the overlap in functional space of taigas with temperate grasslands and mixed forests. The pairwise comparison of trait hypervolumes among biomes using only those species considered as functionally common and widespread shows less overlap in trait spaces among and within climatic zones (Figure 5C). However, even though xeric woodlands are now clustered with the rest of tropical biomes, these habitats along with tropical grassland exhibit great overlap in functional space with temperate biomes such as Mediterranean woodlands and temperate grasslands.
DISCUSSION
Our analyses yield three important insights for understanding terrestrial biomes through a functional lens. First, we show that despite progress in the compilation and synthesis of primary biodiversity data, significant knowledge shortfalls persist that may limit our ability to quantify the functional biodiversity of biomes on continental to global scales. Second, our analyses of the available data nevertheless show that all of the biomes in North and South America share a remarkable common pattern in which the most geographically widespread species in any
FIGURE 2 | (A) Proportion of species in the BIEN 3.0 database with known (gray) or missing (black) trait values. Phylogeny at the left corresponds to the seed plants ALLBM tree fromSmith and Brown (2018)(i.e., GenBank and Open Tree of life taxa with a backbone provided byMagallón et al., 2015). Maps represent the proportion of species with trait information relative to the total number of species in the BIEN 2.0 database. (B) Distribution of trait hypervolumes of 20% of randomly selected 100 ×100 km cells in each biome. Hypervolumes are reported in units of standard deviations to the power of the number of traits used.
biome tend to share common functional traits while the most functionally distinctive species are invariably restricted in their distribution. Third, when only the widespread and functionally common species are considered, biomes can be more readily distinguished functionally, and patterns of dissimilarity between biomes appear to reflect a correspondence between climate and plant functional niche space. Taken together, our results suggest that while the study of the functional diversity of biomes is still in its formative stages, further development of the field will
likely yield insights linking evolution, biogeography, community assembly, and ecosystem function.
KNOWLEDGE SHORTFALLS
The BIEN database is specifically designed to close gaps in our knowledge of plant biodiversity, yet asHortal et al. (2015)
point out, interacting knowledge shortfalls lead to uncertainty in quantifying biodiversity at the largest scales. For example,
FIGURE 3 | Patterns of functional distinctiveness across biomes. Distinctiveness represents how species are functionally distant from each other within a biome (i.e., the mean pairwise phenotypic distance from a focal species to all the others). The larger the value, the more distant a species is to the centroid of the biome’s functional space. Widespreadness measures how geographically common a species is within a biome. A value of 0 indicates that a species is present in a single biome cell. Bin values are the number of species on a logescale. Rectangles represent the species that are considered functionally similar and widespread in each
biome using cut-off values of 0.25 and 0.5 of distinctiveness and widespreadness, respectively.
not only did fewer than 10% of our mapped species have both trait data and phylogenetic information available, but those missing trait data (∼66% of species’ trait values) were quite structured, both phylogenetically and geographically. Thus, the Raunkiaerian shortfall in functional trait data (sensu
Hortal et al., 2015) interacts with the Wallacean shortfall
in distributional information and the Darwinian shortfall in phylogenetic understanding. And while we can use phylogenetic knowledge to reasonably impute those missing values (Swenson et al., 2017), several aspects of the resulting patterns that are important to biome classification remain uncertain. For example, the existing growth form data suggest that woody
FIGURE 4 | Distribution of growth forms in each biome (left) using the total number of species, and (right) using only those species that are functionally similar and widespread within the biome (see Figure 3).
species dominate in all tropical biomes, whereas the proportional diversity of herbaceous growth forms is much higher in temperate and polar biomes (see also Engemann et al., 2016; Zanne et al., 2018). Does this latitudinal increase in relative diversity of herbaceous plants reflect sampling biases and a lack of taxonomic knowledge about tropical herbaceous plants, or does it reflect the differing evolutionary and biogeographic histories in the Nearctic and Neotropical realms? Dominant growth forms are one of the key distinguishing features of biomes, so systematic changes in the most diverse growth forms (whether dominant or not) will necessarily influence our predictions about how functional diversity might change across biomes, and how those changes will affect ecosystem function and services.
We used species range maps as input data mainly to overcome the undeniable issue of sampling bias that is characteristic of datasets compiled from multiple sources (see
Supplementary Figure 1). However, range maps drawn from species distribution models could represent an additional element of uncertainty in our results. For example, given the geographic resolution of this study and the spatial complexity of certain biomes, these models could have overestimated the geographical extent of some species from cells of a single biome to cells of nearby and interdigitated ones. Using occurrence data did not change the general results of this study (see Supplementary Figures 2–6); however, a slight decrease in the functional overlap among biomes could indeed reveal an overestimation of some species ranges (see Supplementary Figures 2, 5, and 6). Using occurrence information also changed the general relationships between
functional distinctiveness and widespreadness in our results, due to the relative oversampling of temperate vs. tropical regions (see Supplementary Figure 4). In this case, our measure of widespreadness is limited by the extremely limited sampling of most species in tropical biomes. As datasets and sampling improve, there is likely to be scope to reduce these uncertainties in the future.
The other data gap that needs to be addressed to understand the functional diversity of biomes is the Prestonian shortfall in abundance information. Abundance is particularly important in studies of functional diversity because the traits that matter most for community assembly, ecosystem functioning, and biogeochemical cycling are those of the most dominant species. Because we based our assemblages on range maps derived from species distribution models, we could only address the geographic component of commonness, but the positive relationship between local abundance and geographic range, the so-called occupancy-abundance relationship, suggests that the most widespread species in each biome may frequently be among the more abundant as well (Borregaard and Rahbek, 2010; Novosolov et al., 2017). Because biomes are generally characterized by the dominant growth forms in the region, integrating abundance information might result in biomes showing less functional overlap. However, even though BIEN has compiled voluminous plot data that allow estimates of local abundance, making reasonable comparisons across different regions and growth forms is hampered by uneven sampling, regional differences in gamma diversity, and incommensurate methods of quantifying abundance.
FIGURE 5 | (A) Pairwise dissimilarity in species composition among biomes. (B) Pairwise dissimilarity in trait hypervolumes (1-Sørensen similarity) among biomes using the total number of species. (C) Pairwise dissimilarity in trait hypervolumes (1-Sørensen similarity) among biomes using only those species that are considered as functionally similar and widespread. The lighter the cell the greater the dissimilarity.
COMMON PATTERNS WITHIN BIOMES
Despite the persistent gaps in the available data, our analyses uncovered a previously undocumented relationship common to all the biomes of the Western Hemisphere: in any biome, the most widespread species also tend to exhibit low functional distinctiveness, whereas the most functionally distinctive species are almost invariably restricted in their distribution (Figure 3). This “occupancy-redundancy” relationship may suggest that the climatic conditions prevalent within a biome select for a set of common characteristics, with more functionally distinctive species being restricted to a rarer subset of habitats within the biome. The overall prevalence of functionally similar species in all biomes and the “occupancy-redundancy” relationship are both consistent with a recent global analysis of community level functional diversity that suggests that habitat filtering leads to the coexistence of functionally similar species (Li et al., 2018) as well as studies showing that functional redundancies increase community stability (e.g.,Walker et al., 1999; Pillar et al., 2013). Moreover, together with the high degree of both taxonomic and functional overlap among biomes (Figures 1, 5), the fact that common, widespread species are functionally similar reinforces the notion that land plants across a wide range of environmental conditions share common characteristics near the core of the functional trait spectrum (Wright et al., 2004; Díaz et al., 2016). UnlikeUmaña et al. (2017), our results show that rare, geographically restricted species may or may not be functionally distinct from more widespread and common species. Thus, the question remains open whether more functionally distinctive species are specialists in particular environments or whether their trait combinations result in demographic or physiological trade-offs that limit their geographic distribution.
COMPARISONS BETWEEN BIOMES
Our comparison of trait hypervolume distributions across biomes (Figure 2B) is consistent with the observation that more species-rich environments are also more functionally diverse (Swenson et al., 2012; Lamanna et al., 2014; Li et al., 2018; Šímová et al., 2018). Our results are more equivocal concerning the hypothesis that seasonal and extreme climatic environments consistently limit the functional diversity of species (de la Riva et al., 2018). All tropical biomes display higher average functional diversity than all temperate biomes, and the polar biomes do display the smallest hypervolumes. However, within each group, drier or more seasonally variable biomes do not always display smaller hypervolumes (e.g., dry forests, xeric woodlands), as we would have expected following the tolerance hypothesis by Currie et al. (2004), whereas optimal climatic conditions support more combinations of physiological parameters. From these results alone we cannot determine whether temperate and polar biomes are less taxonomically diverse because of limits on functional niche space, or whether their functional hypervolumes are small because they are not taxonomically diverse. Null-modeling approaches could potentially help to disentangle taxonomic and functional diversity (Swenson et al., 2012; Lamanna et al., 2014; Šímová et al., 2018), but such an
analysis was beyond the scope of this study. More importantly, our results reinforce the importance of understanding how evolutionary and biogeographic history shape the functional diversity of biomes (Woodward et al., 2004; Pennington et al., 2006; Donoghue and Edwards, 2014; Moncrieff et al., 2016). The extensive sharing of species (and higher lineages) across biomes within, but largely not between, different biogeographic realms could serve both to homogenize functional diversity within realms and to provide clues about the characteristic traits that are selected for, or against, by different environments (Douma et al., 2012; Zanne et al., 2014, 2018).
Despite substantial hypervolume overlap among all the biomes (Supplementary Figure 2), tropical, temperate, and cold biomes all appear to occupy distinguishable regions of functional space (Figures 5B,C). The main traits differentiating biomes appear to be traits related to overall plant size, including both mature height and seed mass (Supplementary Figures 7–10), rather than leaf economics traits, as observed in more local, plot-based analyses (e.g.,Douma et al., 2012). The exception is leaf P, which displayed substantial differences between tropical and temperate/polar biomes (Supplementary Figures 7–10), a pattern that has been observed in other analyses based on both species-specific values and whole ecosystem measurements (Kerkhoff et al., 2005; Swenson et al., 2012). Because leaf P was our most sparsely sampled trait, the differences between tropical and temperate/polar realms might be subject to biases from the imputation procedure. However, Leaf P does exhibit a significant phylogenetic signal (Kerkhoff et al., 2006), which suggests that the imputations should be unbiased (Swenson et al., 2017). Leaf P is also significantly higher in herbaceous growth forms (Kerkhoff et al., 2006), so the latitudinal shift from predominantly woody to herbaceous diversity (Figure 4) may also influence this pattern.
When we limited hypervolume analyses to only the most widespread and functionally common species in each biome, the individual biomes within each biogeographic realm overlapped less in functional trait space (compare Figures 5B,C), suggesting that these species may reflect phenotypes better adapted to particular environments. In this context, the xeric woodland biome is particularly interesting. In part due to the inclusion of the Chaco ecoregion, xeric woodlands cluster with the tropical biomes taxonomically (Figure 5A). But when the functional hypervolumes of all of the species are considered, they show much stronger similarity to the temperate biomes (Figure 5B). Finally, when only the most widespread and functionally common species are analyzed, xeric woodlands again show increased similarity to tropical biomes, but also they maintain high similarity with temperate grassland and Mediterranean biomes (Figure 5C). Transitions from warm, mesic environments to colder, drier, and more seasonal environments are facilitated by similar traits, e.g., herbaceous habit (Douma et al., 2012; Zanne et al., 2014, 2018), and like colder environments, communities in dry environments also tend to be more phylogenetically clustered (Qian and Sandel, 2017). Furthermore, the position of xeric zones at the boundary of the inter-tropical convergence zone makes them a geographical transition between the tropical and temperate realms. The fact
that xeric woodlands are intermediate between the tropical and temperate realms both functionally and biogeographically further reinforces the idea that to better understand the functional diversity of biomes we must take into account their biogeographic and phylogenetic histories (Pennington et al., 2006; Donoghue and Edwards, 2014; Moncrieff et al., 2016).
CONCLUSIONS
Any classification of terrestrial biomes imposes a small number of discrete categories on continuous gradients in climate and species distributions, and thus represents a gross simplification of the complex ecological landscape (Moncrieff et al., 2016, but seeSilva de Miranda et al., 2018). Yet despite their potential for oversimplification, biomes are useful constructs for organizing and understanding the biodiversity and functioning of Earth’s major terrestrial ecosystems, and trait-based approaches have high potential to help dynamically model global vegetation distributions.
In this study we have shown that much of the taxonomic diversity of all biomes represents species that are both narrowly distributed and functionally similar. Further, within biomes the most functionally distinctive species in each biome also tend to be geographically rare, while widespread species uniformly display low functional distinctiveness. Despite extensive taxonomic and functional overlap among biomes, they do cluster into distinguishable, biogeographically and climatically distinct units, especially when the functional clustering is based on the most widespread and functionally common species in each biome. However, advancing a functional understanding of biomes will require not just a better characterization of trait variation within and between vegetation types, but also information on the biogeographic and phylogenetic history of species assemblages and the relative abundance of species within biomes.
DATA AVAILABILITY
Trait datasets and species range maps analyzed for this study can be download through the R package BIEN (Maitner et al., 2018). See http://bien.nceas.ucsb.edu/bien/ for more details about the BIEN database.
AUTHOR CONTRIBUTIONS
SE-L, AK, BJE, DMN, and CV designed the study; SE-L and AK analyzed the data; SE-L and AK wrote the first version of the manuscript; CV, BB, NK, BSM, BM, RKP, BS, SS, J-CS, and SKW contributed to the collation and creation of the traits and range maps database. All authors contributed to the development and writing of the manuscript.
FUNDING
SE-L, DMN, and AK were supported by a collaborative research grant from the US National Science Foundation (DEB-1556651). BJE was supported by National Science Foundation award
DEB-1457812 and Macrosystems-1065861. CV was supported by the European Research Council (Grant ERC-StG-2014-639706-CONSTRAINTS) and by the French Foundation for Research on Biodiversity (FRB; www.fondationbiodiversite.fr) in the context of the CESAB project Causes and consequences of functional rarity from local to global scales. J-CS considers this work a contribution to his VILLUM Investigator project Biodiversity Dynamics in a Changing World funded by VILLUM FONDEN (grant 16549). SKW was supported by the Strategic Science Investment Fund of the New Zealand Ministry of Business, Innovation and Employment’s Science and Innovation Group.
ACKNOWLEDGMENTS
We thank Dan Griffith and two reviewers for their constructive criticism which greatly improved this manuscript. We also thank all BIEN data contributors (see http://bien.nceas.ucsb.edu/bien/ data-contributors/ for a full list).
SUPPLEMENTARY MATERIAL
The Supplementary Material for this article can be found online at: https://www.frontiersin.org/articles/10.3389/fevo. 2018.00219/full#supplementary-material
REFERENCES
Banda,R K., Delgado-Salinas, A., Dexter, K. G., Linares-Palomino, R., Oliveira-Filho, A., Prado, D., et al. (2016). Plant diversity patterns in neotropical dry forests and their conservation implications. Science 353, 1383–1387. doi: 10.1126/science.aaf5080
Blonder, B., Lamanna, C., Violle, C., and Enquist, B. J. (2014). The n-dimensional hypervolume. Glob. Ecol. Biogeogr. 23, 595–609. doi: 10.1111/geb.12146 Blonder, B., Morrow, C. B., Maitner, B., Harris, D. J., Lamanna, C., Violle, C., et al.
(2018). New approaches for delineating n-dimensional hypervolumes. Methods Ecol. Evol. 9, 305–319. doi: 10.1111/2041-210X.12865
Bonan, G. B., Oleson, K. W., Fisher, R. A., Lasslop, G., and Reichstein, M. (2012). Reconciling leaf physiological traits and canopy flux data: use of the TRY and FLUXNET databases in the Community Land Model version 4. J. Geophys. Res. Biogeosci. 117:G02026. doi: 10.1029/2011JG001913
Borregaard, M. K., and Rahbek, C. (2010). Causality of the relationship between geographic distribution and species abundance. Q. Rev. Biol. 85, 3–25. doi: 10.1086/650265
Bruggeman, J., Heringa, J., and Brandt, B. W. (2009). PhyloPars: estimation of missing parameter values using phylogeny. Nucleic Acids Res. 37, W179–W184. doi: 10.1093/nar/gkp370
Cadotte, M. W., Carscadden, K., and Mirotchnick, N. (2011). Beyond species: functional diversity and the maintenance of ecological processes and services. J. Appl. Ecol. 48, 1079–1087. doi: 10.1111/j.1365-2664.2011.02048.x
Cornwell, W. K., Cornelissen, J. H., Amatangelo, K., Dorrepaal, E., Eviner, V. T., Godoy, O., et al. (2008). Plant species traits are the predominant control on litter decomposition rates within biomes worldwide. Ecol. Lett. 11, 1065–1071. doi: 10.1111/j.1461-0248.2008.01219.x
Craine, J. M. (2009). Resource Strategies of Wild Plants. New Jersey, NJ: Princeton University Press. doi: 10.1515/9781400830640
Currie, D. J., Mittelbach, G. G., Cornell, H. V., Field, R., Guégan, J. F., Hawkins, B. A., et al. (2004). Predictions and tests of climate-based hypotheses of broad-scale variation in taxonomic richness. Ecol. Lett. 12, 1121–1134. doi: 10.1111/j.1461-0248.2004.00671.x
de la Riva, E. G., Violle, C., Pérez-Ramos, I. M., Marañón, T., Navarro-Fernández, C. M., Olmo, M., et al. (2018). A multidimensional functional trait approach reveals the imprint of environmental stress in Mediterranean woody Communities. Ecosystems 21, 248–262. doi: 10.1007/s10021-017-0147-7 Díaz, S., Kattge, J., Cornelissen, J. H., Wright, I. J., Lavorel, S., Dray, S., et al.
(2016). The global spectrum of plant form and function. Nature 529, 167–171. doi: 10.1038/nature16489
Díaz, S., Lavorel, S., de Bello, F., Quétier, F., Grigulis, K., and Robson, T. M. (2007). Incorporating plant functional diversity effects in ecosystem service assessments. Proc. Natl. Acad. Sci. U.S.A 104, 20684–20689. doi: 10.1073/pnas.0704716104
Donoghue, M. J., and Edwards, E. J. (2014). Biome shifts and niche evolution in plants. Annu. Rev. Ecol. Evol. Syst. 45, 547–572. doi: 10.1146/annurev-ecolsys-120213-091905
Douma, J. C., Aerts, R., Witte, J. P. M., Bekker, R. M., Kunzmann, D., Metselaar, K., et al. (2012). A combination of functionally different plant traits provides
a means to quantitatively predict a broad range of species assemblages in NW Europe. Ecography 35, 364–373. doi: 10.1111/j.1600-0587.2011.07068.x Engemann, K., Sandel, B., Enquist, B. J., Jørgensen, P. M., Kraft, N.,
Marcuse-Kubitza, A., et al. (2016). Patterns and drivers of plant functional group dominance across the Western Hemisphere: a macroecological re-assessment based on a massive botanical dataset. Bot. J. Linn. Soc. 180, 141–160. doi: 10.1111/boj.12362
Enquist, B. J., Condit, R., Peet, R., Thiers, B., Schildhauer, M. (2016). The botanical information and ecology network (BIEN): cyberinfrastructure for an integrated botanical information network to investigate the ecological impacts of global climate change on plant biodiversity. PeerJ Prepr. 4:e2615v2. doi: 10.7287/peerj.preprints.2615v2
Garnier, E., Cortez, J., Billès, G., Navas, M. L., Roumet, C., Debussche, M., et al. (2004). Plant functional markers capture ecosystem properties during secondary succession. Ecology 85, 2630–2637. doi: 10.1890/03-0799
Goldsmith, G. R., Morueta-Holme, N., Sandel, B., Fitz, E. D., Fitz, S. D., Boyle, B., et al. (2016). Plant-O-Matic: a dynamic and mobile guide to all plants of the Americas. Methods Ecol. Evol. 7, 960–965. doi: 10.1111/2041-210X.12548 Goolsby, E. W., Bruggeman, J., and Ané, C. (2017). Rphylopars: fast multivariate
phylogenetic comparative methods for missing data and within-species variation. Methods Ecol. Evol. 8, 22–27. doi: 10.1111/2041-210X.12612 Grenié, M., Denelle, P., Tucker, C. M., Munoz, F., and Violle, C. (2017). funrar:
an R package to characterize functional rarity. Divers. Distrib. 23, 1365–1371. doi: 10.1111/ddi.12629
Hortal, J., de Bello, F., Diniz-Filho, J. A. F., Lewinsohn, T. M., Lobo, J. M., and Ladle, R. J. (2015). Seven shortfalls that beset large-scale knowledge of biodiversity. Annu. Rev. Ecol. Evol. Syst. 46, 523–549. doi: 10.1146/annurev-ecolsys-112414-054400
Kerkhoff, A. J., Enquist, B. J., Elser, J. J., and Fagan, W. F. (2005). Plant allometry, stoichiometry and the temperature-dependence of primary productivity. Glob. Ecol. Biogeogr. 14, 585–598. doi: 10.1111/j.1466-822X.2005.00187.x
Kerkhoff, A. J., Fagan, W. F., Elser, J. J., and Enquist, B. J. (2006). Phylogenetic and growth form variation in the scaling of nitrogen and phosphorus in the seed plants. Am. Nat. 168, E103–E122. doi: 10.1086/507879
Kraft, N. J., Valencia, R., and Ackerly, D. D. (2008). Functional traits and niche-based tree community assembly in an Amazonian forest. Science 322, 580–582. doi: 10.1126/science.1160662
Lamanna, C., Blonder, B., Violle, C., Kraft, N. J., Sandel, B., Šímová I, et al. (2014). Functional trait space and the latitudinal diversity gradient. Proc. Natl. Acad. Sci. U.S.A. 111, 13745–13750. doi: 10.1073/pnas.1317722111
Lavorel, S., and Garnier, E. (2002). Predicting changes in community composition and ecosystem functioning from plant traits: revisiting the Holy Grail. Funct. Ecol. 16, 545–556. doi: 10.1046/j.1365-2435.2002.00664.x
Lavorel, S., Grigulis, K., Lamarque, P., Colace, M.-P., Garden, D., Girel, J., et al. (2011). Using plant functional traits to understand the landscape distribution of multiple ecosystem services. J. Ecol. 99, 135–147. doi: 10.1111/j.1365-2745.2010.01753.x
Li, Y., Shipley, B., Price, J. N., Dantas, V. de L., Tamme, R., Westoby, M., et al. (2018). Habitat filtering determines the functional niche occupancy of plant communities worldwide. J. Ecol. 106, 1001–1009. doi: 10.1111/1365-2745.12802
Magallón, S., Gómez-Acevedo, S., Sánchez-Reyes, L. L., and Hernández-Hernández, T. (2015). A metacalibrated time-tree documents the early rise of flowering plant phylogenetic diversity. New Phytol. 207, 437–453. doi: 10.1111/nph.13264
Maitner, B. S., Boyle, B., Casler, N., Condit, R., Donoghue, J., Durán, S. M., et al. (2018). The BIEN R package: a tool to access the botanical information and ecology network (BIEN) database. Methods Ecol. Evol. 9, 373–379. doi: 10.1111/2041-210X.12861
Moncrieff, G. R., Bond, W. J., and Higgins, S. I. (2016). Revising the biome concept for understanding and predicting global change impacts. J. Biogeogr. 43, 863–873. doi: 10.1111/jbi.12701
Novosolov, M., Rodda, G. H., North, A. C., Butchart, S. H. M., Tallowin, O. J. S., Gainsbury, A. M., et al. (2017). Population density–range size relationship revisited. Glob. Ecol. Biogeogr. 26, 1088–1097. doi: 10.1111/geb.12617 Olson, D. M., Dinerstein, E., Wikramanayake, E. D., Burgess, N. D., Powell, G.
V. N., Underwood, E. C., et al. (2001). Terrestrial Ecoregions of the world: a new map of life on earth: a new global map of terrestrial ecoregions provides an innovative tool for conserving biodiversity. Bioscience 51, 933–938.doi: 10. 1641/0006-3568(2001)051[0933:TEOTWA]2.0.CO;2
Pennington, R. T., Prado, D. E., and Pendry, C. A. (2000). Neotropical seasonally dry forests and quaternary vegetation changes. J. Biogeogr. 27, 261–273. doi: 10.1046/j.1365-2699.2000.00397.x
Pennington, R. T., Richardson, J. E., and Lavin, M. (2006). Insights into the historical construction of species-rich biomes from dated plant phylogenies, neutral ecological theory and phylogenetic community structure. New Phytol. 172, 605–616. doi: 10.1111/j.1469-8137.2006.01902.x
Penone, C., Davidson, A. D., Shoemaker, K. T., Di Marco, M., Rondinini, C., Brooks, T. M., et al. (2014). Imputation of missing data in life-history trait datasets: which approach performs the best? Methods Ecol. Evol. 5, 961–970. doi: 10.1111/2041-210X.12232
Pillar, V. D., Blanco, C. C., Müller, S. C., Sosinski, E. E., Joner, F., and Duarte, L. D. S. (2013). Functional redundancy and stability in plant communities. J. Veg. Sci. 24, 963–974. doi: 10.1111/jvs.12047
Prado, D. E., and Gibbs, P. E. (1993). Patterns of species distributions in the dry seasonal forests of South America. Ann. Mo. Bot. Gard. 80, 902–927. doi: 10.2307/2399937
Qian, H., and Sandel, B. (2017). Phylogenetic structure of regional angiosperm assemblages across latitudinal and climatic gradients in North America. Glob. Ecol. Biogeogr. 26, 1258–1269. doi: 10.1111/geb.12634
Reich, P. B., Wright, I. J., Cavender-Bares, J., Craine, J. M., Oleksyn, J., Westoby, M., et al. (2003). The evolution of plant functional variation: traits, spectra, and strategies. Int. J. Plant Sci. 164, S143–S164. doi: 10.1086/374368
Silva de Miranda, P. L., Oliveira-Filho, A., Pennington, R. T., Neves, D. M., Baker, T. R., and Dexter, K. G. (2018). Using tree species inventories to map biomes and assess their climatic overlaps in lowland tropical South America. Glob. Ecol. Biogeogr. 27, 899–912. doi: 10.1111/geb.12749
Šímová, I., Violle, C., Kraft, N. J. B., Storch, D., Svenning, J.-C., Boyle, B., et al. (2015). Shifts in trait means and variances in North American tree assemblages: species richness patterns are loosely related to the functional space. Ecography 38, 649–658. doi: 10.1111/ecog.00867
Šímová, I., Violle, C., Svenning, J.-C., Kattge, J., Engemann, K., Sandel, B., et al. (2018). Spatial patterns and climate relationships of major plant traits in the New World differ between woody and herbaceous species. J. Biogeogr. 45, 895–916. doi: 10.1111/jbi.13171
Smith, S. A., and Beaulieu, J. M. (2009). Life history influences rates of climatic niche evolution in flowering plants. Proc. Biol. Sci. 276, 4345–4352. doi: 10.1098/rspb.2009.1176
Smith, S. A., and Brown, J. W. (2018). Constructing a broadly inclusive seed plant phylogeny. Am. J. Bot. 105, 302–314. doi: 10.1002/ajb2.1019
Smith, S. A., and Donoghue, M. J. (2008). Rates of molecular evolution are linked to life history in flowering plants. Science 322, 86–89. doi: 10.1126/science.1163197
Swenson, N. G. (2014). Phylogenetic imputation of plant functional trait databases.Ecography 37, 105–110. doi: 10.1111/j.1600-0587.2013.00528.x Swenson, N. G., Enquist, B. J., Pither, J., Kerkhoff, A. J., Boyle, B., Weiser, M.
D., et al. (2012). The biogeography and filtering of woody plant functional diversity in North and South America. Glob. Ecol. Biogeogr. 21, 798–808. doi: 10.1111/j.1466-8238.2011.00727.x
Swenson, N. G., Weiser, M. D., Mao, L., Araújo, M. B., Diniz-Filho, J. A. F., Kollmann, J., et al. (2017). Phylogeny and the prediction of tree functional diversity across novel continental settings. Glob. Ecol. Biogeogr. 26, 553–562. doi: 10.1111/geb.12559
Umaña, M. N., Mi, X., Cao, M., Enquist, B. J., Hao, Z., Howe, R., et al. (2017). The role of functional uniqueness and spatial aggregation in explaining rarity in trees. Glob. Ecol. Biogeogr. 26, 777–786. doi: 10.1111/geb.12583
van Bodegom, P. M., Douma, J. C., and Verheijen, L. M. (2014). A fully traits-based approach to modeling global vegetation distribution. Proc. Natl. Acad. Sci. U.S.A. 111, 13733–13738. doi: 10.1073/pnas.1304551110
Violle, C., Reich, P. B., Pacala, S. W., Enquist, B. J., and Kattge, J. (2014). The emergence and promise of functional biogeography. Proc. Natl. Acad. Sci. U.S.A. 111, 13690–13696. doi: 10.1073/pnas.1415442111
Violle, C., Thuiller, W., Mouquet, N., Munoz, F., Kraft, N. J. B., Cadotte, M. W., et al. (2017). Functional rarity: the ecology of outliers. Trends Ecol. Evol. 32, 356–367. doi: 10.1016/j.tree.2017.02.002
Walker, B., Kinzig, A., and Langridge, J. (1999). Plant attribute diversity, resilience, and ecosystem function: the nature and significance of dominant and minor species. Ecosystems 2, 95–113. doi: 10.1007/s100219900062
Westoby, M. (1998). A leaf-height-seed (LHS) plant ecology strategy scheme. Plant Soil 199, 213–227. doi: 10.1023/A:1004327224729
Woodward, F. I., Lomas, M. R., and Kelly, C. K. (2004). Global climate and the distribution of plant biomes. Philos. Trans. R. Soc. Lond. B. Biol. Sci. 359, 1465–1476. doi: 10.1098/rstb.2004.1525
Wright, I. J., Reich, P. B., Westoby, M., Ackerly, D. D., Baruch, Z., Bongers, F., et al. (2004). The worldwide leaf economics spectrum. Nature 428, 821–827. doi: 10.1038/nature02403
Xia, J., Niu, S., Ciais, P., Janssens, I. A., Chen, J., Ammann, C., et al. (2015). Joint control of terrestrial gross primary productivity by plant phenology and physiology. Proc. Natl. Acad. Sci. U.S.A. 112, 2788–2793. doi: 10.1073/pnas.1413090112
Zanne, A. E., Pearse, W. D., Cornwell, W. K., McGlinn, D. J., Wright, I. J., and Uyeda, J. C. (2018). Functional biogeography of angiosperms: life at the extremes. New Phytol. 218, 1697–1709. doi: 10.1111/nph.15114
Zanne, A. E., Tank, D. C., Cornwell, W. K., Eastman, J. M., Smith, S. A., FitzJohn, R. G., et al. (2014). Three keys to the radiation of angiosperms into freezing environments. Nature 506, 89–92. doi: 10.1038/nature12872
Conflict of Interest Statement: The authors declare that the research was conducted in the absence of any commercial or financial relationships that could be construed as a potential conflict of interest.
Copyright © 2018 Echeverría-Londoño, Enquist, Neves, Violle, Boyle, Kraft, Maitner, McGill, Peet, Sandel, Smith, Svenning, Wiser and Kerkhoff. This is an open-access article distributed under the terms of the Creative Commons Attribution License (CC BY). The use, distribution or reproduction in other forums is permitted, provided the original author(s) and the copyright owner(s) are credited and that the original publication in this journal is cited, in accordance with accepted academic practice. No use, distribution or reproduction is permitted which does not comply with these terms.