Publisher’s version / Version de l'éditeur:
Analytical Chemistry, 88, 17, pp. 8510-8517, 2016-09-06
READ THESE TERMS AND CONDITIONS CAREFULLY BEFORE USING THIS WEBSITE.
https://nrc-publications.canada.ca/eng/copyright
Vous avez des questions? Nous pouvons vous aider. Pour communiquer directement avec un auteur, consultez la
première page de la revue dans laquelle son article a été publié afin de trouver ses coordonnées. Si vous n’arrivez pas à les repérer, communiquez avec nous à PublicationsArchive-ArchivesPublications@nrc-cnrc.gc.ca.
Questions? Contact the NRC Publications Archive team at
PublicationsArchive-ArchivesPublications@nrc-cnrc.gc.ca. If you wish to email the authors directly, please see the first page of the publication for their contact information.
NRC Publications Archive
Archives des publications du CNRC
This publication could be one of several versions: author’s original, accepted manuscript or the publisher’s version. / La version de cette publication peut être l’une des suivantes : la version prépublication de l’auteur, la version acceptée du manuscrit ou la version de l’éditeur.
For the publisher’s version, please access the DOI link below./ Pour consulter la version de l’éditeur, utilisez le lien DOI ci-dessous.
https://doi.org/10.1021/acs.analchem.6b01324
Access and use of this website and the material on it are subject to the Terms and Conditions set forth at
Combination of mechanical and molecular filtration for enhanced
enrichment of circulating tumor cells
Meunier, Anne; Hernández-castro, Javier alejandro; Turner, Kate; Li, Kebin;
Veres, Teodor; Juncker, David
https://publications-cnrc.canada.ca/fra/droits
L’accès à ce site Web et l’utilisation de son contenu sont assujettis aux conditions présentées dans le site LISEZ CES CONDITIONS ATTENTIVEMENT AVANT D’UTILISER CE SITE WEB.
NRC Publications Record / Notice d'Archives des publications de CNRC:
https://nrc-publications.canada.ca/eng/view/object/?id=b5eb2c97-14cf-41f7-8e9e-9c075fcd6d60 https://publications-cnrc.canada.ca/fra/voir/objet/?id=b5eb2c97-14cf-41f7-8e9e-9c075fcd6d60Combination of Mechanical and Molecular Filtration for Enhanced
Enrichment of Circulating Tumor Cells
Anne Meunier,
†,‡Javier Alejandro Hernández-Castro,
†,‡,§Kate Turner,
†,‡Kebin Li,
§Teodor Veres,
§and David Juncker
*
,†,‡,⊥†
Biomedical Engineering Department, McGill University, 3775 University Street, Montreal, Quebec, Canada H3A 2B4
‡
McGill University & Genome Quebec Innovation Centre, McGill University, 740 Dr. Penfield Avenue, Montreal, Quebec, Canada H3A 0G1
§
National Research Council of Canada, 75 de Mortagne Boulevard, Boucherville, Quebec, Canada J4B 6Y4
⊥
Neurology and Neurosurgery Department, McGill University, 3801 University Street, Montreal, Quebec, Canada H3A 2B4
*
S Supporting InformationABSTRACT: Circulating tumor cells (CTCs) have been
linked to cancer progression but are difficult to isolate, as they are very rare and heterogeneous, covering a range of sizes and expressing different molecular receptors. Filtration has emerged as a simple and powerful method to enrich CTCs but only captures cells above a certain size regardless of molecular characteristics. Here, we introduce antibody-functionalized microfilters to isolate CTCs based on both size and surface receptor expression. We present a 3D printed filtration cartridge with microfabricated polymer filters with 8, 10, 12, 15, or 20 μm-diameter pores. Pristine filters were used to optimize sample dilution, rinsing protocol, flow rate, and pore size, leading to >80% for the recovery of spiked cancer
cells with very low white blood cell contamination (<1000). Then, filters were functionalized with antibodies against either epithelial cell adhesion molecule (EpCAM) or epidermal growth factor receptor (EGFR) and the cartridges were used to enrich breast (MDA-MB-231, MCF-7) and renal (786-O, A-498) cancer cells expressing various levels of EpCAM and EGFR. Cancer cells were spiked into human blood, and when using filters with antibodies specific to a molecular receptor expressed on a cell, efficiency was increased to >96%. These results suggest that filtration can be optimized to target specific CTC characteristics such as size and receptor expression and that a diverse range of CTCs may be captured using particular combinations of pore size, filtration parameters, and antibody functionalization.
C
irculating tumor cells (CTCs) are cancer cells that have detached from a primary tumor, entered the bloodstream, and thought to invade distant tissues where they adapt and proliferate, leading to the formation of metastases (secondary tumors).1,2 Metastasis is a highly frequent complication responsible for as much as 90% of cancer-associated mortality. CTCs, found in blood, have emerged as a prognostic indicator for disease progression.3,4 CTCs are extremely rare (1−10 CTCs per milliliter of blood, compared to <106leucocytes and<109erythrocytes),3,5,6and the detection of one CTC in five
milliliters of blood is clinically relevant. However, one of the main obstacles to characterize these cells is the difficulty of obtaining sufficient numbers for analysis. This has prompted the development of many technologies, where selective enrichment is typically achieved using molecular (surface receptor expression) or mechanical (size, density, electric charges, deformability) properties, known to be different from blood cells.
Filtration was first used to concentrate cancer cells from saline in 1956 using cellulose ester filters with 0.5−3.0 μm pore diameter.7The track-etching technique, developed in the 1960s and used to this day,6,8 allows an accurate control of pore
dimensions. However, the random arrangement of pores and the need to prevent pore overlapping inherently limit membrane porosity using this approach.
Microfabrication, allowing precise control of submicrometric dimensions, was used to design filtration systems with micropillars or microholes.9−11 However, the high flow
resistance of microfluidic devices limits the throughput, while fabrication processes can be complex and costs high. Filters can provide multiple parallel paths and microfabrication has been used to make filter membranes with higher porosities,12as well
as rectangular or conical shapes,13−15 and 3-dimensional
Received: April 5, 2016 Accepted: July 21, 2016 Published: July 21, 2016
Article
pubs.acs.org/ac
This is an open access art icle published under an ACS Aut horChoice License, which permit s copying and redist ribut ion of t he art icle or any adapt at ions for non-commercial purposes.
configurations,16permitting higher flow throughput. However, the heterogeneity of CTCs is becoming increasingly appreciated, and the diameter of small CTCs falls within the range of white blood cells (WBCs), making their capture difficult as the pore size is constrained by the requirement for WBCs to pass through without clogging the pores.
Another successful strategy is targeting molecular receptor expression using antibodies. CTCs of epithelial origin and unlike any blood cells express the epithelial cell adhesion molecule (EpCAM). Currently, CellSearch (Veridex LLC, Raritan, NJ), using magnetic beads coated with anti-EpCAM antibodies is the only system approved by the U.S. Food and Drug Administration for the enumeration of CTCs of epithelial origin in whole blood.17 Affinity-based strategies using antibody-functionalization of nanostructured substrates18−22
or magnetic beads,23,24have been widely used in microfluidic devices for magnetic separation.25−28For instance, using
anti-EpCAM functionalization, Soper et al. captured anti-EpCAM positive cancer cells spiked in blood and showed their possible detachment by enzymatic digestion of the extracellular domain of EpCAM or anti-EpCAM with high yield.29 Released cells were then enriched based on their electrical charges for further molecular profiling.
However, CTCs heterogeneity extends to the expression of molecular receptors as well. CTCs can undergo epithelial-mesenchymal transition (EMT) that may lead to EpCAM downregulation.30 A number of techniques are emerging to address the intrinsic heterogeneity of CTCs. Cancer cells with stem cell features were shown to preferentially adhere to extracellular matrix proteins, for example.31Negative selection
allows for targeting WBCs with magnetic beads conjugated with anti-CD45 instead of enriching CTCs.32 Toner et al. developed a complex microfluidic chip with a size-based RBC separation followed by magnetic isolation of either CTCs by capture on anti-EpCAM magnetic beads or to preserve CTC diversity, in a negative selection mode by removing WBCs using anti-CD45 magnetic beads.33Negative selection however is costly as large amounts of antibody-conjugated magnetic
beads are needed, and some CTCs may be removed along with the other cells.
A promising strategy to isolate a wider range of heterogeneous CTCs is to isolate cells based on both molecular and mechanical features. First steps have been taken in this direction by Chung et al., who, using a multistep procedure, first enrich cancer cells on magnetic beads conjugated with anti-EpCAM, rinse, and then capture the cells with beads on a filter, and finally detach them by inverting the flow.34 Zhang et al. used a reverse protocol where anti-EpCAM beads are also added to the sample and labeled cancer cells are first enriched on a filter and then detached from the filter using magnetic force.35It is EpCAM expression that dictates isolation, and the cells, enlarged by the magnetic beads, are thus captured by the filter. In both approaches yields were excellent, but they were dependent on EpCAM expression and only used for EpCAM+
cells, the protocols required multiple steps while the magnetic beads interfered with fluorescence imaging, and most importantly, it is not known whether the intrinsic mechanical properties of the cells influence this filtration method.
Here, we introduce antibody-functionalized microfilters to isolate CTCs based on both their intrinsic mechanical properties including size and rigidity, and their expression of surface receptors. Microfabricated polymer filters with 8, 10, 12, 15, or 20 μm-diameter pores were used, and various parameters such as sample dilution, rinsing protocol, flow rate, and filter pore size were optimized for the enrichment of MDA-MB-231 breast cancer cells spiked into blood while considering both cell recovery and WBCs contamination. We designed and made a 3D printed filtration cartridge that can be rapidly assembled, and that was used for all experiments. Upon processing, cells were fluorescently stained directly in the cartridge. Then, transparent filters were removed from the cartridge and imaged by microscopy. Using the optimal conditions, breast (MDA-MB-231, MCF-7) and renal (786-O and A-498) cancer cells, chosen for expressing various levels of EpCAM and epidermal growth factor receptor (EGFR), were then enriched with
Figure 1.Filtration setup for CTC enrichment. (A) Photograph of a polymer filter with close-ups of membranes with 8, 10, 12, 15, and 20 μm-diameter pores. (B) Photograph of the disassembled filtration setup. (C) Schematic representation of the filtration setup comprising programmable syringe pump and the exploded view of the cartridge. (D) Examples of fluorescence images of cancer (MDA-MB-231) cells and white blood cells on 8-μm-pore filters.
Analytical Chemistry Article
DOI:10.1021/acs.analchem.6b01324
Anal. Chem. 2016, 88, 8510−8517
pristine filters and filters functionalized with anti-EpCAM and anti-EGFR antibodies.
■
EXPERIMENTAL SECTIONFilter Fabrication. The process, described in detail elsewhere36 and briefly in Supporting Information (SI-1B), allows for the fabrication of 20−40 μm-thick filters with precise pore dimensions (Figure 1A). Pore diameters, measured by microscopy and averaged on 20 pores from three different filters and for each pore size, were found to be 7.9 ± 0.3, 10.0 ± 0.2, 11.7 ± 0.4, 15.0 ± 0.2, and 20.1 ± 0.3 μm.
Cartridge Design. The filtration cartridge (70 mm long and 40 mm large) was designed using AutoCAD software (Autodesk Inc.) and 3D printed (Perfactory Micro EDU, Envision Tech) (Supporting Information SI-1C). It consists of a bottom (15 mm high) and a top part (10 mm high) in between which a microfilter can be inserted (Figure 1B).
Filter Functionalization. Covalent immobilization of antibodies was performed through EDC/NHS coupling after surface activation with oxygen plasma (PE-50, Plasma Etch) for 2 min at 150 W and O2pressure of 200 mTorr. Filters were
incubated for 20 min in EDC (0.5 mol L−1)/NHS (0.5 mol
L−1) solution, prepared immediately before use and diluted 10
times in MES buffered saline (0.1 mol L−1MES and 0.5 mol
L−1 NaCl) supplemented with 2.0% BSA. After rinsing with
MES buffer, filters were incubated in the antibody solution containing 10.0 μg mL−1of anti-EGFR or anti-EpCAM for 3 h.
The filters were then rinsed with PBS and directly used for filtration.
Cell Culture.MDA-MB-231, MCF-7, and A-498 cells were cultured in DMEM, supplemented with 10% FBS and 1% (v/v) antibiotics. The 786-O renal cells were cultured in RPMI 1640 medium supplemented with 10% FBS. For spiking experiments, cells were harvested from flasks, centrifuged, then resuspended in PBS. Additional details are provided in the Supporting Information (SI-1D).
Blood Collection. Blood was drawn from healthy volunteers (IRB study reference number BMB-08-012) into 10 mL CTAD tubes (citrate-based anticoagulant containing the platelet inhibitors theophylline, adenosine, and bipyridamole, BD Vacutainer). Samples were maintained at 4 °C and processed within 72 h of blood collection.
Cell Staining.After filtration, cells were treated directly on the filter, within the cartridge. Cells were fixed with 3.7% paraformaldehyde (PFA) in PBS then rinsed with PBS. Cells were then permeabilized with 0.2% Triton X-100 and rinsed with PBS. Afterward, blocking was performed with 1.0% BSA in PBS supplemented with 0.1% Tween 20, then cells were stained with Anti-Pan-cytokeratin Alexa Fluor 488 (2.0 μg mL−1) and
Anti-Human CD45 Phycoerythrin (PE, 1.0 μg mL−1). Cells
were rinsed with PBS then their nucleus was stained by 4′,6-diamidino-2-phenylindole (DAPI, 0.1 μg mL−1). Finally, the
filter was rinsed with PBS and cell identification was performed by fluorescence microscopy. Additional practical details are provided inSupporting Information (SI-1G).
Cell Identification by Fluorescence Microscopy. Filters were placed upside down on the platform of an inverted microscope (TE-2000-E, Nikon) connected to a CCD camera (QuantEM 512SC, Photometrics) and fluorescence images were recorded with NIS-Elements Advanced Research software (Nikon) and analyzed with ImageJ.37 Images were collected with a mercury arc lamp and 41001 (blue, for Alexa fluor 488), 41004 (green, for PE), and 31000v2 (UV for DAPI) filter cubes
(Chroma Technology Corp.) were used. Cells are defined as CTC-like cells when they have a nucleus (DAPI staining) and when they express cytokeratin, a cytoplasmic protein from epithelial origin (antipan-CK staining). WBCs also possess a nucleus (DAPI) but express the cluster of differentiation 45 (anti-CD45 staining) (Figure 1D).
■
RESULTS AND DISCUSSIONTransparent polymer membranes with pore diameters of 8−20 μm, an open ratio of 8−20%, and 33 000−80 000 of pores36 were inserted into a 3D printed cartridge (Figure 1A); unless specified 8-μm-pore-filters were used in all experiments. The porous membrane is heat bonded to a PMMA ring that defines an 8 mm-diameter filter. Filters were used in pristine conditions for initial optimization and for pure mechanical filtration and functionalized with antibodies for combined mechanical and molecular filtration in subsequent experiments. The filters are positioned between the cartridge and a pair of toric joints and clamped with screws and bolts for sealing. A precise number of cancer cells (Supporting Information SI-1E and F) was spiked into 1.0 mL of blood diluted with PBS. The sample was inserted from the inlet (top) and flowed through the cartridge at a defined flow rate using a programmable syringe pump (Figure 1C). Red blood cells (RBCs) and white blood cells (WBCs) with diameters of 7−8 and 8−14 μm, respectively, are known to be deformable and could pass through all filters used here.38 The larger and less deformable cancer cells were captured, stained, and imaged on the filter for identification (Figure 1D).
Mechanical Capture of CTCs. The influence of exper-imental conditions such as sample dilution, rinsing protocol, flow rate, and filter pore size on the enrichment performance was studied. Enrichment performance can be quantified by measuring efficiency and purity.32Efficiency corresponds to the recovery ratio between cells that are captured versus spiked into the sample. Efficiency is defined as follows, where NTC is the number of target cells:
= ×
efficiency NTC captured
NTC initially spiked in blood 100
Purity is measured as the number of white blood cells (WBCs) concurrently captured with cancer cells. A higher purity corresponds to a lower number of WBCs, which is desirable as WBCs can confound further biological analysis.
An important parameter that could not be directly controlled but was considered is the pressure drop across the microfilter, which is determined by the flow rate divided by the flow resistance of the microfilter. Dilution of blood in buffer would contribute to reduce the pressure by reducing the viscosity. However, although the flow rate was fixed, the pressure could not easily be derived because of the non-Newtonian character-istic of blood and, more importantly, because clogging of the pores by captured cells reduces the number of open pores, leading to increased resistance and higher pressures for a given flow rate. It is expected that increases in pressure will affect the enrichment of CTCs as well as the WBCs contamination. For increasing pressure, less CTCs and less WBCs would be captured, while it may also help reduce clogging of the microfiltration membrane as cells are displaced.
Sample Dilution. The effect of sample dilution was evaluated with a known number of MDA-MB-231 cells (161.82 ± 8.1 cells) spiked into 1.0 mL of blood diluted with
different volumes of PBS (1.0, 2.0, 5.0, 6.0, 10.0, and 15.0 mL) and filtered at 1.0 mL min−1.
For increasing dilutions of 1.0 mL of blood with up to 6.0 mL of PBS, efficiency increased from about 20 to about 50% (Figure 2A). This trend is in good agreement with the work of Coumans et al., who have previously demonstrated that for a fixed flow rate, diluting samples reduces the pressure drop and helps increase efficiency.6Since enrichment is based on cell size
and deformability, it is not surprising that a lower pressure undergone by cells would make them pass through the filter less easily, therefore increasing efficiency. As the sample is further diluted up to 1:15 of blood:PBS, no significant improvement is observed, consistent with only minor changes in viscosity. The reproducibility in efficiency and in the initial number of spiked cells was found to be very good with very low standard deviation. In order to limit the processing time, for all further experiments, 1 mL blood samples were diluted with 6 mL of PBS. For all dilutions we observed a high accumulation of WBCs on the filter, indicating that dilution is not an effective means of improving purity.
Rinsing.We tested the effect of rinsing on purity by flowing various volumes of PBS. In total, 101.3 ± 2.4 MDA-MB-231
cells, spiked in 1:6 mL of blood/PBS, were filtered and then rinsed at 1.0 mL min−1.
Using 5.0 mL of PBS, the number of WBC captured on the filter was greatly reduced, from the experiments without rinsing, to a low density that permitted their enumeration, and in this case corresponding to ≈1000 WBCs (Figure 2B). WBCs concentration is >106 per mL of blood,32 thus <0.1% were
captured on the filter. Without and with rinsing, respectively, 50 ± 2% and 50 ± 3% of cancer cells were captured, indicating that this rinsing did not reduce efficiency. Increasing the rinsing volume to 10.0 or 20.0 mL did not improve purity significantly. However, rinsing in several steps (2 or 3 rinses with 5.0 mL of PBS) further reduced the number of WBCs, but for three rinses efficiency was only 41 ± 3%. Contrary to a single rinse with 10.0 mL of PBS, when rinsing twice with 5.0 mL of PBS, the syringe was unplugged to be refilled. This procedure creates a small negative pressure (back pulse) that may displace cancer cells and WBCs captured into a pore, thus they may be washed during the second rinsing step. Therefore, while increasing the number of rinsing steps, cells are exposed to more successive negative and positive pressure cycles, which may eventually facilitate the passage of any cells and explain the decrease in both efficiency and purity. On the basis of these results, we
Figure 2.Capture efficiency and WBC contamination for different dilutions factors, rinsing protocols and flow rates. (A) Effect of sample dilution on capture efficiency. 161.8 ± 8.1 MDA-MB-231 cells were spiked in 1.0 mL of blood diluted with 1.0, 2.0, 5.0, 6.0, 10.0, or 15.0 mL of PBS and filtered at 1.0 mL min−1. Insets show a MDA-MB-231 cell stained on filter. (B) Qualitative (top, WBCs stained on filter) and quantitative (bottom) effect of
rinsing on efficiency (red symbols) and the number of WBCs (gray bars). The 101.1 ± 5.1 MDA-MB-231 cells were spiked in 1.0:6.0 mL of blood/ PBS, filtered, then rinsed with 5.0, 10.0, 20.0, 2 × 5.0, or 3 × 5.0 mL of PBS at 1.0 mL min−1. Without rinsing, the number of WBC is too high to be
counted. (C) Effect of flow rate on efficiency. The 101.3 ± 3.3 MDA-MB-231 cells were spiked in 1.0:6.0 mL of blood/PBS and filtered at 0.1, 0.5, 1.0, 2.0, or 3.0 mL min−1(no rinse). The results identify 1:6 dilution, 0.1 mL min−1and 5.0 mL rinsing volume (twice) as the optimal conditions.
Error bars correspond to the standard deviation of three independent experiments.
Analytical Chemistry Article
DOI:10.1021/acs.analchem.6b01324
Anal. Chem. 2016, 88, 8510−8517
identified rinsing twice with 5.0 mL of PBS as the optimal compromise between high efficiency and high purity and adopted it for all subsequent experiments.
The number of WBCs captured on the filter varies to a larger extent than the efficiency, which is consistent with person-to-person variability of blood cell counts and cell properties.6 Jones et al. showed that both WBCs and RBCs (to a lesser extent) are responsible for pore occlusion, leading to changes in the pressure drop across the filter.39Only ≈1000 WBCs were left following rinsing, filling 1−3% of the total number of pores and thus inducing a negligible change in pressure. During filtration, many more cells are expected to be on the filter surface and transiting through the pores, yet efficiency was reproducible for many different blood samples, suggesting that WBCs and RBCs do not affect CTC capture when the samples are sufficiently diluted. In conclusion, whereas the number of WBCs on the filter is subject to greater variation, <0.1% were retained on the filters in all scenarios tested here.
Flow Rate. The influence of flow rate on efficiency and purity was investigated by spiking 101.3 ± 3.3 MDA-MB-231 cells in 1.0:6.0 mL of blood/PBS. Samples were filtered at different flow rates (0.1, 0.5, 1.0, 2.0, or 3.0 mL min−1). No
rinsing was done.
As the flow rate decreased from 3.0 to 0.1 mL min−1,
efficiency increased from 42 ± 5 to 85 ± 3% (Figure 2C). The number of WBCs on the filter was evaluated by imaging them after filtration. Since for low flow rates there were too many WBCs captured to be counted, the surface coverage of WBCs was compared, which was smaller for higher flow rates (Supporting Information SI-2). Both the number of cancer cells and WBCs on the filter diminish with increasing flow rates, consistent with a higher pressure and results in the literature,6,22 manifesting a trade-off between efficiency and purity. Reducing the flow rate will reduce the pressure on cells, including WBCs, through pores. This would explain the increase not only in the number of captured target cells, thus increasing efficiency, but also in the number of WBCs, reducing purity.
Finally, we determined purity after filtration and rinsing twice with 5 mL of PBS at 0.1 mL min−1. The number of WBCs was
found to be 694 ± 161, consistent with our previous results, obtained at 1.0 mL min−1. A flow rate of 0.1 mL min−1 was
therefore selected as optimal for our system. It is worth mentioning that the overall process could be further sped up by increasing membrane porosity or filter size, both resulting in increased flow rate for a given pressure.
Filter Pore Size.The pore size is expected to play a dominant role in the efficiency and purity of captured CTCs. The 8 μm-diameter pores were selected as the lower limit based on the results in the literature that showed it to be the smallest dimension before clogging by WBCs becomes significant. Indeed, the smaller the pores, the more efficient enrichment, but as they become too small they retain a small fraction of WBCs, which rapidly leads to a clogging of the pores. As the fraction of open pores in the filter is reduced, the pressure drop across the filter rapidly increases under constant flow rate conditions, and the flow rate in the remaining open pores also increases rapidly, which can then lead to lower capture efficiency. We thus tested filters with nominal pore size of 8, 10, 12, 15, and 20 μm. Based on the results obtained earlier, optimal conditions were chosen as follows. MDA-MB-231 cells were spiked in 1 mL of blood diluted 1:6 in PBS and filtered at
0.1 mL min−1, then rinsed twice with 5.0 mL of PBS at the
same rate.
In good agreement with the previous data, efficiency was found to be >80% for small pore sizes (Figure 3, red symbols).
Efficiency decreased for 15 and 20 μm pores, falling to 76 ± 5 and 63 ± 3 respectively. The number of WBCs was 694 ± 161 on 8 μm-filters, in the same range as in previous experiments (702 ± 181 using 1.0 mL min−1) and found to decrease for
increasing pore sizes (Figure 3, gray bars). The mean diameter of MDA-MB-231 cells, measured on 180 cells by microscopy, was 14.6 ± 5.1 μm, and these cells are expected to easily flow through the bigger pores (decreasing efficiency). Likewise, the number of WBCs was also reduced (increasing purity).
Number of Spiked Cells. To test whether the number of cells spiked into the blood sample affect the enrichment for the different pore sizes, 6.1 ± 1.5, 26.6 ± 1.4, or 101.1 ± 5.1 MDA-MB-231 cells were added to the sample (Supporting Information SI-3). As expected, efficiency was not dependent on the spiking numbers, thus also validating our methodology for as little as 6 cells spiked into blood.
As a conclusion, using optimized conditions, the mechanical capture configuration provides a good efficiency (87 ± 2% of MDA-MB-231 cells were captured with 8 μm-diameter pores at 0.1 mL min−1) and a good purity (less than 1000 WBCs on the
filter after rinsing twice with 5 mL of PBS).
Mechanical and Molecular Capture of CTCs. To help target specific cell types, we sought to functionalize filters with antibodies directed against receptors expressed in particular CTCs.
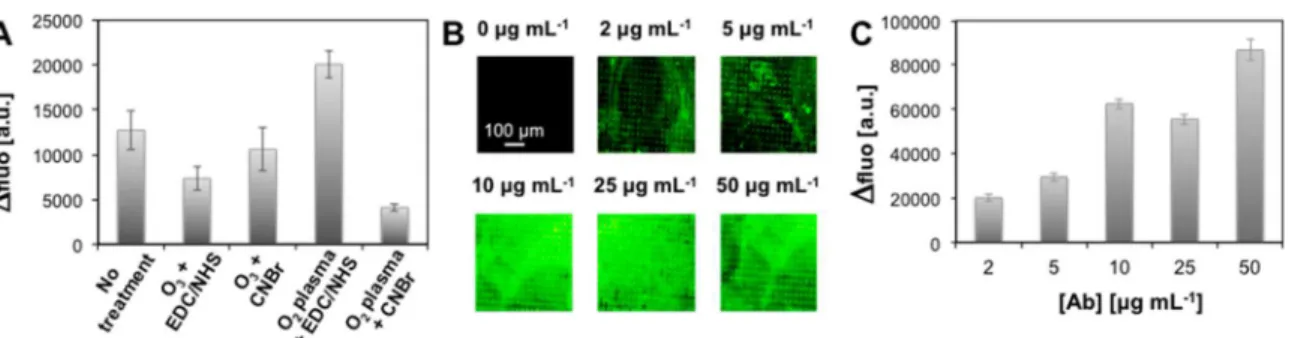
Filter Functionalization. Different functionalization proto-cols were tested using pristine filters or using a chemical activation by oxygen plasma or ozone treatment followed by covalent linkage using EDC/NHS or CNBr-based chemistry of antibodies (Supporting Information SI-4). Filters were functionalized with antirabbit IgG antibody fluorescently labeled with FITC (fluorescein isothiocyanate), and the Δfluo
Figure 3. Performance of the mechanical capture for various pore sizes. Efficiency (red symbols) and number of WBCs (gray bars) were determined for 26.2 ± 1.9 MDA-MB-231 cells spiked in 1.0:6.0 mL of blood/PBS. Samples were filtered through with 8, 10, 12, 15, or 20 μm-diameter pores at 0.1 mL min−1and rinsed twice with 5.0 mL of
PBS at 0.1 mL min−1. Insets show cells, stained for nucleus (blue) and
CK (green), captured on filters with the corresponding pore size. Error bars correspond to the standard deviation of three independent experiments.
between pristine and functionalized filter was used to evaluate the efficacy of each protocol (Figure 4A).
Interestingly, a high fluorescence was observed on pristine filters incubated with IgG indicating that antibodies were adsorbed on the filter. O3treatment followed by EDC/NHS or
CNBr-based chemistry leads to moderate fluorescence increases. For oxygen plasma treated filters, CNBr-based functionalization gave the lowest fluorescence variation of all tested conditions, while EDC/NHS chemistry gave the highest, which was thus selected for subsequent experiments. The influence of IgG concentration on functionalization was tested by varying the concentration from 2.0 to 50.0 μg mL−1(Figure
4B,C). For 2.0 and 5.0 μg mL−1, the surface coverage was not
uniform, leaving areas where fluorescence intensity was close to that of pristine filters. For 10.0 and 25.0 μg mL−1, fluorescence was found approximately constant on the entire filter surface. As the antibody concentration increased to 50.0 μg mL−1,
Δfluo also increased but the overall uniformity of the coating was not significantly improved compared to 10.0 and 25.0 μg mL−1. Therefore, in further experiments, filters were
function-alized by incubation in a 10.0 μg mL−1antibody solution.
CTC Enrichment on Functionalized Filters.To evaluate the feasibility of improving efficiency by combining mechanical and molecular enrichment, filters were used as is or functionalized with antibodies against EpCAM (epithelial cell adhesion molecule) or EGFR (epidermal growth factor receptor) (Figure 5A). These two receptors are expressed on a variety of cancer cells, and cells that only express one or the other receptor were used here to test the enrichment and selectivity of single receptor targeting. MDA-MB-231 cells are a triple negative breast cancer cell with low EpCAM40 and high EGFR
expression.41 MCF-7 breast cancer highly express EpCAM42 but no or a low level of EGFR.41In addition, we filtered two renal cancer cells: 786-O and A-498 that are both EpCAM negative43 but EGFR positive.44,45 The filtration parameters were selected based on the optimal conditions for mechanical capture as per our previous experiments. A total of 27−32 cells of each type were spiked separately into 1.0:6.0 mL of blood/ PBS and filtered at 0.1 mL min−1. Filters were rinsed twice with 5 mL of PBS at the same rate.
The efficiency for MDA-MB-231 cells was increased to 98 ± 3% with anti-EGFR coating compared to nonfunctionalized filters (83 ± 5%) and anti-EpCAM (85 ± 3%) (Figure 5B).
Figure 4.Filter functionalization. (A) Fluorescence increase of filters coated with 2.0 μg mL−1of fluorescent IgG. Antibodies were applied to filters
in a pristine state or after activation by oxygen plasma or ozone treatment followed by EDC/NHS or CNBr-based chemistry. Δfluo was determined by comparison with the filter before incubation. (B) Qualitative and (C) quantitative evaluation of O2plasma + EDC/NHS filter functionalization
with 2.0, 5.0, 10.0, 25.0, or 50.0 μg mL−1of antibody solutions. Δfluo was averaged on 10 images per filter. Error bars correspond to the standard
deviation of three independent experiments.
Figure 5. Filter functionalization enhances efficiency. (A) Schematic representation of the filtration process using pristine filter and filters functionalized with anti-EpCAM or anti-EGFR. (B) Efficiency for MDA-MB-231, MCF-7, 786-O, and A-498 cells using pristine filters (gray) and filters functionalized with anti-EpCAM (red) or anti-EGFR (blue). 26.9 ± 2.3 MDMB-231, 27.6 ± 3.7 MFC-7, 34.2 ± 2.3 786-O or 32.0 ± 2.3 A-498 cells were spiked in 1.0:6.0 mL of blood/PBS, filtered, and rinsed twice with 5.0 mL of PBS at 0.1 mL min−1. For all cells tested, filters
functionalized with antibodies against cells overexpressed receptors significantly increased efficiency. Error bars correspond to the standard deviation of three independent experiments. (p ≤ 0.01, **).
Analytical Chemistry Article
DOI:10.1021/acs.analchem.6b01324
Anal. Chem. 2016, 88, 8510−8517
Likewise, for 786-O and A-498 cells that also overexpress EGFR, efficiency was increased with anti-EGFR filters (93 ± 3 and 96 ± 1%, respectively) but similar when filters were not functionalized (78 ± 2 and 86 ± 2%, respectively) or functionalized with anti-EpCAM (81 ± 2 and 87 ± 4%, respectively). Conversely, anti-EpCAM functionalization helped increase the capture of EpCAM expressing MCF-7 cells to 96 ± 3% (compared to 85 ± 3% with nonfunctionalized filter), while anti-EGFR functionalization does not significantly affect efficiency (83 ± 5%).
These results show that antibody-functionalized filters used in the 3D printed cartridge achieved very high efficiency for all tested cell lines and indicate that antibody functionalization helped improve the efficiency specifically for cells that overexpress the targeted receptors from ≈80% (pristine filters) to >95%, underscoring the advantage of combining mechanical and molecular capture. In both configurations, WBCs contamination was very low, with <0.1% WBCs captured on the filter. In consideration of the high efficiency values and the broad size distribution of all cell lines used here (Supporting Information SI-1D, Table 1), it is expected that patient CTCs, that are on average smaller, will also be captured with high efficiency.
Only a few groups made use of antibody targeting and filtration. However, in all cases, isolation was performed in two steps, and none of them enrich cells both based on their size and molecular expression. Chung et al. used magnetic beads conjugated with anti-EpCAM to target cancer cells. A magnet was used first to attract labeled cells when pushing blood cells out, then cancer cells were finally isolated from residual WBCs by filtration, leading to 70−90% efficiency.34 More recently, Zhang et al. labeled cancer cells with anti-EpCAM function-alized magnetic beads to increase their size. RBCs and free beads were first removed by filtration, then labeled cells were magnetically isolated from WBCs. Using this strategy, Zhang et al. reported 80−94% for the recovery of MCF-7 spiked in blood and >98% purity (number of WBCs near each MCF-7 cells).35 In both cases, cell selection was based on the expression of a single marker only, and filtration was performed to improve purity.
The method we presented here is the only method that selects cells based on mechanical and molecular features. Very high performances are reached, with efficiency and purity in the same range or higher than device described in the literature. The whole isolation process occurs in one single step and is simpler to implement. Moreover, the use of transparent filters allows imaging and cell identification directly on the filter.
■
CONCLUSIONIn this study we introduced combined mechanical and molecular filtration using antibody-functionalized polymer filters and a new 3D printed cartridge permitting rapid assembly and disassembly for retrieval of the filters for analysis. Filters are transparent with low autofluorescence and are thus compatible with image-based identification of CTCs. Multiple processing parameters were systematically optimized (sample dilution, rinsing procedure, filtration flow rate, and filter pore size) allowing one to obtain high enrichment of breast and kidney tumor cells spiked into fresh blood with very low WBCs contamination (<0.1%), in less than 3 h. The enrichment efficiency with pristine filters was 80% and was reliable for between as little as 6−100 cells spiked into 1 mL of blood. After filter functionalization with antibodies against cell surface
receptors, efficiency increased to >96% with good reproduci-bility for all studied breast and renal cancer cell types. Further improvements are possible, for example, processing time may be reduced by increasing membrane porosity or doubling the filter diameter (allowing for quadrupling of flow rates while maintaining the same shear stress) as well as by improving and shortening the rinsing protocol.
To address the challenge of enriching a population of heterogeneous CTCs, it may be possible to stack multiple filters with different pore sizes and functionalized with different antibodies each. Alternatively, a single filter might be coated with multiple different antibodies, thus targeting a broad spectrum of CTCs.
For use in cancer disease management, CTC enrichment technologies should be fast, sensitive, and selective. The proposed cartridge with antibody-functionalized microfabri-cated filters is simple to use and efficiently captures a cancer cells from whole blood and thus represent a promising technology for clinical enrichment of CTCs from different cancers with a diversity of mechanical and molecular features.
■
ASSOCIATED CONTENT*
S Supporting InformationThe Supporting Information is available free of charge on the
ACS Publications website at DOI: 10.1021/acs.anal-chem.6b01324.
Additional data regarding material and methods (SI-1), the effect of the flow rate on purity (SI-2), the effect of the number of spiked cells (SI-3), and filter functional-ization (SI-4) (PDF)
■
AUTHOR INFORMATIONCorresponding Author
*E-mail: david.juncker@mcgill.ca.
Notes
The authors declare no competing financial interest.
■
ACKNOWLEDGMENTSWe acknowledge funding from National Science and Engineer-ing Research Council of Canada (NSERC) and CIHR (Canadian Institutes of Health Research) as part of the CHRP program. D.J. acknowledges support from Canada Research Chair (CRC). J.A.H.-C. thanks the Lloyd Carr-Harris Foundation and CONACyT for fellowships. We acknowledge Dr. Matthias Geissler for his help in the filter fabrication and functionalization. Finally, we thank Dr. Bernard Nisol and Gina Zhou for their critical reading of the manuscript.
■
REFERENCES(1) Chaffer, C. L.; Weinberg, R. A. Science 2011, 331, 1559−1564. (2) Nguyen, D. X.; Bos, P. D.; Massague, J. Nat. Rev. Cancer 2009, 9, 274−284.
(3) Arya, S. K.; Lim, B.; Rahman, A. R. A. Lab Chip 2013, 13, 1995− 2027.
(4) Alix-Panabières, C.; Pantel, K. Clin. Chem. 2013, 59, 110−118. (5) Allard, W. J.; Matera, J.; Miller, M. C.; Repollet, M.; Connelly, M. C.; Rao, C.; Tibbe, A. G. J.; Uhr, J. W.; Terstappen, L. W. M. M. Clin. Cancer Res. 2004, 10, 6897−6904.
(6) Coumans, F. A. W.; van Dalum, G.; Beck, M.; Terstappen, L. W. M. M. PLoS One 2013, 8, e61774.
(7) Seal, S. Cancer 1956, 9, 866−868.
(8) Balic, M.; Cote, R. J. In Genomic Applications in Pathology; Springer: New York, 2015; pp 71−84.
(9) Lv, P.; Tang, Z.; Liang, X.; Guo, M.; Han, R. P. Biomicrofluidics 2013, 7, 034109.
(10) Sun, W.; Jia, C.; Huang, T.; Sheng, W.; Li, G.; Zhang, H.; Jing, F.; Jin, Q.; Zhao, J.; Li, G. PLoS One 2013, 8, e75865.
(11) Tan, S. J.; Yobas, L.; Lee, G. Y. H.; Ong, C. N.; Lim, C. T. Biomed. Microdevices 2009, 11, 883−892.
(12) Mohamed, H.; Murray, M.; Turner, J. N.; Caggana, M. J. Chromatogr. A 2009, 1216, 8289−8295.
(13) Harouaka, R. A.; Zhou, M.-D.; Yeh, Y.-T.; Khan, W. J.; Das, A.; Liu, X.; Christ, C. C.; Dicker, D. T.; Baney, T. S.; Kaifi, J. T. Clin. Chem. 2014, 60, 323−333.
(14) Hosokawa, M.; Yoshikawa, T.; Negishi, R.; Yoshino, T.; Koh, Y.; Kenmotsu, H.; Naito, T.; Takahashi, T.; Yamamoto, N.; Kikuhara, Y. Anal. Chem. 2013, 85, 5692−5698.
(15) Tang, Y.; Shi, J.; Li, S.; Wang, L.; Cayre, Y. E.; Chen, Y. Sci. Rep. 2014, 4, 6052.
(16) Zheng, S.; Lin, H. K.; Lu, B.; Williams, A.; Datar, R.; Cote, R. J.; Tai, Y.-C. Biomed. Microdevices 2011, 13, 203−213.
(17) Tibbe, A. G. J.; Miller, M. C.; Terstappen, L. W. M. M. Cytometry, Part A 2007, 71A, 154−162.
(18) Gleghorn, J. P.; Pratt, E. D.; Denning, D.; Liu, H.; Bander, N. H.; Tagawa, S. T.; Nanus, D. M.; Giannakakou, P. A.; Kirby, B. J. Lab Chip 2010, 10, 27−29.
(19) Hou, H. W.; Warkiani, M. E.; Khoo, B. L.; Li, Z. R.; Soo, R. A.; Tan, D. S.-W.; Lim, W.-T.; Han, J.; Bhagat, A. A. S.; Lim, C. T. Sci. Rep. 2013, 3, 1259.
(20) Shen, Q.; Xu, L.; Zhao, L.; Wu, D.; Fan, Y.; Zhou, Y.; OuYang, W. H.; Xu, X.; Zhang, Z.; Song, M. Adv. Mater. 2013, 25, 2368−2373. (21) Zhao, L.; Lu, Y. T.; Li, F.; Wu, K.; Hou, S.; Yu, J.; Shen, Q.; Wu, D.; Song, M.; OuYang, W. H. Adv. Mater. 2013, 25, 2897−2902.
(22) Nagrath, S.; Sequist, L.; Maheswaran, S.; Bell, D.; Irimia, D.; Ulkus, L.; Smith, M.; Kwak, E.; Digumarthy, S.; Muzikansky, A.; Ryan, P.; Balis, U.; Tompkins, R.; Haber, D.; Toner, M. Nature 2007, 450, 1235−1239.
(23) Earhart, C. M.; Wilson, R. J.; White, R. L.; Pourmand, N.; Wang, S. X. J. Magn. Magn. Mater. 2009, 321, 1436−1439.
(24) Saliba, A.-E.; Saias, L.; Psychari, E.; Minc, N.; Simon, D.; Bidard, F.-C.; Mathiot, C.; Pierga, J.-Y.; Fraisier, V.; Salamero, J. Proc. Natl. Acad. Sci. U. S. A. 2010, 107, 14524−14529.
(25) Mohamadi, R. M.; Besant, J. D.; Mepham, A.; Green, B.; Mahmoudian, L.; Gibbs, T.; Ivanov, I.; Malvea, A.; Stojcic, J.; Allan, A. L.; Lowes, L. E.; Sargent, E. H.; Nam, R. K.; Kelley, S. O. Angew. Chem., Int. Ed. 2015, 54, 139−143.
(26) Murlidhar, V.; Zeinali, M.; Grabauskiene, S.; Ghannad-Rezaie, M.; Wicha, M. S.; Simeone, D. M.; Ramnath, N.; Reddy, R. M.; Nagrath, S. Small 2014, 10, 4895−4904.
(27) Sequist, L. V.; Nagrath, S.; Toner, M.; Haber, D. A.; Lynch, T. J. J. Thorac. Oncol. 2009, 4, 281−283.
(28) Stott, S. L.; Hsu, C.-H.; Tsukrov, D. I.; Yu, M.; Miyamoto, D. T.; Waltman, B. A.; Rothenberg, S. M.; Shah, A. M.; Smas, M. E.; Korir, G. K. Proc. Natl. Acad. Sci. U. S. A. 2010, 107, 18392−18397.
(29) Dharmasiri, U.; Njoroge, S. K.; Witek, M. A.; Adebiyi, M. G.; Kamande, J. W.; Hupert, M. L.; Barany, F.; Soper, S. A. Anal. Chem. 2011, 83, 2301−2309.
(30) Saad, F.; Pantel, K. Future Oncol. 2012, 8, 321−331.
(31) Zhang, Y.; Wu, M.; Han, X.; Wang, P.; Qin, L. Angew. Chem., Int. Ed. 2015, 54, 10838−10842.
(32) Sajay, B. N. G.; Chang, C.-P.; Ahmad, H.; Khuntontong, P.; Wong, C. C.; Wang, Z.; Puiu, P. D.; Soo, R.; Rahman, A. R. A. Biomed. Microdevices 2014, 16, 537−548.
(33) Ozkumur, E.; Shah, A. M.; Ciciliano, J. C.; Emmink, B. L.; Miyamoto, D. T.; Brachtel, E.; Yu, M.; Chen, P.-i.; Morgan, B.; Trautwein, J. Sci. Transl. Med. 2013, 5, 179ra47.
(34) Chung, Y.-K.; Reboud, J.; Lee, K. C.; Lim, H. M.; Lim, P. Y.; Wang, K. Y.; Tang, K. C.; Ji, H.; Chen, Y. Biosens. Bioelectron. 2011, 26, 2520−2526.
(35) Zhang, H.; Wang, Y.; Li, Q.; Zhang, F.; Tang, B. Chem. Commun. 2014, 50, 7024−7027.
(36) Hernández Castro, J. A.; Li, K.; Meunier, A.; Juncker, D.; Veres, T. Unpublished work 2016; National Research Council of Canada and McGill University.
(37) Rasband, W. S. ImageJ: Image processing and analysis in Java. In Astrophysics Source Code Library, 2012, 1, 06013
(38) Seal, S. H. Cancer 1964, 17, 637−642.
(39) Jones, J. G.; Holland, B. M.; Humphrys, J.; Quew, R.; Wardrop, C. A. Br. J. Haematol. 1984, 57, 457−466.
(40) Gorges, T.; Tinhofer, I.; Drosch, M.; Rose, L.; Zollner, T.; Krahn, T.; von Ahsen, O. BMC Cancer 2012, 12, 178.
(41) Charafe-Jauffret, E.; Ginestier, C.; Monville, F.; Finetti, P.; Adelaide, J.; Cervera, N.; Fekairi, S.; Xerri, L.; Jacquemier, J.; Birnbaum, D. Oncogene 2006, 25, 2273−2284.
(42) Rao, C.; Chianese, D.; Doyle, G.; Miller, M.; Russell, T.; Sanders, R.; Terstappen, L. Int. J. Oncol. 2005, 27, 49−57.
(43) Patriarca, C.; Macchi, R. M.; Marschner, A. K.; Mellstedt, H. Cancer Treat. Rev. 2012, 38, 68−75.
(44) Franovic, A.; Gunaratnam, L.; Smith, K.; Robert, I.; Patten, D.; Lee, S. Proc. Natl. Acad. Sci. U. S. A. 2007, 104, 13092−13097.
(45) Gemmill, R.; Zhou, M.; Costa, L.; Korch, C.; Bukowski, R.; Drabkin, H. Br. J. Cancer 2005, 92, 2266−2277.
Analytical Chemistry Article
DOI:10.1021/acs.analchem.6b01324
Anal. Chem. 2016, 88, 8510−8517