____
ASSESSMENT OF DESALINATION TREATMENT PROCESSES
FOR FUTURE WATER SUPPLIES
by
Chad Howard Stevens
B.S., Environmental Resource Management The Pennsylvania State University
Submitted to the Department of Civil and Environmental Engineering in Partial Fulfillment of the Requirements for the Degree of
MASTER OF ENGINEERING IN ENVIRONMENTAL ENGINEERING at the
MASSACHUSETTS INSTITUTE OF TECHNOLOGY June 2003
@ 2003 Chad Howard Stevens. All rights reserved.
The author hereby grants MIT permission to reproduce and to distribute publicly paper and electronic copies of this thesis document in whole or in part.
Signature of Author:
in
Certified by:
Chad Howard Stevens De ment of Civil and Environmental Engineering April 7, 2003
D id LMA4-I k
av . r
Professor, Department of Civil and Environmental Engineering Director, MIT Labor tory For Energy and the Environment
_- Thesis Supervisor
Accepted by:
Oral Buyukozturk
Chairman, Departmental Committee on Graduate Studies
BARKER
MASSACHUSETTS INSTITUTE OF TECHNOLOGY
ASSESSMENT OF DESALINATION TREATMENT PROCESSES
FOR FUTURE WATER SUPPLIES
by
Chad Howard Stevens
Submitted to the Department of Civil and Environmental Engineering on April 7th, 2003 in Partial Fulfillment of the
Requirements for the Degree of Master of Engineering in Environmental Engineering
Abstract
Supplies of potable water from traditional sources have been increasingly depleted due to increasing world population and per capita water use. On the U.S. Virgin Islands, no traditional potable water source is readily available. Because of this, desalination has become an accepted alternative for supplying potable water. Determining the most efficient desalination system for the islands is pivotal to their success in supplying potable water to consumers in the future.
A performance assessment was performed using two desalination systems located on the U.S. Virgin Islands. The assessment shows that many, small reverse osmosis plants provide the best system configuration for the islands. This configuration minimizes risk and overall operational costs, while increasing system reliability, flexibility and overall net benefit. This system framework can be used worldwide to provide the most efficient desalination system based on the system indicators and how they are weighted against one another.
Thesis Supervisor: Dr. David H. Marks
Title: Professor, Department of Civil and Environmental Engineering Director, MIT Laboratory For Energy and the Environment
Acknowledgements
I would like to thank the faculty and staff of the Department of Civil and Environmental Engineering. Special thanks go to Dr. Pete Shanahan, Daniele Lantagne and Dr. Eric Adams for their oversight and guidance.
I would also like to thank Dr. David Marks for serving as my thesis supervisor.
I would like to thank many of my classmates for their support and friendship during this nine months. Specifically, I would to thank the members of the Caribbean Research Association for the Betterment of Water resources for all of the help and fun they provided in the U.S. Virgin Islands as well as in Cambridge. Additionally, I would like to thank Chris, Devin, Diane, Elise, Jahan, Julie, Rob, Snoop Dogg and Zak for their constant companionship. Without them, my experience at MIT would have been far less enjoyable and memorable.
I would like to thank my parents for teaching me the values of hard work and perseverance. I would not be the person I am today without them.
Table of Contents
Abstract 2 Acknowledgements 3 Table of Contents 4 List of Figures 5 1 Introduction 1.1 Desalination 71.1.1 Drinking Water Scarcity 7
1.1.2 Overview 8 1.1.3 History 10 1.1.4 Costs 11 1.1.5 Feedwater 13 1.1.6 Processes 13 1.1.7 Pretreatment 17 1.1.8 Product Water 18 1.1.9 Waste Discharges 19 1.1.10 Energy 19 1.1.11 Environmental Effects 20
1.2 The United States Virgin Islands 22
1.2.1 Overview 22 1.2.1.1 History 22 1.2.1.2 Location 23 1.2.1.3 Government 24 1.2.1.4 Economy 25 1.2.1.5 Population 25 1.2.1.6 Climate 26 1.2.2 Water Resources 26 1.2.2.1 Introduction 26
1.2.2.2 Water and Power Authority 27
1.2.3.3 Groundwater 27
1.2.3.4 Water Catchment 28
1.2.3.5 Desalination 29
2. Performance Assessment of the Desalination Industry
2.1 Overview 32
2.2 Scope of Study 32
2.3 Indicators 33
2.5 Plant Descriptions
2.5.1 Water and Power Authority - St. Thomas 37
2.5.2 Water and Power Authority - St. John 44
2.5.3 Aqua Design 51 2.6 Methods 56 2.7 Results 57 2.8 Discussion 62 2.9 Conclusions 64 References 65 Appendices 70
List of Tables and Figures
Figure 1 - Earth's water Distribution 7
Figure 2a - Percent of Population with or without access to potable water
in 2000 8
Figure 2b - Estimated percent of population with or without access to potable
water in 2000 8
Figure 3a - Percentage comparison of desalination processes used worldwide 9 Figure 3b - Percentage comparison of distillation processes used worldwide 9 Figure 4 - Number of desalination plants in operation worldwide 10 Figure 5 - Timeline of selected events in desalination history 11 Figure 6 - General comparison of potable water costs from desalination and
traditional sources 12
Figure 7 - Flow diagram for the multi-state effect distillation process 14 Figure 8 - Flow diagram for the multi-state flash distillation process 15
Figure 9 - Flow diagram for the vapor compression distillation process 16 Figure 10 - Flow diagram for the reverse osmosis process 16
Figure 11 - Map of the Caribbean 23
Figure 12 - Map of the U.S. Virgin Islands 24
Figure 13 - Population of the U.S. Virgin Islands 26 Figure 14 - Annual rainfall in the three major U.S. Virgin Islands compared
to the thirty year average 28
Figure 15 - Average annual rainfall of the three major U.S. Virgin Islands
compared to the thirty year average 29
Figure 16 - Distillation plants built on either St. Thomas or St. John 31 Figure 16.5 - List of desalination plants used for assessment 37
Figure 17 - Krum Bay desalination plant 38
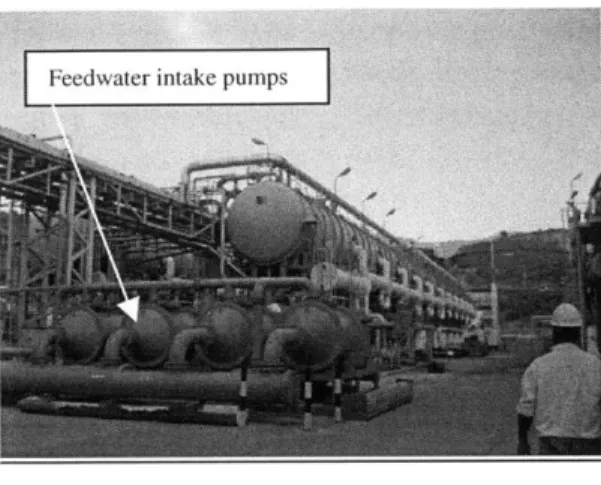
Figure 18 - Feedwater intake pumps at the WAPA Krum Bay plant 38
Figure 19 - Chlorine storage tanks 39
Figure 20 - Chlorine dosage units 39
Figure 21 a - Feedwater intake pumps for IDE #8 40
Figure 21b - Feedwwater intake pumps of IDE #1 and IDE #2 40
Figure 22 - Chemical storage tank containing sodium sulfite 40 Figure 23 - Brine and product water extraction from IDE #1 and IDE #2 41
Figure 24 - Steam recycle pipe at end of unit 42
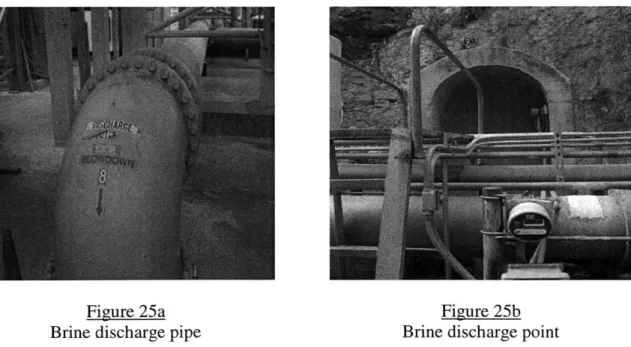
Figure 25a - Brine discharge pipe 42
Figure 25b - Brine discharge point 42
Figure 26 - Oil-powered electrical power plant 43
Figure 27 - Waste steam recycle unit 44
Figure 28 - Frank Bay desalination plant 44
Figure 29 - Intake pumps and vacuum pump at the Frank Bay desalination
plant 45
Figure 30 - Pretreatment at the Frank Bay plant 46
Figure 31 - Filters at the Frank Bay plant 46
Figure 32 - Heat exchange at the Frank Bay plant 47 Figure 33 - Vapor compression unit in the Frank Bay desalination plant 48 Figure 34 - Brine and product water pipes leaving vapor compression unit 48 Figure 35 - Reverse osmosis pump at Frank Bay desalination plant 49 Figure 36 - Reverse osmosis membrane tubes at Frank Bay desalination
Plant 49
Figure 37 - Post treatment filter at Frank Bay plant 50
Figure 38 - Brine discharge pipe at Frank Bay desalination plant 51
Figures 39a and 39b - Brine discharge at the Frank Bay desalination plant 51
Figure 40 - Caneel Bay Resort desalination plant 52
Figure 41 - Caneel Bay feedwater intake pipe 53
Figure 42 - Old cistern tanks at Caneel Bay desalination plant 53 Figure 43 - Filtration units at the Caneel Bay Resort desalination plant 54 Figure 44 - PVC pipes containing reverse osmosis membranes at the
Caneel Bay desalination plant 55
Figure 45a - Brine and feedwater pipes at Caneel Bay plant 55
Figure 45b - Brine discharge point at Caneel Bay plant 55
Figure 46 - Assigned plant numbers 57
Figure 47 - Cost to produce 1,000 gallons of potable water for the 4
desalination plants studied 58
Figure 48 - Fuel required to produce 1,000 gallons of potable water for
the 4 desalination plants studied 58
Figure 49 - Effluent water temperature at the 4 desalination plants studied 59 Figure 50 - Maximum and minimum pH at the 4 desalination plants studied 60 Figure 51 - Effluent water flow per amount of potable water produced at the 4
desalination plants studied 60
Figure 52 - Results of system scoring assessment 61
1. Introduction
1.1 Desalination
1.1.1 Drinking Water Scarcity
Freshwater is one of Earth's most valuable renewable resources. Along with the supply of energy, access to freshwater is a fundamental need of all societies. Although water covers approximately 70 percent of the Earth's surface, supplies of potable water are rapidly disappearing. This is because only 0.62 percent of all water on Earth is available in a form that can be traditionally treated for human consumption, as shown in Figure 1 (USGS, 1967).
Figure 1
Earth's water distribution
During the last century, these potable water sources from both surface and groundwater sources have been increasingly depleted due to increases in worldwide population and increases in per capita water use (Kufahl, 2002). One study of water scarcity trends estimates that of the approximately 6.3 billion people living on Earth (US Census, 2003), 400 million people now live in water scarce areas, and the number living in
water-stressed areas could grow to 4 billion by mid-century (Angelo, 2000). This data is shown in Figures 2a and 2b. Moreover, various human activities have increased the pollution of
these sources, which has decreased the total amount of water available for human consumption. No Access 6% Acs Access 63% 94% Figure 2a Figure 2b
Percent of population with or without Estimated percent of population with or access to potable water in 2000 without access to potable water in 2050 While these figures are projections and subject to speculation, solid evidence of water scarcity based on present day trends does exist. Currently, mankind is draining potable water supplies at a rate of over 110 billion gallons per day (Anonymous, 2001).
Additionally, the demand for potable water increased six-fold during the 20th century while the world's population increased three-fold. At the same time, pollution and overuse of potable water sources reduced the ability of developed potable water sources to meet demand (Kufahl, 2002).
1.1.2 Overview
Desalination is an industrial process that removes dissolved minerals, typically salts, from seawater or brackish water so that it can be used for human consumption. Water treated through the desalination process can be treated to levels significantly less than the
standards outlined by the Safe Drinking Water Act (EPA, 1974) for waterborne pollution. However, due to economic factors, water treated through the desalination process is typically either treated to acceptable potable standards or is treated to much cleaner levels, then blended with more polluted water. The desalination treatment process is highly complex and requires an efficient and accurate control system in order to minimize overall operational costs and maintenance.
Distillation and reverse osmosis are the two dominant desalination treatment systems. One of the two is in operation in most desalination plants worldwide. Three different types of distillation exist: multi-state flash, multi-state effect, and vapor compression. As of 1999, distillation, the older of the two systems, constituted more than 65% of the total market share with multi-stage flash processes accounted for 55% and other
the remaining 35% of the total market share (Alatiqi, 1999). These trends are shown in Figures 3a and 3b.
Figure 3a
Percentage comparison of desalination processes used worldwide
Figure 3b
Percentage comparison of distillation processes used worldwide The number of desalination plants in operation, or being planned for operation,
worldwide has increased dramatically over the last five years. This increase is primarily to support urban and industrial developments in arid, semi-arid, or remote areas of the world. These areas have severe water scarcity where water from any source, especially from traditional sources, is to costly to develop. The market for water in these areas is driven by increasing populations, severe water shortages and increases in the quality of life that demand more potable water (Tsiourtis, 2001). The increase in the number of desalination plants can be attributed to:
Reverse Osmosis 35% Distillation 65% Multi-State Bfect and Vapor Compression 15% Muhi-State Flash 85%
" the reduction of available traditional water sources caused by overuse and
pollution of the sources
" increases in the costs associated with providing potable water from traditional sources due to scarcity
" increased drinking water treatment standards
" decreases in costs associated with providing potable water from desalination sources
As Figure 4 shows, the number of plants in operation worldwide in 1992 was estimated to be around 7,500 (CCC, 1992). In 1993, 9,910 plants were in operation (Maheshwari,
1995), and according to current estimates, there are approximately 11,000 plants currently in operation worldwide. These plants produce over five billion gallons of potable water per day. In addition to existing plants, many more desalination plants are currently under construction. The majority of industry experts also expect the
desalination market to double in size within the next 20 years (Angelo, 2000).
25000 2022, 22000 20000- 15000-2002, 11000 10000 1992, 7500 5000 1 1985 1995 2005 2015 2025 Figure 4
Number of desalination plants in operation worldwide (Year, Number of Plants)
1.1.3 History
The fundamentals of desalination have been known and practiced for thousands of years. Evidence suggests that around 1400 B.C, ancient mariners knew that seawater could be evaporated and the produced vapor could be collected (Kufahl, 2002), cooled and then used for drinking (Fong, 2001). The United States first started work on desalination technologies in 1771. In that year Thomas Jefferson, then Secretary of State, wrote a technical report describing a simple distillation process. The information was printed on the back of all the papers on board United States ships so sailors would have access to the information in the event of an emergency (RPI, 1995).
More sophisticated desalination processes were researched and developed in the 1800s (Kufahl, 2002). Water desalination began on an industrial scale in the early 201h century (Alatiqi et al, 1999) with the first plant being built in 1907 (Al-Munaz, 1996).
Experiments were conducted on the first municipal plant in 1928 in Saudi Arabia (Al-Munaz, 1996). Then, in the 1950s the first widespread commercial desalination plants were built (Fong, 2001) for public water supplies in water deprived regions like the Caribbean and the Middle East. In 1952, the United States created the Office of Saline Water within the Department of the Interior to research and to investigate desalination as a solution to the drinking water shortage that developed shortly after World War II (RPI,
1995). From 1960-1980, the desalination industry began to expand and spread. During
this period, the technological industry standard for the process was multi-state flash treatment. Typical production was around 6 million gallons per day. From 1980-1999, the industry standard for treatment shifted from multi-state flash to reverse osmosis (Alatiqi et al, 1999). Figure 5 presents a summary of this information as a timeline.
N e
Figure 5.
Timeline of selected events in desalination history
Desalination as a potable water source for public supplies was typically economical only in cases where no other reliable source of water could be found. However, in the last 10 years desalination has become economical in many more situations.
1.1.4 Costs
Traditionally, it has been thought that the cost per unit volume of potable water supplied by a desalination plant is much greater than from other drinking water sources (Sajwani, 1998). While historically true, Figure 6 shows that the gap in costs between desalination and traditional water sources per unit volume of potable water is rapidly narrowing (Angelo, 2000 and Kufahl, 2002).
12
10-
8-Desalination
-a- Traditional Sources
4- 2-0 1970 1980 1990 2000 2010 Year Figure 6
General comparison of potable water costs from desalination and traditional sources Two primary costs, energy consumption and operation of the chosen desalination system, affect the overall cost per unit water of a desalination system. The amount of energy required by a desalination system depends on plant performance, the quality of energy used and operational temperature. How the energy is applied, whether directly or indirectly, affects costs as well. The true cost of energy in the desalination process depends on the efficiency of transferring the supplied fuel into consumable energy that the desalination treatment process can use (Darwish and Al-Najem, 1987). Operation of the chosen desalination system can also greatly affect cost. Plant maintenance,
operations, and monitoring all contribute to the cost of the supplied, potable water. Typical operational parameters that contribute to costs are summarized below (Darwish et al, 1989).
* Size of plant
" Type and cost of desalination process in operation
* Costs of chemicals
* Quality of feedwater
"
Energy use* Required quality of output
Desalination techniques for supplying potable water have become more popular within the last five years due to increases in the cost of potable water supplied from traditional freshwater sources. Decreases in the cost of desalinated water due to technological advances made through research on the process and increased competition among suppliers have also made desalination more popular (Fong, 2001). The reduction in the cost of desalination results from improvements in the reverse osmosis process; the increased usage of reverse osmosis rather than distillation methods; and a better understanding, through research, of how to control the process to minimize total costs
and decrease energy consumption. For example, salt rejection from membranes in reverse osmosis plants has increased from 99.2 to 99.8 percent. This eliminates the need for a second membrane and drastically reduces costs (Angelo, 2000). Recently, scientists have found a new method that uses two membranes and requires only 75 percent of the pressure required in the one membrane treatment method. This has reduced costs by another 20 to 30 percent, but is still in the experimental phase (Landers, 2003). In addition, operating pressures have dropped by two or three times in the last 10 years, reducing energy requirements by 50 percent.
Generally, as desalination plants increase their output capacity, economies of scale increase that reduce overall operating costs. This is particularly true for distillation plants. They can use the heat generated by the distillation process to increase overall efficiency, recovery rates and economies of scale.
1.1.5 Feedwater
Feedwater can be defined for the desalination process as the raw, untreated water that enters the process for treatment. In processes with more than one stage or series, feedwater is the water that enters the stage or series for treatment. Desalination plants use seawater, brackish water or reclaimed water as feedwater. Desalination plants are typically designed to treat only one of these types of water because desalination plants are built in areas with access to only one of these sources of feedwater.
1.1.6 Processes
Although many different types of desalination plants exist, the two most prevalent desalination systems are distillation and reverse osmosis (Hanson et al., 2002). Three types of distillation processes exist: multi-state flash, multi-effect flash, and vapor compression. Traditionally, multi-state flash processes have been the preferred method of desalination, but recently the industry has shifted towards reverse osmosis (Al-Mutaz,
1996). Other methods of desalination that have been researched, but have seen very little implementation due to high costs, include freezing, electrodialysis (Buros, 1983),
recovered energy heating and humidification-dehumidification (Bourouni, 2001). The multi-state effect distillation process is the oldest technique employed for
commercial seawater desalination. In the process, feedwater is heated while the ambient air pressure is decreased until water "flashes" into vapor phase, which then condenses. It can then be collected, treated as necessary and used for drinking. Figure 7 (CCC, 1992) shows a flow diagram of the multi-state effect process. Multi-state effect distillation typically involves a series of heating/condensing stages, each of which is performed at lower pressures using recycled heat and water from the last stage to increase overall efficiency. In each effect, steam passes through and heats either horizontally or vertically aligned tubes. Then feedwater is sprayed evenly onto the extremely hot tubes, which causes the water to evaporate and the salt to remain on the tubes. Thus, the water is separated from the salt and can then be condensed and collected (Van der Bruggen and
Vandecasteele, 2002). The steam from the first effect becomes the feedwater for the second effect. Traditionally, 24 effects or stages are used in the multi-state process (Alatiqi, 1999), but technological advancements have reduced the number of necessary effects to between 8 and 16 in newer plants (Van der Bruggen and Vandecasteele, 2002).
Seawater Cooling
FEl
E
Sta Spl r f Intermediate Effects a f Produc
Condensate hee t
Return0 Brn
Multple Effect
Figure 7
Flow diagram for the multi-state effect distillation process
Multi-state flash distillation came into practice in the 1960s. This process is easier to operate and more reliable than multi-state effect distillation. In the multi-state flash process, water passes though a number of evaporators operated in series. In each evaporation chamber, a fraction of feedwater is heated until it changes phase and becomes steam. This allows the water to be separated from the salts. The remainder of the feedwater is kept at low temperature and is passed through a series of closed pipes. The steam condenses through heat exchange as it comes in contact with these cool pipes and is collected by trays (Van der Bruggen and Vandecasteele, 2002). Waste heat from one series is subsequently used to evaporate water in the next series. The fraction of the feedwater that is not converted to steam is used in the closed pipes in one series and becomes the steam used in the next series. Figure 8 (CCC, 1992) shows a flow diagram of this process.
Produ Seawal
Cooling Return Stea
Heat Reject Section
Heat Recovery Section
er Brine Heater e Condensate Recycle Make Up Muki-State FlashffRecycle) Figure 8
Flow diagram for the multi-state flash distillation process
The vapor compression process involves evaporating feedwater and then compressing the vapor. The compressed vapor is sprayed into a reaction chamber through a very fine nozzle. The rapid expansion of the vapor causes the salt to separate from the water. Differences in the molecular weight of water and salt allow the two to separate. The water vapor has a much lower molecular weight than salt. Because of this, it is sprayed high into the chamber and collected by trays. The collection trays are placed at a height in the chamber that salt can not be sprayed to. Figure 9 (CCC, 1992) shows a flow diagram of this process.
-Brine Product Seawater Supply Vapor Compression Brine Recycle Figure 9
Flow diagram for the vapor compression distillation process
In reverse osmosis, the feedwater that is to be treated is pumped at pressures higher than the osmotic pressure of seawater (Van der Bruggen and Vandecasteele, 2002). This forces feedwater to flow against its natural osmotic gradient and through a
semi-permeable membrane that allows smaller water molecules to pass through, but not larger dissolved salt ions. This is shown as a flow diagram in Figure 10 (CCC, 1992).
Figure 10
Flow diagram for the reverse osmosis process
Feedwater that enters the reverse osmosis process is pretreated in order to remove contaminants that would clog the membranes and reduce efficiency. Desalination plants that are currently being designed use one membrane. This one membrane will treat water
N
--
to recommended standards, but two membranes are still often used to improve effluent water quality. In the past, two membranes were always used due to poor membrane quality.
Reverse osmosis membranes are made from ultra-thin polymeric composites layered upon one another. They are typically configured as spiral-wound nodules. In this configuration, seawater flows between two flat membranes wound around a tube. An alternative to spiral-wound membranes are hollow fiber membranes. These membranes form tubes through which the water passes (Van der Bruggen and Vandecasteele, 2002). Originally, reverse osmosis was an expensive desalination option (in comparison to the distillation processes) due to the high cost and low life span of the membranes used in the process, as well as high maintenance costs involved (Fong, 2001). Numerous
developments have decreased the costs involved with operating a reverse osmosis plant. Improvements in membrane efficiency have eliminated the need to use a second
membrane and have decreased maintenance costs. Additionally, increased competition among membrane manufacturers is driving down costs. Finally, research conducted on reverse osmosis treatment process have cut energy requirement by 50% or more due to reductions in the process's operating pressures and energy inputs (Angelo, 2000). Distillation techniques have many advantages over reverse osmosis.
" Distillation plants do not shut down portions of their operations for maintenance, such as replacement, cleaning or updating of equipment as often.
" Distillation plants have fewer pretreatment requirements because coagulants do not need to settle out. In reverse osmosis, coagulants do need to settle out particles before water passes through the membranes to prevent clogging. * Distillation plants do not generate waste from backwash of pretreatment filters
because, unlike reverse osmosis, they do not have filters. Reverse osmosis has many advantages over distillation techniques.
* Feedwater does not require heating so discharged water has less thermal impact on the environment.
" Reverse osmosis produces more potable water per unit of feedwater. " Less energy is required for reverse osmosis.
" Removes unwanted contaminants that can adversely affect human health, such as trihalomethanes, volatile organic coompounds, and bacteria. These particles are rejected by the membrane based on their size.
" Reverse osmosis has fewer problems with corrosion " Reverse osmosis requires less space per unit of water
1.1.7 Pretreatment
Pretreatment processes aim to remove substances from the desalination process that would interfere or reduce overall efficiency if they were allowed to remain. Traditional
pretreatment employs two methods: mechanical and chemical. Mechanical methods are the use of filters which physically separate the harmful substances from the feedwater. Chemical pretreatment methods are the addition of various chemicals that serve several purposes like coagulation or flocculation. Microorganisms, like algae and bacteria, are the most common organisms that pretreatment processes seekeliminate. The most common pretreatment methods for removing these microorganisms are chlorination,
ozone exposure and ultraviolet light exposure. Chlorination is a chemical method. Ozone and ultraviolet exposure can be considered chemical methods that kills the
microorganisms which are then removed by either a physical method, typically a filter, or another chemical method like coagulation or flocculation. If chlorine is used, the water must be decholorinated in the reverse osmosis before reaching the membranes because some reverse osmosis membranes can be destroyed or severely damaged by prolonged exposed to chlorine. Similarly, if ozone is used, it must be removed with chemicals before reaching the membranes to prevent damage (CCC, 1992).
Reverse osmosis plants and distillation plants have many of the same pretreatment requirements, but each process does have specific requirements that are not necessary in the other. In reverse osmosis plants, suspended solids present in the feedwater must be removed before reaching the membranes to reduce clogging, improve membrane efficiency and reduce cost. Typically, the pretreatment processes utilized to remove suspended solids from feedwater entering the reverse osmosis process are coagulation and filtration.
In distillation plants, metals, because of their corrosive properties, need to be removed by pretreatment processes. Typically, the pretreatment process utilized to remove metals from the distillation process is the addition of anti-corrosive chemicals that either settle the metals out or neutralize the chemicals' corrosive properties.
1.1.8 Product Water
Both distillation processes and reverse osmosis produce a high-quality water product. Distillation plants produce water that ranges from 1.0 to 50 ppm total dissolved solids (TDS), while reverse osmosis plants produce water that ranges from 10 to 500 ppm TDS (CCC, 1992). Extra precautions are taken with product water from desalination plants where the effluent is intended for domestic use. Post-treatment processes ensure that the water delivered by the desalination plants to consumers meets appropriate state, federal and recommended international drinking water health standards as well as other non-mandatory, secondary drinking water standards.
Water delivered to consumers from desalination processes is usually much cleaner than required by the region's drinking water standards. Because of this, when the product water is intended for municipal use, it is often mixed with water that contains higher levels of TDS from other traditional sources to cut overall costs for the water supplier. In addition, pure desalination water normally has extremely low pH levels. These pH levels can be extremely corrosive to the distribution pipes and cause additional maintenance
costs. Mixing water from the desalination process with other sources of water prevents corrosion and typically saves the water supplier money (Alatiqi, 1999).
1.1.9 Waste Discharges
Desalination plants produce liquid wastes with many different types of individual constituents. These wastes may include:
" high salt concentrations from the brine water
" chemicals used during pretreatment, post-treatment, plant maintenance, and plant cleaning
* filter backwash containing suspended solids like microorganisms and organic debris
* non-toxic and toxic metals
Desalination plants can dispose of these wastes by: * discharging them directly into the ocean
* combining them with other discharges like power plant cooling water or sewage treatment plant effluent before ocean discharge
* discharging them into a sewer for treatment at a wastewater treatment plant * drying them out and disposing of them in a landfill.
According to the Florida Department of Environmental Protection, Tampa Bay has natural dissolved salt concentrations of about 26,000 mg/L while the Gulf of Mexico has dissolved salt concentrations that range from 32,000-35,000 mg/L. The Florida DEP estimates that returning salt brine from the new desalination plant being built for the City of Tampa Bay to Tampa Bay will only result in a 1.5 percent increase in local salinity levels, well within acceptable environmental standards (Angelo, 2000). This is only one example of acceptable operations, but these discharges can still cause severe damage when not handled appropriately.
1.1.10 Energy
Desalination plants have high energy requirements. The energy used in the desalination process is primarily electricity and heat. Energy requirements for desalination plants depend on the following criteria (Kufahl, 2002):
* salinity of the feedwater * temperature of the feedwater * source of feedwater
* the quality of the water produced
* the desalination technology used (distillation technologies, due to their elevated operating temperatures, require more energy than reverse osmosis technologies)
The energy used in desalination plants can either be applied as mechanical or thermal energy (Darwish and Al-Najem, 1987). Mechanical energy is energy that is possessed by an object as a result of its motion or of its stored energy resulting from its relative
position. Thermal energy is energy that results from heat produced by increasing the temperature of a system.
Feedwater is heated in the desalination process to make the process more efficient (Kufahl, 2002). As the temperature of the system increased, the total amount of potable water produced per unit time increased.
In general, the energy required to produce a specific volume of potable water from any desalination process is much greater than the energy required to produce the same volume of potable water from traditional drinking water sources. For example, for the City of Santa Barbara's desalination plant to deliver the same amount of potable water as the Colorado River Aqueduct to Santa Barbara, it would require 2 to 3 times more energy
(CCC, 1992).
Both reverse osmosis and distillation plants can benefit from cogeneration plants, where potable water and electricity are produced at the same plant to reduce energy use and total costs. This is sometimes called "piggybacking" (Tsiourtis, 2001). In piggybacking, the electricity-producing power plant supplies energy to the desalination plant when the
cost of electricity is low. The electrical plant sends its wastewater, which has a very high temperature, to the desalination plant where the heat is used to heat the feedwater to increase the processes efficiency and reduce energy requirements. By piggybacking, the desalination plant gets electricity for free, or at a reduced rate, in return for dissipating heat generated by the electricity-generating process that it would have to pay to cool otherwise (Kufahl, 2002).
1.1.11 Environmental Effects
Desalination processes can have several severe environmental impacts (Sajwani, 1998). The most important environmental concerns for the desalination process are:
" location of the plant * brine disposal
" energy considerations * chemical disposal " atmospheric emissions " various other factors
A desalination plant must be constructed in a place where it will have minimal
environmental impact and be acceptable to the community, owner and local stakeholders. It should be located in a rural area, near a source of energy, close to a source of feedwater and near a water supply system (Tsiourtis, 2001).
Wastewater from desalination plant effluent has extremely elevated salt concentrations. This wastewater is normally referred to as brine. When discharged into bodies of water, brine can cause ecological damage to the discharge area and harm marine life if the discharge area is not planned appropriately, or the plant exceeds its permitted or recommended effluent concentrations. At the new Tampa Bay desalination plant, for every 4.4 gallons of potable water produced, 1.9 gallons of concentrated saltwater is discharged. Most environmentalists agree that if this wastewater is discharged far away from land in deep waters that it would have minimal effects. However, the wastewater is currently discharged into lagoons or near shore, which may have environmental impacts. These discharges have been deemed to have little to no environmental affect as long as
the effluent is within the legal limits of brine concentration (Mahi, 2001).
The desalination process requires a substantial amount of energy. The use of such a large amount of energy can have serious environmental impact if it supplied by fossil fuels, which cause the emission of greenhouse gases, like carbon dioxide. The use of renewable energy sources such as geothermal energy, wind power, solar energy, tidal kinetics and hydropower can reduce these emissions (Tsiourtis, 2001). In addition, piggybacking decreases the net environmental effect of desalination plants through the reduction of required energy.
A variety of chemicals are used throughout the desalination process. In general, they are used for the following reasons:
* Pre and post-treatment of water " Anti-scaling * Anti-fouling " Anti-corrosion * Anti-foaming * Anti-corrosion " Oxygen-scavenging " Membrane cleaning
The chemicals used in these processes must be properly managed and disposed of to reduce environmental impacts. If not properly disposed of, these chemicals can have a wide variety of affects on ecosystems. Anti-scaling agents can cause eutrophication of the water in the discharge area through macronutrient addition. Anti-fouling agents can cause halogenations to occur, which are known to produce trihalomethanes, a known carcinogen. Anti-foaming additives disturb the intracellular membrane systems of microorganisms. Oxygen-scavengers remove oxygen from the ecosystem, which, among other effects, also results in eutrophication (Hoepner, 1999).
The desalination process produces atmospheric emissions resulting from power
generation required to power the process. For example, reverse osmosis requires a large amount of pumping and distillation requires large amounts of steam generation. In addition, the input of thermal or mechanical energy required to separate salt from water requires energy. All of these processes result in environmental emissions of various
compounds. One such compound, carbon dioxide, is a major factor in the acceleration of global warming (Van der Bruggen and Vandecasteele, 2002).
Other environmental problems can result from feedwater intake, disposal of toxic metals and noise pollution (Sajwani, 1998). Toxic metals form as a result of corrosion within desalination plants. Different metals have different affects on organisms, but all metals are known to have some toxic affect on the cellular level (Hoepner, 1999).
1.2 The United States Virgin Islands
1.2.1 Overview
The United States Virgin Islands are an unincorporated territory of the United States of America (U.S. Department of the Interior, 1998). The islands were placed under the administration of the Secretary of the Interior in 1931 by Executive Order 5566. The territory consists of three major islands: St. Thomas, St. Croix, and St. John as well as approximately 50 other minor islands (Bruno-Vega and Thomas, 1994). The islands are located at the northern end of the leeward islands in the Eastern Caribbean that separate the Atlantic Ocean from the Caribbean Sea. The capital of the United States Virgin Islands is Charlotte Amalie and is located on St. Thomas.
1.2.1.1 History
The United States Virgin Islands have a prestigious and storied history. They were discovered by modern civilization on Christopher Columbus's second voyage in 1493 while sailing for Spain. He christened the archipelago of islands "Las Islas Virgenes" or the Virgin Islands. After their discovery, many different nations including Spain,
Holland, France, England, Denmark and The Knights of Malta claimed the Virgin Islands of their own. Eventually, Denmark claimed half of the archipelago, which would
eventually become the U.S. Virgin Islands, while England claimed the other half, which are to this day the British Virgin Islands (USVI Travel Guide, 2000).
The 1600s were a tumultuous time for the U.S. Virgin Islands under Danish rule. The Danes established the first permanent settlement in the islands on St. Thomas in 1617. The first settlers traveled to St. John in 1684 (United States Department of the Interior,
1998). In 1685, the Danish monarchy signed an agreement with the Dutchy of
Brandenburg to allow the establishment of the Brandenburg American Company, which established an active slave-trading post on St. Thomas. Slavery played a major role on the islands until it was abolished in 1848. Soon after 1685, the early governors of St. Thomas made an agreement with pirates which would allow pirates to use the islands as a refuge. The governors knew that the local economy would benefit greatly from the trade of pirate conquests in an open market on the islands (USVI Travel Guide, 2000).
The 1700s and 1800s were a time of legitimate economic growth and prosperity on the islands. From 1700-1750, the influence of piracy declined on the islands but continued to be important. In 1718, the Dutch established their first settlement on St. John. This
settlement was a fort constructed in Coral Bay. The Dutch chose Coral Bay because it was, and continues to be, one of the safest harbors in the Caribbean. St. Thomas was declared a free port in 1724 by the Danish Monarchy. The Danish government then purchased St. Croix from France in 1733. The united the three major islands of the current U.S. Virgin Islands under one government for the first time. The two primary economic activities on the islands during these two centuries were the raising of sugar cane on large plantations, and the resulting major trading economy (USVI Travel Guide, 2000).
The 1900s marked the beginning of United States rule over the islands. The islands were purchased by the United States as part of a military defense strategy in 1917 from the Danish Crown for $25 million. The government of the United States was concerned that the island might become a German sub base. Native islanders were granted United States citizenship in 1927. The islands were developed as a defense base during World War II, but they were passed over as a major military base due to a lack of an adequate supply of potable water. After World War II, the U.S. Virgin Islands prospered as a popular tourism destination.
1.2.1.2 Location
The United States Virgin Islands are located at geographic coordinates 18 20 N, 64 50 W. The islands cover an area approximately two times the size of the District of Columbia and are located east of Puerto Rico dividing the North Atlantic Ocean from the Caribbean Sea (CIA World Factbook, 2002). The locations of the islands in relation to the rest of the Caribbean are shown in Figure 11 (Britannica, 2002).
Figure 11 Map of the Caribbean
St. Thomas has an area of approximately 64 mi2 and is located 64 miles southeast of Puerto Rico and approximately 1100 miles southeast of Miami, Florida. St. Croix has an area of approximately 84 mi2 and is located approximately 40 miles southeast of St. Thomas. St. John has an area of 19 mi2 and is located 2 miles east of St. Thomas
(Bruno-Vega and Thomas, 1994). Figure 12 (USVI Tourism Guide, 2003) shows the relative size of the three islands.
Figure 12
Map of the U.S. Virgin Islands
1.2.1.3 - Government
The Virgin Islands are a unincorporated territory of the United States of America and thus, are subjected to the United States Constitution and laws.
The islands, like the 50 states within the United States of America, have their own independent territorial government. Since 1970, the U.S. Virgin Islands have had a democratic government where officials are elected in an open, popular vote election. Before 1970, the Secretary of the Interior, under the territory's 1954 revised Organic Act, appointed a governor for the islands (United States Department of the Interior, 1998). The U.S. Virgin Islands, like the United States of America, have executive, legislative, and judicial branches of their government. Of the three parties; the Democratic, the Republican and the Independent Citizens's Movement, the Democratic Party traditionally has held power. The executive branch is lead by a governor and lieutenant governor, each of whom serve four-year terms. The current governor, the Honorable Dr. Charles Wesley Turnbull, and lieutenant governor, the Honorable Gerald Luz James, were elected in 2002 and sworn in on January 6th, 2003 (CIA World Factbook, 2002). The legislative branch consists of fifteen senators who are also elected by popular vote and serve
two-year terms. In addition, the Virgin Islands also elect a member of the Congress of the United States of America. Currently, this representative is the Honorable Donna
from the states with the exception of voting rights on the House floor (Department of the Interior, 1998).
1.2.1.4 - Economy
Tourism is the main economic force on the three major islands on the U.S. Virgin Islands. Each island has a unique economy of its own. St. Thomas can be characterized
economically as a commerc-driven market, while St. Croix and St. John can be characterized as agriculturally-driven markets (Buros, 1984).
Today the U.S. Virgin Islands have a prospering economy. Much of this prosperity is due to the islands' burgeoning tourism industry (USVI Travel Guide, 2000). This industry accounts for over seventy percent of the island's gross domestic product and employment (CIA World Factbook, 2002). Numerous cruise lines make the islands a weekly port of call and many major airlines offer daily flights to the islands. From 1970 to 1990, the tourism industry on the islands increased more than thirty-fold and now brings in over $500 million annually for the islands. In addition to tourism, the islands also have a large manufacturing industry. Manufactured goods include rum, oil, alumina production, pharmaceuticals and watch assembly. A new tax incentive program
administered and initiated by the government of the U.S. Virgin Islands has begun to attract new industries to the islands. The government is offering special tax incentives and export allowances. These factors, along with the island's excellent infrastructure, modern communications, regular transportation to major cities and use of American currency have already attracted many new industries, like the pharmaceutical industry, to the islands (U.S. Department of the Interior, 1998).
1.2.1.5 Population
As shown in Figure 13, the United States Virgin Islands have experienced a tremendous increase in population over the last fifty years due to a dramatic increase in the tourism industry on the islands (Bruno-Vega, 1994 and U.S. Census Bureau, 2001).
120000 100000- 80000-0 CO - 60000-0. 0. 40000- 20000-0 1935 1955 1975 1995 Year Figure 13
Population of the US Virgin Islands
The population of the U.S. Virgin Islands today is estimated to be approximately 124,000 (CIA World Factbook, 2002) and is expected to continue to gradually increase due to economic growth experienced on the islands.
1.2.1.6 Climate
The climate of the United States Virgin Islands is classified as subtropical (CIA World Factbook, 2002). Temperature highs range from 72.6 degrees Fahrenheit to 87.2 degrees Fahrenheit with an average yearly high of 79.9 degrees Fahrenheit (USVI National Park Service, 2002). Average lows range from 50 to 60 degrees Fahrenheit. There is very little seasonal variability in temperature on the islands. The islands are cooled by the easterly trade winds and have relatively low humidity year-round. The rainy season typically occurs from May to November (CIA World Factbook, 2002), but this season can change dramatically from year to year.
1.2.2 Water Resources
1.2.2.1 IntroductionThe United States Virgin Islands have a climate, geology, and location that greatly limit the amount of potable water available from groundwater and surface water sources. The ability to provide an adequate amount of potable water to its citizens has always been a major concern for the government of the U.S. Virgin Islands. Water scarcity is the only current environmental issue listed for the islands by the CIA World Factbook (CIA World Factbook, 2002). The islands have an arid tropical climate where very little rain falls on an annual basis. In addition, the amount of rainfall varies greatly from year to year. The islands also have very little topsoil, a characteristic typical of tropical, arid
islands, and they are very mountainous, with the exception of St. Croix, which is very flat. These factors prevent the accumulation of groundwater in the subsurface of the islands. The islands' small surface area also prevents the accumulation of groundwater and prevents the formation of viable surface water sources.
1.2.2.2 Water and Power Authority
The Virgin Islands Water and Power Authority, also known as WAPA, was created on August 13 th, 1964 (Bruno-Vega and Thomas, 1994), to provide the major islands of the U.S. Virgin Islands with potable water and electricity. Desalination would provide potable water to the three major islands and oil burning electrical power plants would provide electricity. At the time of its creation, the Water and Power Authority was to produce and distribute electricity, but only produce desalinated water. The Department of Public Works was to purchase the water from the Water and Power Authority and distribute it. In 1983, a legislative amendment transferred potable water distribution responsibility from the Department of Public Works to the Water and Power Authority. Today, the Water and Power Authority is responsible for all production and distribution of potable water and electricity on the three major U.S. Virgin Islands (Bruno-Vega and Thomas, 1994).
1.2.3.3 Groundwater
Historically, groundwater has been a major source of potable water for the U.S. Virgin Islands. It was the first solution the islands found for meeting increasing demand as population increased.
Today, St. Croix is the only island that still uses groundwater as a major source of potable water. Groundwater accounts for approximately 33% of the total supply of potable water that the Water and Power Authority distributes on St. Croix. This groundwater has extremely poor water quality due to elevated hardness and salt content (Bruno-Vega and Thomas, 1994). Because of its poor water quality, the groundwater has been
troublesome, causing the corrosion of distribution pipes as well as causing complaints about poor taste.
The Water and Power Authority explored a variety of solutions aimed at improving the water quality of its groundwater sources. It ultimately chose to blend its developed groundwater sources with desalinated water to alleviate these problems and to attempt to meet the Environmental Protection Agency's Safe Drinking Water Act Standards. The groundwater sources have elevated levels of chlorides and total dissolved solids, which cause them to exceed their permitted Safe Water Drinking Act levels. Blending
groundwater with potable desalinated water improved water quality in areas close to the point were the blended water was introduced, but provided little help the further in the distribution system because of accumulation of brackish water intrusion. The Water and Power Authority then looked for another solution to help these water sources meet Environmental Protection Agency standards. It renovated its distribution system to
prevent brackish water intrusion and installed reverse osmosis plants at each well head to improve water quality (Bruno-Vega and Thomas, 1994).
1.2.3.4 Water Catchment
Another method that has been historically employed by the U.S. Virgin Islands to supply water to its residence has been the harvesting of water through water catchment cisterns.
In 1964, the legislative body of the U.S. Virgin Islands brought forth and passed
legislation requiring all new buildings constructed on the islands to use their roof for rain catchment and diversion into cisterns (Bruno-Vega and Thomas, 1994). To "catch"
water, the roofs of homes and other man-made structures divert water from their surfaces into cisterns where they can be stored for use rather than running off into bodies of water or seeping into the ground. Cistern water is used primarily by homes that have no other means of access to water. Lack of access to other sources of water is primarily dictated by either inadequate water generation and distribution capability by the Water and Power Authority, or lack of physical access to an economically feasible distribution route caused by the islands' topography. While the U.S. Virgin Islands Water and Power Authority
aims to provide all residents with access to potable water, it also considers cisterns a valuable source of water for domestic purposes, as well as for use in emergency situations.
For cisterns to be an effective source of potable water, rainfall must be plentiful and reliable. In the U.S. Virgin Islands, rainfall is neither plentiful nor reliable. As Figure 14
(National Weather Service, 2002 and United State Geological Survey, 2002) shows, rainfall on all three islands is widely variable from year to year when compared to the 30 year rainfall average for the islands.
55 - 50-- -+- St. Thomas 40 .-.St. John 40-St. Croix 35 -- 30 Year Average 30 25 2001 2000 1999 1998 Figure 14
Figure 15 (National Weather Service, 2002 and United States Geological Survey, 2002) shows the average rainfall for all three major islands compared to their 30 year average.
60.00
50.00
40.00-3 Average Rainfalls (in)
m 30 Year Rainfall Average (in)
20.00-
10.00-0.00
Average annual rainfall of the
Figure 15
three major U.S. Virgin average
Islands compared to the thirty year
As these figures show, rainfall in the U.S. Virgin Islands low in comparison to other areas of the world and varies in quantity from year to year. Within a year, rainfall varies
widely from month to month. This widespread variability in year-to-year and month-to-month rainfall makes the use of water catchment into cisterns a very unreliable source of potable water for the U.S. Virgin Islands.
Cistern water quality can be very poor. Poor water quality in cisterns primarily results from bacterial contamination. In the U.S. Virgin Islands, homeowners who employ water catchment systems do not typically employ any means of disinfection due to high costs and lack of education. While few illness have been directly linked to drinking water from a cistern, most residents of the U.S. Virgin Islands use cistern water only for domestic uses and purchase bottled water from local vendors for drinking purposes (Bruno-Vega and Thomas, 1994).
1.2.3.5 Desalination
Desalination has historically played a major role in supplying clean, potable water to the residents of the U.S. Virgin Islands and continues to do so. The U.S. Virgin Islands is the pioneer of many types of desalination technology. Because of their extreme lack of other potable water sources, they have commercially applied every type of desalination
technology. The process of desalination contributes approximately 80 percent of the total
1999 1998
amount of water supplied by the Water and Power Authority to the three major islands (Buros, 1984).
Since the early 1900s, desalination has been in use on the U.S. Virgin Islands. In 1915, the government of the U.S. Virgin Islands began to investigate the possibility of using desalination as a source of potable water for the islands. At that time, it was rejected due to extremely high costs. It was not until 50 years later that the idea was revisited and employed; costs associated with the process were still extremely high, but increases in the islands' populations left the government with no other choice. In 1948, a small
greenhouse-type glass-covered solar humidification still was constructed on the islands for experimental purposes. The unit only produced two gallons per day (Buros, 1984). The first real attempt at commercial desalination on the islands came in 1958 when the Congress of the United States authorized the Territory of the U.S. Virgin Islands to construct a 0.275 million gallons per day, 28 stage multi-stage flash distillation
desalination plant. The plant was operational in 1962. In the 1960s, distillation was the only accepted commercially available desalination process. Researchers were searching for a new and innovative, cost-effective approach to desalination. The most heavily researched alternative was freezing. Although the process never became commercially available, research on the process allowed for a company called Israel Desalination Engineering to develop the first commercially available vapor compression unit in 1967. In addition, experimentation done on the freezing process also allowed Israel Design Engineering to produce the horizontal tube multi-effect distillation process. It sold its first multi-effect distillation to the U.S. Virgin Islands in 1980. The first reverse osmosis plant constructed and operated in the U.S. Virgin Islands was built in 1972. It was a 0.07 million gallon per day plant and was used for two years, after which it was shut down due to excessive scaling on its membranes. Numerous other reverse osmosis plants have been built on the islands for desalination of brackish water and seawater (Buros, 1984). Most of these pioneering desalination plants were built for a wide variety of customers, which included the Water and Power Authority, hotels, condominiums and resorts.
The Water and Power Authority itself has operated numerous types of desalination plants. Figure 16 (Bruno-Vega and Thomas, 1994; Buros, 1984) is a summary of these plants, which were built on either St. Thomas or St. John.
Figure 16
Desalination plants built on either St. Thomas or St. John
* MSF = Multi-state flash, VTE = Vertical Tube Evaporator (multiple-state distillation), HTME = Horizontal Tube Multi-Effect (distillation), VC = Vapor Compression
All potable water, except in the capitol of Charlotte Amalie, produced by desalination is
delivered to residents by tanker trucks. This has dramatically increased costs associated with delivering potable water to comsumers.
All of the plants that are still currently operational were built by Israel Desalination
Engineering. The Water and Power Authority of the U.S. Virgin Islands have shared a long and productive relationship with Israel Design Engineering. Initially, the United
States Navy provided Israel Desalination Engineering with the funding to research and design the plants for the U.S. Virgin Islands (Elovic and Willocks, 1998). Currently, they have a total of 9 desalination plants in operation, all of which were designed by Israel Desalination Engineering. In its first order to Israel Desalination Engineering in 1979, the Water and Power Authority ordered three 1.25 million gallons per day multi-effect distillation plants. At that time, only one plant of that type was in operation worldwide. The risk turned out to be a productive one for The Water and Power Authority as all three plants are still operational and are producing quantities of water above their design
capacity. The United States Virgin Islands' Water and Power Authority was Israel Desalination Engineering's first client in the western hemisphere and they have used the first three plants they designed for the Water and Power Authority as examples of their design capabilities to numerous other western hemisphere clients.
In addition to desalination plants operated by the Water and Power Authority, numerous private-companies operate small desalination plants that serve private customers or businesses.
Year Design Type* Current Status
Capacity (mgd) St. Thomas 1962 0.275 MSF Scrapped in 1980 1965 1.000 MSF Scrapped in 1980 1968 2.500 MSF Scrapped around 1984 1975 2.250 VTE-MSF Scrapped
1981 (IDE #1) 1.250 HTME Operational
1982 (IDE #2) 1.250 HTME Operational
1983 (IDE #6) 0.550 HTME Operational
1992(IDE #8) 1.440 HTME Operational
St. John
2. Performance Assessment of the Desalination Industry
2.1 Overview
Like many other areas in the world, the U.S. Virgin Islands can only produce potable water reliably from desalination systems. No other source of potable water is
economically or technologically available. For this reason, maximizing the net benefit and reducing risk of the island's desalination systems is pivotal. The islands need a reliable and flexible system that can provide them with adequate potable water supplies at low costs through extreme natural events, like hurricanes, and during times of normal operation.
Numerous studies have been conducted to evaluate the relative advantages and
disadvantages of each desalination treatment process (Al-Mataz, 1996; Darwish, et al, 1989; Kamal, 1995; Madani, 1990). Most of these studies examined the economics of the processes or the environmental impacts of each process. Very few studies have been conducted to examine the complex interactions of social, economical, and environmental factors into the study. The purpose of this study is to determine which set of available treatment options, plant sizes, and timing of construction schedules maximizes net benefit and minimizes risk in the U.S. Virgin Islands. Analysis of existing treatment options on the U.S. Virgin Islands are used to determine relative strengths and weaknesses of each process in terms of cost, size and long-term reliability and flexibility. Two desalination treatment systems are used: plants operated by the Water and Power Authority and plants operated by Aqua Design. The study also determines the best-long term policy for
operation of a desalination treatment system on the U.S. Virgin Islands. The goal is to provide a framework that any nation or area can use to determine the most appropriate configuration of desalination treatment options, number of desalination plants and size of desalination plants. The framework will be constructed through the use of system
indicators selected to represent the crucial aspects of the system. By analyzing these indicators the U.S Virgin Islands can balance their needs with the associated costs as well as understand how each choice for each indicator will affect their desalination system. Analysis of system indicators is used to determine which configuration presents the U.S. Virgin Islands with the least risk by maximizing flexibility and reliability of the system as a whole. By maximizing these factors, the U.S. Virgin Islands will have the best long-term plan in long-terms of when to build new plants, how many plants to build, what size plants to build, and what treatment technologies to use.
2.2 Scope of Study
This study focuses on desalination units located on the U.S. Virgin Islands, although this model could be used for other areas around the world. The assessment aims to
determine; which treatment process in the most efficient; what time schedule to follow in building new plants; how many plants to build; what size plant to build in order to create the most favorable system that minimizes costs and risks, as well as maximizes system