Publisher’s version / Version de l'éditeur:
Vous avez des questions? Nous pouvons vous aider. Pour communiquer directement avec un auteur, consultez la première page de la revue dans laquelle son article a été publié afin de trouver ses coordonnées. Si vous n’arrivez pas à les repérer, communiquez avec nous à [email protected].
Questions? Contact the NRC Publications Archive team at
[email protected]. If you wish to email the authors directly, please see the first page of the publication for their contact information.
https://publications-cnrc.canada.ca/fra/droits
L’accès à ce site Web et l’utilisation de son contenu sont assujettis aux conditions présentées dans le site LISEZ CES CONDITIONS ATTENTIVEMENT AVANT D’UTILISER CE SITE WEB.
Paper (National Research Council of Canada. Division of Building Research); no.
DBR-P-1121, 1983
READ THESE TERMS AND CONDITIONS CAREFULLY BEFORE USING THIS WEBSITE. https://nrc-publications.canada.ca/eng/copyright
NRC Publications Archive Record / Notice des Archives des publications du CNRC : https://nrc-publications.canada.ca/eng/view/object/?id=ca08b7ce-8eea-4a4d-9c7a-04e24f9a708f https://publications-cnrc.canada.ca/fra/voir/objet/?id=ca08b7ce-8eea-4a4d-9c7a-04e24f9a708f
NRC Publications Archive
Archives des publications du CNRC
This publication could be one of several versions: author’s original, accepted manuscript or the publisher’s version. / La version de cette publication peut être l’une des suivantes : la version prépublication de l’auteur, la version acceptée du manuscrit ou la version de l’éditeur.
For the publisher’s version, please access the DOI link below./ Pour consulter la version de l’éditeur, utilisez le lien DOI ci-dessous.
https://doi.org/10.4224/40001708
Access and use of this website and the material on it are subject to the Terms and Conditions set forth at
Creep of structural steel in fire: analytical expressions
Williams-Leir, G.
National Research
Conseil national
I
*
Council Canada
de recherches Canada
CREEP OF STRUCTURAL STEEL I N FIRE: ANALYTICAL EXPRESSIONS
by G. Williams-Leir
Reprinted from Fire and Materials Vol. 7, No. 2, 1983 p. 7 3
-
78DBR Paper No. 1121
Division of Building Research
Price $1.00
ANALYZED
OTTAWA N R C - C b j i l 22572L I B R A R Y
9
I,il
83-
119-
14
B I B L I O T H ~ Q U E
!Rech.
B;-irri
t ? .,,<.--- 2Deux modzles de f l u a g e , l ' u n propos'e par Harmathy
e t
l ' a u t r e empirique, o n t 8 t 8 adapt& aux mesures d e f l u a g e connues pour s e p t t y p e s d ' - \ d e f q o n2
p e n n e t t r e dl * protsg'! ou
Creep of Structural Steel in Fire: Analytical
G. Wiliams-Leir
Division of Building Research, National Research Council of Canada, Ottawa, Canada
Two models of creep, one proposed by FXarmathy1, the other empirid, have been Wed to published measurements of creep in seven steels. The data have been selected so as to cover the range needed for predicting the survival of protected steel or reinforced concrete buildings exposed to fire.
When steel is repeatedly subjected to moderate loads at normal temperatures, whether in tension or com- pression, it returns to its original dimensions on removal of the load, and while loaded, or stressed, its elongation or strain is proportional to the stress. The frame of a steel building can be expected to suffer no permanent harm unless its temperature or stress exceeds certain levels, and the same observation applies to the reinforcement in a reinforced concrete building. When these levels are passed, damage to the building is not immediate, but a sufficient stress can then produce a time-dependent non-reversible strain. This strain is known as creep, and the survival of the building will depen'd on its magnitude.
The engineer responsible for the structural design of any major building can discharge his responsibilities only by estimating the fuel load, the heat balance and the temperature and duration of a potential fire, and ensuring that the steelwork is sufficiently protected that it will not suffer an unacceptable strain. The actual strain developed will depend upon the stress and
, temperature history in the fire and on the creep properties of the steel.
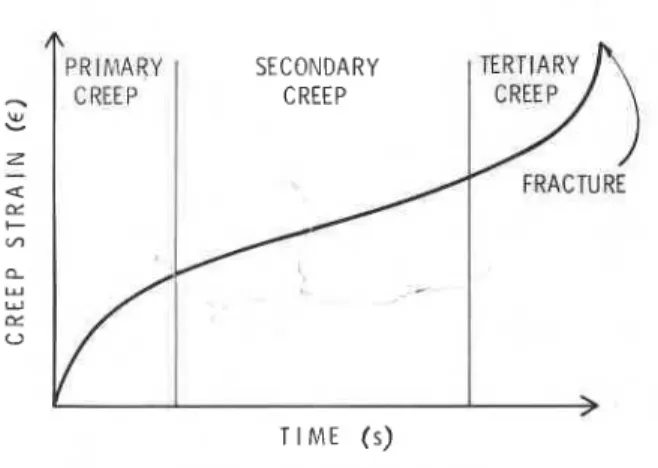
It is customary to recognize three stages or phases of creep once temperature and stress are high enough for creep to be significant: primary, where rate of strain at constant stress and temperature decreases with time from first application of stress; secondary, where rate is constant; and tertiary, where rate increases until rupture (see Fig. 1). It is considered that strains unacceptable in the steel of a building will develop no later than during the secondary stage, so that it is not essential to the design to predict the creep behaviour of the steel into the tertiary stage.
1
The composition, forging procedure and heat treat-'
.merit of steels differ, resulting in products with verydifferent mechanical properties. Data already pub- lished on creep of steel is not readily usable by .building designers. For each steel, strain can, in principle, be predicted by interpolation in a table of strain measurements. Interpolation would not be
A P R I M A R Y SECONDARY
-
CREEP U, b Z-
a CL + L n a W W r Y 0 TI ME (s)Figure 1. Phases of steel creep.
stress, temperature and duration of stress, and the purpose of this paper is to supply suitable expressions, with a firm experimental base.
The expressions should describe the creep be- haviour of each material in terms of the observable determining factors. All other effects have necessarily to be treated as random variation.
No reliable model of creep is yet available that predicts all three stages, but two models will be described that were found acceptable for both primary and secondary creep. These models each depend on several constants; to determine them, it is necessary to make use of published observations of creep in the steel that relate four of the following five quantities:
T("K): temperature
o(lbf inp2): stress (1 lbf in-' = 6.897 KPa)
E (dimensionless): creep strain
and
d min-l: rate of creep strain or
t (min): duration of application of constant stress THE HARMATHY MODEL
difficult if all the points used were free from stochastic Harmathy has
describedl a creep model of the
variations. In fact, observations of creep at fire following form, which will be referred
to as the temperatures are not very and the most model. For its justification readers are referred to the probable strain can be estimated only by taking many
original observations into account. Prediction is most conven-
I
iently done by using expressions that relate strain to &-
bl coth2 (b2&) (1)I
0
Wiley Heyden Ltd, 1983 FIRE AND MATERIALS, VOL. 7, NO. 2, 1983 73G . WILLIAMS-LEIR
where: If these relationships were exact, it would follow
that:
bl = cl exp (c2 In o - c51T), (7
<
ot ( 2 )bl = c6 exp (clo - c5/T), 0
>
CJ~ (3) log t = alTc+
a2 log E+
a30+
a40Tc+
a5Tc log Eb2 = ll(c3d4) (4)
+
a60 log E+
a70Tc log E+
a8 (11)o, is the value of stress at which transition is made
between Eqns (2) and (3) for b, (it is taken as 15 000 lbf in-2 (103 MPa)) and c, to c, are constants.
It is easily shown that continuity between the regimes represented by Eqns (2) and (3) requires that:
There are thus only five independent constants, cl to c5, in this model.
It will be useful to examine some of the implications
of these expressions. Equation (1) may be integrated
at constant stress to obtain a relationship between strain at constant stress, temperature and time:
b2& - tanh (b2&) = blb2t (7)
When the group b , ~ is positive but small compared
with unity, the Maclaurin-Taylor expansion
tanh x = x - x3/3 +
.. .
(8)leads, when terms above x3 are neglected, to the
expression
E
-
(3bltlb22)1'3 (9)whereas for b2& large, the tanh term tends toward unity,
and
E
-
.llbs+
blt (10)Graphs of log E against log t normally have a linear
section, and their gradients should thus lie within the
range
4
to 1. Examination of the observations bearsthis out in general, though some gradients are found outside each end of the range. The reasons for this have not been determined, but the gradients observed are thought to lend support to Eqns (1) to (4).
The five coefficients cl to c5 were determined by non-linear regression analysis (see below).
The H model is found to fit some of the sets of
observations well, as will be discussed later. There are exceptions, however, and these have influenced the decision to search for alternative, totally empirical, models.
THE EMPIRICAL MODEL
The most successful empirical model so far found will
be referred to in this paper as model E. As previously
observed, log E is roughly linear with log t at constant
a and T. From this relation, values of log t,, the value
of log t at any specific strain E , may be inferred.
Again, when log t, is plotted against o at constant T,
the relationship is found to be nearly linear, and log t,,,, the value of log t, at a specific stress a, may be inferred. Finally, when log t,,, is plotted against T, a third linear relation is found.
where Tc is the Celsius temperature, and in fact this expression is found to fit the data quite well. It has the additional advantage of permitting the use of multiple linear regression analysis to determine the coefficients for the prediction of log t. Once these coefficients are known, Eqn (11) is directly soluble for any of the variables, t, E, a or Tc; thus for example:
log t - Tc(al
+
a,a) - a 3 0 - a xlog & =
a 2 + a ( a 6 + a7Tc)+a5Tc (12)
To use the same coefficients as before in Eqn (12) would provide a rough estimate of strain, but not the best possible estimate. For predicting E, a or T, the coefficients need to be optimized by non-linear regression analysis, a more complex mathematical procedure, to be described below.
SELECTION OF OBSERVATIONS
To develop the most reliable expressions for the prediction of creep in the protected structural steel of burning buildings it is necessary to make certain choices within the wide range of observations avail- able. Below about 500 "C protected steel creeps too slowly to prejudice building survival over the time scale of a fire. (If the frame is unprotected and the building has fuel and openings, early failure can be predicted without detailed analysis.) Observations earlier than 4 min tend to be inconsistent with those for longer periods, and are scarcely relevant to
building failure. When strains as large as 2 per cent
develop, it is probable that the building will have been for practical purposes already destroyed, so larger strains are of less immediate concern.
Accordingly, only observations at 500 "C or hotter at times of 4 min or greater have been used, and only a few strains exceeding 2 per cent. The strain rates used in Harmathy's experiments on creep in steel2 were such that strain exceeded 2 per cent in less than 4 min, so no use was made of the results of this work. The data that have been used come from two sources: the work of Fujimoto, Furumura, Ave and shinohara3 on three steels, SS41, SM50 and SM58
(which will be collectively referred to as the J data).
and the work of Knight, Skinner and ~a~~ on four steels, A135, A149, Austen 50 (a 'weathering steel') and X-60 (a 'pipeline steel') (the A data). A149 i s evidently identical with Australian steel 37.'
The J results were presented in the form of graphs
of strain to 1.5 per cent against time to 6 h for
temperatures at 25 degree intervals up to 600 "C and
for stresses that are multiples of 2.5 kg mm-2. For the present work, a number of points, typically four, have been chosen that characterize each strain-time curve, and all the points have been used in the calculations.
CREEP OF STRUCTURAL STEEL IN FIRE
logarithm of strain and that of the prediction is used,
Table 1. Elastic modulus and temperature coefficient (see
Eqn (13)) (calculated from data in references 3 and the quantity minimized is
4) E (In (61~))'
Steel type
(16)
ca(xl0' Ibf in-2) Q ( X K-')
A1 35 3.00 1.51 This produces minimal relative error, which may mean
A149 3.00 1.51 large errors where large strains were observed.
X-60 3.00 1.51 Since the choice is arbitrary, a compromise may be
Austen 50 3.00 1.51 sought between these extremes. It map be shown that
SS41 2.98 0.91
In contrast, the A results are given in the form of tables showing strains at times from 2 min to 16 h, at '
temperature intervals of 50 degrees up to 650"C, and at various stresses. The values are not all consistent with smooth curves, and a selection procedure was
necessary. The first step was to plot log E against log t
for each T and a, to identify the straight section, and
discard points outside it. Using only the points that
passed this first test, log E was plotted against log o for
each T and t. This typically produced a smooth curve,
convex upwards, which was sometimes followed by a concave-upwards section, interpreted as an indication of incipient failure. This section was therefore dis- carded, together with any other points not consistent with a smooth convex curve.
ELASTIC STRAIN
Both Refs 3 and 4 give elastic modulus as a function of temperature for each steel. The following relation,
developed by ~ i e , ~ has been fitted to the values given:
Elastic modulus = c8(l - c9(T - 293)') (13)
and the constants c8 and c9 determined by linear regression analysis. The results are given in Table 1.
NON-LINEAR REGRESSION ANALYSIS - --
From each observation of total strain, the elastic strain
was deducted, leaving creep strain. For each model, the constants were optimized, using the program ZXSSQ' for non-linear regression analysis. The prog- ram searches for the set of values of the constants that minimize the sum of squares of residuals, i.e. of
* differences between each observation and the corres-
is such a compromise, and this expression has been used throughout the present work.
COMPARISON OF PREDICTIONS WITH OBSERVATIONS
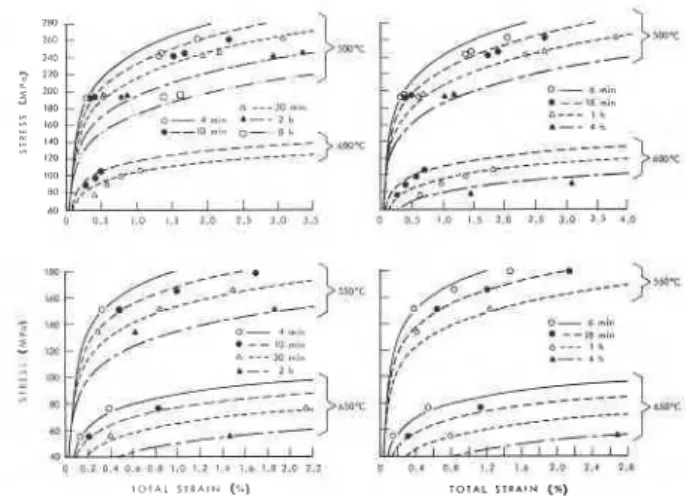
It was not feasible to present here a comprehensive comparison of predictions with observations for seven steels and two models. Representative comparisons
are given in Figs 2 and
3.
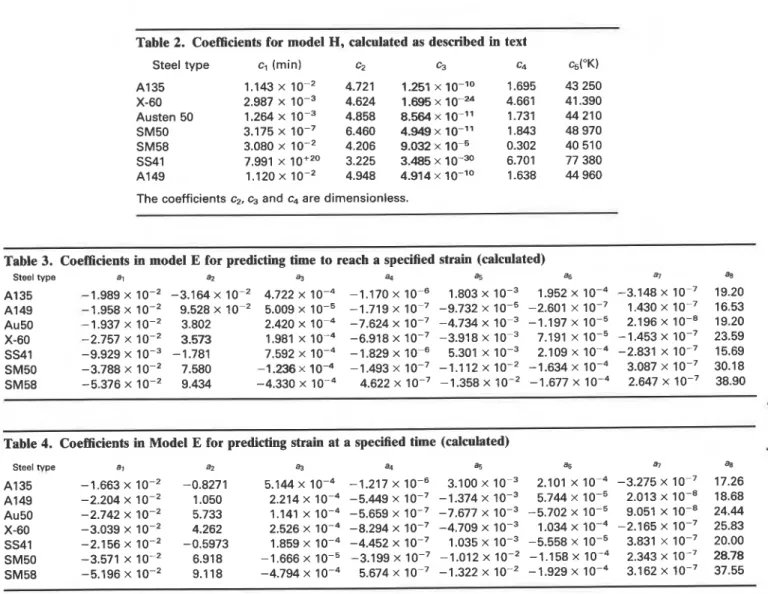
Coefficients for all the steelsare given in Tables 2-4. (.Table 3 represents a linear
regression of l o y o n a, T, and log E , while the
coefficients in Table 4 have been optimized for prediction of strain by non-linear regression analysis, as described above.) SI units are not exclusivelv used because the formal, intervals and units hav; been chosen for compatibility with those of the reports containing the original observations.
The model H equations ((2) to (7)) can be solved
directly for t. To solve for other variables, strain for example, demands numerical or graphical methods
such as ZBRENT~ or the 'rule of false p o ~ i t i o n ' . ~ , ~
Those who wish to keep the programming simple, or who do not have access to computers, should solve for
t and then interpolate the other variables, relying on
linearity between any two of log E, a, T and log t. A
simple program to evaluate both predictions and compare them with data points is available from the author. As mentioned above, the model E equation can be directly solved for any of the four variables.
ponding prediction. For this purpose, 'observation' can mean either the crude measurement or some *
function of it, and the choice of function will influence
the properties of the solution found. n
.-.
---I l b ,.I.The best prediction of large strains would be obtained by minimizing the residual between observed
strain and its predicted value 2.: , ~ ~ o , ~ , n n , , a ~ , l . ~ ~ , . M 7 . ~ 7 . , ,, o c r . I t , A q,Q a , a
l o t a r S T R A I N (3.1 i o ~ ~ r r r a ~ q r r (sa)
E (E - 2)' (15)
Figure 2. Creep plus elastic strain for A135 steel against tensile
but this will in practice lead to large errors relative to stress for four temperatures from 500 to 650 oc and nine times
small observed strains. If the residual between the from 4 min to 8 h. Model E fitted to observations.
G. WILLIAMS-LEIR I.* / ' : mr -k g -
-
RANGE OF APPLICABILITY o , > , , , > m I.. rFigure 3. Creep plus, elastic strsin far SS41 steel against time for five temperatures from' 500 to 6WT and five tensile stresses from 74 to 174 MPa. Solid line: Model H; broken line: Model E.
The models provide predictions that are of utility within a space whose bounds lie inside the following ranges: 500-650 "C, 4 rnin to 16 h, and strains up to 2 per cent. It would be unwise to rely on either model outside the range of the original data. For total strain, elastic strain based on Eqns (13) and (14) and Table 1 should be added to creep calculated as described.
COMPARISON OF THE SEVEN STEELS
Equations have been supplied for predicting creep in seven steels that differ significantly in their perform- ' ance. Which of the seven has the lowest creep depends on the conditions; as an average over the ranges examined in this study, SM58, Austen 50 and X-60 creep least, and SS41 and A149 most. This leaves A135 or SM50 in the median or typical position. If the extreme case is desired, SS41 should be used.
Strains of 2 per cent indicate the probability of serious damage. Stresses of 124 MPa (18 000 lbf inp2) will serve as an example comparable with typical design practice. Fixing these two variables at these values makes it possible to estimate duration of
Table 2. Coefficients for model H, calculated as described in text
Steel type A1 35 X-60 Austen 50 SM50 SM58 SS41 A1 49
The coefficients c2, c3 and c4 are dimensionless.
Table 3. Coefficients in model E for predicting time to reach a specified strain (calculated)
Steel type a1 a2 a-J a4 as a6 4 a8
A135 -1.989 x lo-' -3.164 x 4.722 x -1.170 x 1.803 x loP3 1.952 x -3.148 x loP7 19.20 A149 -1.958 x lo-' 9.528 x 5.009 x -1.719 x loP7 -9.732 x I O - ~ -2.601 x 1.430 x loP7 16.53 Au50 -1.937 X loP2 3.802 2.420x10P4 - 7 . 6 2 4 ~ 1 0 - 7 -4.734x10P3 - 1 . 1 9 7 ~ 1 0 - ~ 2 . 1 9 6 ~ 1 0 - ~ 19.20 X-60 -2.757 x loP2 3.573 1 . 9 8 1 ~ 1 0 - ~ - 6 . 9 1 8 ~ 1 0 - ~ -3.918x10P3 7 . 1 9 1 ~ 1 0 ~ ~ - 1 . 4 5 3 ~ 1 0 - ~ 23.59 SS41 -9.929 X -1.781 7.592x10P4 -1.829x10P6 5 . 3 0 1 ~ 1 0 - ~ 2 . 1 0 9 ~ 1 0 - ~ - 2 . 8 3 1 ~ 1 0 - 7 15.69 SM50 -3.788 x lo-' 7.580 - 1 . 2 3 6 ~ 1 0 ~ ~ - 1 . 4 9 3 ~ 1 0 - ~ - 1 . 1 1 2 ~ 1 0 - ~ - 1 . 6 3 4 ~ 1 0 - ~ 3 . 0 8 7 ~ 1 0 - ~ 30.18 SM58 -5.376 X lo-' 9.434 -4.330 x 4.622 x -1.358 x lo-' -1.677 x loP4 2.647 x 38.90
Table 4. Coefficients in Model E for predicting strain at a specified time (calculated)
Steel wpe A1 35 A149 Au50 X-60 SS41 SM50 SM58
CREEP OF STRUCTURAL STEEL IN FIRE 1 m o n t h 10 d a y s 1 d a y 10 h 1 h 10 m i n 1 m i n
I
I I\I
450 500 550 600 a T E M P E R A T U R E ('C)Figure 4. Duration of survival of seven structural steels: time to reach 2% strain at 124 MPa (18 000 Ibf in-2).
survival of a building as a function of the temperature of its steel structure; this is shown in Fig. 4, as calculated on Model E.
It is a familiar rule of thumb that structural steel loses all strength at about 1000 OF, i.e. 538 "C. Under these conditions survival varies from 7 h for SS41 to 4 days for SM58.
PREDICTING CREEP WHEN TEMPERATURE VARIES WITH TIME
All creep observations used in this paper were at constant temperature and stress; within each series of observations, strain depended on time alone. This is the appropriate way to study creep behaviour, but it does not closely reproduce the effects of building fires, where temperature starts from cold. If the steel is well protected by insulation, its temperature will lag far behind the fire gas temperature, and treating its temperature rise as linear with time will be a reasonable approximation. The variation of stress will be complicated, as unequal strains may redistribute stresses. Such problems must be treated individually.
It will, however, be useful to examine an idealized situation where stress is held constant, but tempera- ture rises linearly, starting from room temperature. For this purpose, model H has the advantage over model E that it is readily integrable. Substituting:
in Eqn (3), and integrating as before, gives a result analogous to Eqn (7):
.
b2.5-
tanh (b24 = b 2 ~ 2 ( b l - bo)/c5a (19) where 4 bo = c6 exp (c70 - c5/To), u>
or (20) bo = cl exp (c2 In o - c51To), (J<
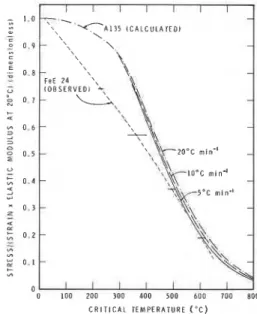
ur (21)Witteveen and Twiltlo describe experiments in which a small beam specimen of FeE 24 steel was, initially, loaded at room temperature until its central deflection was 1/30 of the span. The deflection corresponds to a strain of 0.218 per cent in the extreme fibres. The load that caused this deflection was called Pb200.
C R I T I C A L T E M P E R A T U R E ( O C )
Figure 5. Observations of Witteveen and Twilt on beam deflection with rising temperature, compared with predictions based on model H.
In subsequent.runs,
a
series of smaller loads was applied, and for each the beam was heated from room temperature at various constant rates. The critical temperature Tf at which deflection reached 1/30 of span was observed. The loads, normalized to Pb20", were plotted against Tf for each heating rate.These experiments have been simulated by calcula- tion, using the model H coefficients for A135 steel. Stress was calculated on the assumption that strain followed Eqn (19) while temperature increased linear- ly from To to Tf, at which point strain reached 0.218 per cent. The results are shown in Fig. 5. Within the range 500-650 "C there is good agreement, assuming the two steels to have comparable properties. In particular, the observation of Witteveen and Twilt that rate of heating does not significantly influence the critical temperature is found consistent with the model.
CONCLUSION
The equations and coefficients presented make possi- ble the prediction of total strain in structural steel at temperatures and stresses met with in building fires over a time scale appropriate to such fires.
Acknowledgments
The author thanks Dr T. T. Lie for bringing the problem to his attention, and a referee for many useful comments. This paper is a contribution from the Division of Building Research, National Research Council of Canada, and is published with the approval of the Director of the Division.
NOMENCLATURE
a , - a, Coefficients in model E (a2 and a, are dimensionless; a, and as have dimension
G . WILLIAMS-LEIR
K-l; a3 and a6, in2 lbf-l; a4 and a7,
in2 l b f F 1 ~ - l ) t Time (min) (13))
bo - b2 Functions of a and T (see Eqns (2), (3) and T Temperature (K)
(20)) Tc Temperature ("C)
c,-c, Coefficients in model H (cl in min-l, c5 in Tf Critical temperature ("C)
OK, c2 to c4 dimensionless) To Room temperature (K)
Cs Elastic modulus at 20 C, Ibf in-2 E Strain (m m-'
C9 Temperature coefficient of c8, K - ~ (see Eqn a Stress (Ibf in-
a
)REFERENCES
1. T. 2. Harmathy, A comprehensive creep model. Transac-
tions, American Society of Mechanical Engineers, Journal of Basic Engineering, 89, 496 (1967).
2. T. Z. Harmathy and W. W. Stanzak, Elevated-temperature
tensile and creep properties of some structural and pre-stressing steels. American Society for Testing and
Materials: STP 464 p. 186 (1970).
3. M. Fujimoto, F. Furumura, T. Ave and Y. Shinohara,
Primary creep of structural steel at high temperatures.
Report of the Research Laboratory of Engineering Mate- rials, Tokyo Institute of Techndsgy, No. 4 (1979).
4. D. C. Knight, D. H. Skinner and M. G. Lay, Prediction of
isothermal creep. Broken Hill Pty Co. Ltd, Melbourne
Laboratories, Clayton, Victoria, Australia, Report MRL 1W2
(April 1971). -
5. D. H. Skinner, Measurement of hIgh temperature prop-
erties of steel. Broken Hill Pty Co. Ltd, Melbourne Research
Laboratories, Clayton, Victoria, Australia, Report MRL 6/10
(May 1972).
6. T. T. Lie and W. W. Stanzak, Fire resistance of protected
steel columns. Engineering Journal, American lnstitute of
Steel Construction 10, No. 3, 84 (1973).
7. IMSLIB: International Mathematical and Statistical Librar- ies, 7500 Bellaire Blvd, Houston, TX 77036.
8. G. M. Whittaker and G. Robinson, The Calculus of
Observations, Blackie, London (1924).
9. A. D. Booth, Numerical Methods, Butterworths, London
(1966).
10. J. Witteveen and L. Twilt, Behaviour of steel columns under fire action. Internat. Colloq. on Column Strength, Paris, 1972, in Proc. IABSE 23, 162-70, Zurich (1975).
Received 1 July 1982
Thin publication is being d i s t r i b u t e d by the DF.ziattm of Building R e s e a r c h of the National R e s e a r c h C o u n c i i of Canada. I t should not b e r e p r o d u c e d i n whole o r i n p a r t without p e r m i s s i o n of the o r i g i n a l p ~ ~ b l i s h e r . T h e Di-
v i s i o n would be glad t o b e of a ~ s i s t a n c e in obtaining s u c h p e r m i s s i o n .
P u b l i c a t i o n s of the Division m a y b e obtained by m a i l - ing the a p p r o p r i a t e r e m i t t a n c e ( a Bank. E x p r e s s , o r P o s t Office Money O r d e r , o r a cheque, m a d e p a y a b l e t o t h e R e c e i v e r G e n e r a l of Canada, c r e d i t NRC) t o t h e N a t i o n a l R e s e a r c h Council of Canada, Ottawa. K I A OR6. S t a m p s a r e n o t a c c e p t a b l e .
A l i s t of all publications of the Division i s available and m a y b e obtained f r o m the P u b l i c a t i o n s Section, Division of Building R e s e a r c h , National R e s e a r c h Council of Canada, Ottawa. KIAOR6.
![[PDF] Apprendre à Faire du HDR avec Photomatix PRo - Cours informatique](data:image/gif;base64,R0lGODlhAQABAIAAAP///wAAACH5BAEAAAAALAAAAAABAAEAAAICRAEAOw==)