HAL Id: hal-01609984
https://hal.uca.fr/hal-01609984
Submitted on 4 Oct 2017
HAL is a multi-disciplinary open access archive for the deposit and dissemination of sci-entific research documents, whether they are pub-lished or not. The documents may come from teaching and research institutions in France or abroad, or from public or private research centers.
L’archive ouverte pluridisciplinaire HAL, est destinée au dépôt et à la diffusion de documents scientifiques de niveau recherche, publiés ou non, émanant des établissements d’enseignement et de recherche français ou étrangers, des laboratoires publics ou privés.
Physical Root-Soil Interactions
Evelyne Kolb, Valérie Legué, Marie-Béatrice Bogeat-Triboulot
To cite this version:
Evelyne Kolb, Valérie Legué, Marie-Béatrice Bogeat-Triboulot. Physical Root-Soil Interactions. Physical Biology, Institute of Physics: Hybrid Open Access, 2017, 14 (6), 25 p. �10.1088/1478-3975/aa90dd�. �hal-01609984�
Physical Root-Soil Interactions
Evelyne Kolb
1, Valérie Legué
2, Marie-Béatrice Bogeat-Triboulot
31. PMMH, UMR CNRS 7636, ESPCI Paris, PSL Research University, Sorbonne Université - UPMC, Univ. Paris 06, Univ. Paris 07, 10 rue Vauquelin, 75005 Paris, France
2. Université Clermont Auvergne, INRA, PIAF, 63000 Clermont–Ferrand, France 3. EEF, INRA, Université de Lorraine, 54280, Champenoux, France
E-mail: [email protected]
Keywords: Plant root, mechanical stress, impeding soil, buckling, turgor pressure, root growth
Abstract. Plant root system development is highly modulated by the physical properties of the soil and especially by its mechanical resistance to penetration. The interplay between the mechanical stresses exerted by the soil and root growth is of particular interest for many communities, in agronomy and soil science as well as in biomechanics and plant morphogenesis. In contrast to aerial organs, roots apices must exert a growth pressure to penetrate strong soils and reorient their growth trajectory to cope with obstacles like stones or hardpans or to follow the tortuous paths of the soil porosity. In this review, we present the main macroscopic investigations of soil-root physical interactions in the field and combine them with simple mechanistic modeling derived from model experiments at the scale of the individual root apex.
Introduction
Roots absorb the water and mineral nutrients of the soil required by the shoot. Roots also assure the anchorage of the plant in the soil and provide a stable basis for the shoot emergence. Though interdependent, roots and shoots of the same plant organism live in dramatically different habitats. Responsiveness to change in environmental cues, called developmental plasticity, is markedly large for roots [1]. Root system development is genetically controlled by endogenous rhythms but it is highly modulated by the biological (competition and symbiosis with other organisms), chemical (nutrient availability, oxygen supply, pH…) and physical properties of its environment. The architecture of the root system, that is its three-dimensional shape, largely derives from the distribution and diversity of individual root apical meristems [2], which continuously sense and adjust their growth according to their local environment [3]. In addition, the formation of lateral roots also contributes strongly in shaping root systems and impacts soil resources capture [4].
Under non-stressful biological and chemical conditions, the root trajectory depends highly on the mechanical strength of the soil and on the presence of obstacles at the root scale. In contrast to aerial organs, root apices must exert a growth pressure to overcome the resistance to deformation of the surrounding soil and grow deeper or further into the soil. When experiencing a too large mechanical stress, radicles of seedlings have the ability to pass over stones, roots and other obstacles and deflect towards larger macropores. These intriguing and remarkable root capabilities were already mentioned by Charles and Francis Darwin in their book “The power of movements in plants” [5].
Since then, thorough and synthetic reviews and books in soil science and agronomy described the interplay between physical soil properties and root growth and architecture [6-10]. The aim of the present review is to combine these macroscopic approaches of the soil-root physical interaction with simple mechanistic modeling derived from model experiments at the scale of the individual root apex. The first part of this review summarizes the main characteristics of roots, root systems and soils. Then we describe their interrelationship through observations of the root response to growth in compact soils. The second part focuses on model experiments which tackle the different mechanisms involved in the response of the root apex to local mechanical stresses. In particular, root apices experience axial, radial as well as frictional stresses exerted by the soil. According to these different stresses and their relative contribution, roots respond differently and patterns of growth are modified. Root responses to mechanical stress including axial growth decrease, localized radial growth increase and reorientation of the growth direction will be addressed in three distinct parts. We provide simplified versions of the mechanisms involved and order of magnitudes rather than detailed values and more complex interpretations that can be found elsewhere.
1. Root-Soil mechanical interaction: a complex interplay between root and soil
properties
1.1. Root system and root growth
Depending on plant species and age, a root system consists of different root types: primary or seminal root(s), adventitious roots and/or lateral roots. The primary or seminal root(s) are established during embryogenesis and emerge during seed germination. Adventitious roots develop on organs other than roots like leaf or stem. Lateral roots, formed post-embryonically on roots, usually constitute the bulk of the root system. Whatever its type and composition, the root system architecture is the result of growth of individual axes and of branching, that is lateral root emission [11]. Contrary to what happens in the stem apex, root growth and lateral root emission are processes located in two different zones of the root. The primary growth of the root (growth in length) occurs in the root apex while the primordia of lateral roots are formed from the pericycle layer and emerge in the mature zone of the root where growth no longer occurs (see Fig. 1).
The different root types share common anatomy and growth processes. The root apex, where primary growth occurs, can be divided into developmental zones: a meristem also called proliferation zone (including a transition zone), an elongation zone and a maturation zone (Fig. 1A). Root hairs are emitted in this maturation zone where cell elongation has stopped. Right at the tip of the meristem, the quiescent center, that is an organizational center, is surrounded by stem cells that divide and produce cells that proliferate in the meristem (Fig. 1D). Meristematic cells double in volume (called the cytosolic growth) before dividing. In the transition zone, cells leave the meristematic status and enter a phase of rapid elongation through vacuolization, that is an increase of the vacuole size. When rapid elongation stops, cells, having reached their mature size, enter the mature zone and differentiate. The cells issued from the stem cells are moved away from the quiescent center by the more recently produced cells, proliferating and then expanding, as a fountain. Thus, while the structure is relatively constant over time, the material is continuously renewed: cells flow from the meristem to the maturation zone [12]. The root apex is thus a dynamic system in which cells go through deep morphological and physiological changes [13]. Along the root apex, growth can be quantitatively described by the longitudinal strain rate. Kinematic analysis provides the velocity field (Fig. 1B) and its spatial derivative gives the strain rate field (Fig. 1C) [13, 14]. The strain rate issued from growth kinematics does not distinguish the cytosolic growth from the rapid expansion by vacuolization. In roots of eudicotyledon plants, a secondary growth may occur through the functioning of a secondary meristem, the cambium, in the radial direction, leading to woody roots. This second type of growth will not be considered in this review where we deal with penetration of soils by roots.
In the majority of plant species, the root meristematic zone is surrounded by a root cap [15, 16]. The root cap comprises a central region called columella and a lateral root cap located around it (Fig. 1F). The columella is made up of statocytes considered as the gravity sensing cells, in which there are starch-rich organelles called amyloplasts. In some plant species like Arabidopsis thaliana, the root cap extends far along the flanks of the root apex. Even though the size of the root cap is constant, this root tissue is continuously renewed. Close to the quiescent center, the root cap stem cells produce cells, that, after few divisions, progressively differentiate into columella or lateral cap cells. During their differentiation, the new cells push older cells toward the periphery which form peripheral cells. These cells acquire secretory functions, synthetize and export a high molecular weight polysaccharide mucilage, which forms a hydrated mass around the root tip. Some of these peripheral cells form specific secretory cells called border or border-like cells which slough off in the surrounding soil [17].
Fig. 1: Diagrams of a root apex. (A) The growing zone includes the proliferation zone (also called the meristem) and the elongation zone with the transition zone in between them. It is covered by a root cap. Root hairs grow only in the “mature” zone where there is no more elongation. The evolution of the velocity along the root apex in the reference frame of the immobile soil is shown by the colour gradient and in the graph (B). (C) Strain rate along the root apex. (D) Longitudinal section along the root apex showing a cell file, i.e. a sequence of cells, with the cell length increasing from the quiescent center to the mature zone. The stele that contains the conducting tissues (phloem and xylem) is symbolized in turquoise. Terminology about root tip and root apex depends on studies. Here the root tip is defined as the terminal end of the root, while the root apex corresponds to the growth zone, that is the root cap + the proliferation zone + the elongation zone. (E) Cross section showing the main tissues. (F) Detail of the root cap at the extremity of the root apex. The columella is made of statocytes that contain many starch-rich organelles and are thought to be gravity sensing cells. The lateral root cap covers a part of the proliferation zone. The peripheral root cap cells slough off while some are renewed as the root moves forward in the soil.
1.2. Diversity of soils and mechanical constraints
The root-foraging strategy depends on the nature of the soil or substrate, which results in various root architectures and physiological responses of plants. The rooting strategies will be different for roots growing on shallow soils over bedrocks or massive hardpans, deep loamy soils, artificial composts or even model substrates like vermiculite or agar gels [18, 19]. In addition to environmental cues like water or nutrients, changes in growth direction (tropisms) or in root system development (architectural features like lateral roots formation) depend on the mechanical stress field experienced by the root apices of the growing roots [20]. These stress fields are themselves a function of the soil or growth medium.
Natural soils are usually classified according to their texture, that is the relative proportion of clay (defined as the particles with equivalent diameters smaller than 2 𝜇𝑚), silt (particles between 2 𝜇𝑚 and 50 𝜇𝑚) and sand (particles between 50 𝜇𝑚 and 2 𝑚𝑚) independently of their chemical composition. Besides texture, soils scientists often consider “soil structure” as the spatial arrangement of the different components and properties of soil [21]. A typical volume of surface soil includes about 50% solids, mostly soil particles (45%), and organic matter (generally < 5%) and about 50% pore space [22]. The soil pores are filled with gas (air) or liquid (water) or both, and are classified into channels, fissures and packing pores according to their shape in cross-section [19]. Voids, pores, cracks or crevices can already be present in the soil or produced by tillage, earthworm galleries or former decaying roots [23].
Fig. 2: Schematic diagram of the effect of the size aspect ratio S between root’s diameter and typical length scale of soil heterogeneity on the mechanical stress experienced by the growing root.
When dealing with roots, the natural length scale is the root diameter (dR) which should be compared
with the scale of the soil heterogeneity (dG) (Fig. 2). From a mechanical and geometrical point of view
in natural soils, the large scale heterogeneities arise from physical barriers to root growth like stones or rocks (impenetrable obstacles), hardpans or surface crusts created by rainfall impact [18] (Fig. 2A). At a smaller length scale, roots may encounter clods (dG > 25 mm) that result from compaction by
agricultural machinery or peds that are delineated by desiccation cracks in a shrinking soil [21]. As the rigidity of clods is large compared with that of the root and as the aspect ratio 𝑆 =!!
!! is small, roots cannot deform nor dislodge these large particles which behave like fixed obstacles (Fig. 2B). To be able to grow in this case, roots must exploit the complementary porous network and reorient their growth trajectory. For larger S values, when the size of the soil heterogeneity begins to be comparable
to the root scale, the soil particles are typically aggregates (dG > 250 𝜇𝑚) formed by wetting and
drying cycles [24] or sand particles, that act as movable obstacles for the root trajectory (Fig. 2C). In this case, the complexity of the root-soil interaction results from the granular nature of the soil at the root scale and the interplay with the growth trajectory. Root penetration induces reorganizations of the particles which in turn modify the distribution of pores and the local soil packing fraction, and affect the further root growth that may reorient [25]. This leads to an interesting feedback between root path and soil particle reorganization which has only begun to be quantified [26, 27] or simulated [28]. Eventually, for the largest S values, the soil particles are much smaller than the root diameter and there is no pore of sufficient volume into which the root can enter. Thus the penetration of the root is associated to a displacement of particles around the root apex and to a compaction of the soil (Fig. 2D). When there is furthermore not much spatial variability in the particle mechanical properties, soil will be considered as homogeneous or “unstructured” and is usually modelled as a continuous medium in finite element analysis with different stress-strain relationships [29, 30].
Homogeneous soils
When there are no continuous pores of sufficiently large diameter, soils will be considered as a continuous medium with a given soil strength, as the root tip must exert a force to deform or break the soil. The common way to quantify the mechanical strength of these homogeneous soils (unstructured soils) is to use penetrometry measurements, which is currently the best method for estimating the mechanical resistance to root growth [31].
Most penetrometers consist of a metal probe with a conical tip attached to a cylindrical shaft [32]. The probe diameter ranges from about 0.1 mm for a small needle penetrometer to over 10 mm for a large field penetrometer but it is usually of the order of 1 mm, which is comparable to the diameter of numerous crop roots like maize or peas. A relieved shaft with a diameter less than that of the cone basis is often used for limiting friction and adhesion between the soil and the shaft. Ideally the probe should be pushed into the soil at a velocity comparable to the root growth velocity (1cm per day or equivalently around 10 microns per min) but for practical reasons, the probe penetration velocity is much faster, around 1 mm/min, and is typically between 50 and 600 times faster than the maximum rate of root extension. The force needed to push the penetrometer probe inside the soil at a constant velocity is measured and divided by the cross-sectional area of the penetrometer cone to obtain the soil strength. The range of soil strength obtained in this way is of the order of 1 MPa but depends highly on parameters like the soil bulk density and the moisture content. The increase in soil strength, also called “mechanical impedance”, results from the effects of both soil drying and soil compaction and sometimes it is difficult to decouple the two origins.
Soil compaction
The soil strength increases with soil bulk density. Agronomists usually refer to the dry soil bulk density, which is defined as the mass of dry soil divided by total soil volume. Soil strength increases with compaction, with soil bulk density ranging for example from 1.24 for loose soils to 1.38 for dense soils, up to 1.52 g/cm3 for very dense soils [30, 33]. The ability of soils to withstand compaction is affected by texture, clay mineral type, organic matter content and moisture content. The compaction of soils is due in part to external loads exerted by wheels under tractors or tillage machinery and by the trampling of animals [34]. Soil compaction might also result from climatic variations like heavy rainfalls that will impact soils and create a crust, or cycles of wetting/drying that modify the soil water content and promote the coalescence of soil aggregates [24].
The compaction of soil increases its average bulk density but also modifies the distribution of pore sizes. In particular, compaction decreases the number of coarser pores, alters the connectivity of the pore network and limits water uptake by roots [8]. This also limits solute transport, diffusion of
nutrients and gaseous exchanges (supply of oxygen and removal of carbon dioxide), which is detrimental for adequate soil aeration and for maintaining the soil microbiome activity and root growth.
Soil drying
While it is quite straightforward that soil compaction increases soil strength, another soil property, the water content, also strongly affects soil strength. The decrease of soil water content increases soil strength [6]. Consequently the observed mechanisms of root penetration will be completely different upon drying, the soil behavior varying from that of a brittle solid to that of a plastic-ductile material. Soils with low water content behave like brittle solids and can fracture under the compressive stress generated by the growing root as it advances through the soil [35]. On the other hand, soils with a high silty clay or organic content behave like plastics or liquids when they have a moderate water content: they will flow instead of crack when the compressive stress exerted by the root exceeds the yield stress of the soil. Depending on the water content, capillary bridges form between particles and induce tensile forces [36] that pull the aggregates toward each other and increase the typical size of soil heterogeneities. Water content on a percentage basis says little about the water available to plants because this depends on the soil nature and on the way water is distributed in the porous network. Soil scientists characterize the soil dryness using the soil matric potential (see Box 1) that represents the capillary and surface binding forces that affect water availability to plants [37]. The more negative the matric potential, the drier the soil, but the relationship is not linear and in relatively dry soils, a small decrease of water content strongly decreases the matric potential [38]. In many soils, a weak decrease of matric potential, keeping the water availability reasonable for the plants, induces a significant increase of the mechanical impedance. This leads to the conclusion that soil water deficit impacts root growth both by lowering the water availability and by increasing soil strength (see [6] for a review).
1.3. Effects of mechanical impedance on root growth and root system architecture a) Root elongation and morphology
In field [39, 40] as well in lab experiments with soil compacted in a core [41, 42] or with pressure cells [43], root elongation rate (RER, as improperly called by biologists since it is a velocity, mm h-1) varies inversely with soil strength. The measured soil strength depends on the tools and methods, leading to a large range of values and an apparent inconsistency. For instance maize RER was reduced by 50% for a penetrometer resistance ranging from 0.2 to 2 MPa depending on the study [41, 44, 45]. RER sensitivity to soil strength, that is the RER reduction relative to unconstrained state, seems to be species-specific. For instance, cotton and barley appeared to be more sensitive than pea and rice. A penetrometer resistance of 0.7-0.8 MPa decreased cotton and barley RER by 50%, while a resistance of 1 MPa decreased rice RER by 40%, and a resistance of 1.5 MPa decreased pea RER by 20% [41, 42, 44, 46, 47]. For all species, root elongation stops when soil strength becomes too high. According to Veen and Boone [45], in a wet soil, a maize root cannot overcome a penetration resistance of 4 MPa (extrapolated value) but it should be kept in mind that the resistance experienced by a root is 2.5 to 8 times lower than that measured by a penetrometer [6]. An important point is that RER reduction remains for a few days after removal of the stress, indicating that this change is not a simple mechanical effect but that acclimation through biological processes are involved in response to soil strength [46, 48-50] (see also part 2.1.c).
The reduction of RER is most often accompanied by an increase of the root diameter [39, 51, 52]. Root thickening concerns all root types (seminal, lateral, adventitious) and could be an advantage in terms of strong soil penetration (see part 2.2.c). Species with a higher root diameter, and those
showing a high increase in root diameter in response to strong soil are more efficient in penetrating strong layers [52, 53].
b) Root system architecture
While soil strength reduces RER of all root types, the elongation of lateral roots appears less sensitive to high soil strength than the primary roots of eucalyptus [54] or than the seminal roots of barley [55]. Main axes show higher diameter and elongation rate than secondary or tertiary roots. Thus, Thaler and Pages [56] suggested that higher sensitivity of the main axes to soil strength could be explained by higher frictions, which they supposed to be proportional to elongation rate. Or thinner roots might experience a weaker impedance because their diameter is more compatible with the size of the soil pores. In barley, an experience with ballotini (glass bead packings) of sufficient size to impede seminal roots but not laterals conducted to the doubling of the mean length of laterals [57]. This growth compensation by laterals was found in barley but not in wheat, highlighting species variability [55]. The reduction of main root axis elongation rate was sometimes accompanied by an increase in branching density [49, 56] but was not observed in other studies [55, 57]. This differential responsiveness of the root types to soil strength could lead to changes in root system architecture in response to uniform soil strength or hard pans. For instance, in the experiment mentioned above with barley in ballotini, the better development of lateral compared with seminal roots led to a denser superficial root system [57]. In a field with a compacted layer, the seminal roots of wheat explored the soil profile less efficiently [39]. Similarly, compaction reduced the final root depth of the pea root system more or less depending on cultivar but a high interaction between soil structure and climate impacting the depth of root system was highlighted [58]. Indeed, drought periods can produce vertical cracks that can be exploited by roots [40]. Soil strength, soil water potential and air-filled porosity interact and significantly affect root growth. Because all three are highly variable spatially and temporally in the field, it is difficult to predict root growth at the root system scale in situ [40].
2. Elementary mechanisms of root penetration inside soils
In the preceding part 1.3, we described the response of root growth and root system architecture to the mechanical impedance of soil or substrate. We now focus on model experiments aiming at explaining the elementary mechanisms of root penetration. Roots penetrate soil by growing and exerting axial and radial stresses (Fig. 6), which in the case of a homogeneous soil deforms it ahead of and around the root.
2.1. Root axial elongation as a motor for axial thrust in medium
We first deal with the mechanisms of axial pushing. The axial stress is called the growth pressure and is equal in magnitude to the pressure of the homogeneous soil, which opposes root growth [59]. The questions we address now are the determination of the maximum axial growth pressure of a root and its measurement.
a) Root growth pressure: measurements and range of values
Model experiments consist in measuring the axial force of a root against a force sensor (calibrated spring system, elastic beam, digital balance…). The first measurements of axial force generated by
growing roots were done by Pfeffer as earlier as 1893 [60] and reproduced long after by Gill et al. [61] and Souty [62], and more recently by using different techniques cited in Clark et al. [63].
Fig. 3 : Experimental setup of Pfeffer [60] to measure the axial root growth pressure. The force measurement is performed through the deflection of the two curved elastic plates (f).
In most experiments the principle for determining the maximum root growth pressure is the following: The root tip is encased in a block (like a ceramic cone permanently saturated with water or a plaster of Paris) connected to a spring sensor of large stiffness, while the upper part of the root is guided into a tube or maintained laterally in a plaster block (plaster of Paris, dental plaster). The two blocks are independent and separated by a small air gap allowing the root growth. The deflection of the spring induced by the pushing of the root is followed as a function of time and then converted into a force. The typical force versus time curve usually presents 3 stages. The first one encompasses the phase of contact between the root and the sensor and a time delay during which the growth is reduced or stopped for a few minutes to hours. This can be attributed to a thigmomorphic response, that is a reduction of growth due to contact/compression (see part 2.3) [5, 64]. The second stage is characterized by a monotonic increase of the force with time over a period on the order of a few hours to one day. The last stage is saturation, when the root is fully impeded and cannot grow anymore. This threshold gives the value of the maximum penetrative force FMax, which is an extensive value function
of the root size. In order to compare different species, a useful quantity is introduced, the maximum axial growth pressure 𝜎!"#, which is an intensive quantity defined by:
𝜎!"# = !!"#! = !!!!"#! ! (1)
where S is the root cross-sectional area and d the root diameter. Depending on the experiment, the diameter is determined once the root has been removed from the setup under a microscope, or in situ by visualizing the root part in the gap.
Since the pioneering work of Pfeffer, various experimental systems have been proposed to measure the axial force a root is able to exert. The reported values for axial pressures obtained with the setup
Fig. 3 of Pfeffer were originally between 0.7 and 2.5 MPa for the seedlings tested (Faba vulgaris, Zea mais and Vicia sativa). In the work of Misra et al. [65], the axial root growth pressures were 0.5 MPa for pea, 0.29 MPa for cotton and 0.24 MPa for sunflower. A more detailed review of 𝜎!"# values is given in Whalley et al. [66] and in Clark et al. [49]. Not surprisingly, the values for 𝜎!"# are always
of the order of the turgor pressure P, that is of the order of 0.1 - 1 MPa. We will come back to this later on.
In designing experimental systems for determining 𝜎!"#, some care should be taken about possible
artefacts. Limited diffusion of oxygen [67], inadequate water supply [6], or enhanced emission of ethylene [49] could be induced by the constraining material in which the upper part of the root or the root tip are maintained. In particular, ethylene might promote an increase in root diameter and a decrease in elongation rate, which will modify the value of 𝜎!"#.
Most measurements of 𝜎!"# reported in the literature have been for radicules of young
non-photosynthesizing seedlings a few days old. The effect of seedling age has been investigated recently by Azam et al. [68]. By comparing primary roots of peas (2 - 3 days old) with lateral roots of tree seedlings (3 - 4 months old), they observed that the root growth pressures were surprisingly similar in the range 0.15 - 0.25 MPa. Misra et al. [69] had already shown that lateral roots and main root axis of pea had similar 𝜎!"#.
Instead of pointing out the universality of the growth pressure values, most studies have focused on the slight differences observed in 𝜎!"# values. The reason is that if roots of some species or different cultivars are able to generate greater values of 𝜎!"#, they might better penetrate strong soils [53, 63], which would be a beneficial trait for selecting crops. For example, roots of dicotyledons (dicots) were observed to grow better in strong soil than those of monocotyledons (monocots). It has been suggested that this could be due to a greater value of 𝜎!"#. But Clark [70] showed by using a shear beam force transducer method, that this does not seem to be the case, as the mean value of 𝜎!"# for dicots (pea,
lupin, sunflower) is 0.41 MPa, while the one for monocots (wheat, maize, barley and rice) is 0.44 MPa. Even in single species, values of 𝜎!"# have been reported between 0.3 MPa and 1.3 MPa. Clark et al. [63] showed on pea seedlings that these differences mainly arise from measurement techniques rather than cultivars. They recommend experimental systems that allow root diameter to be measured in situ. Indeed when removed from the apparatus for observations under microscope, the root partially relaxes and its diameter shrinks, such that 𝜎!"# will be overestimated. On the other hand, the gradual
radial swelling that is observed for impeded roots (see part 2.2) could bias the determination of the root diameter, whose quadratic contribution in the formula (1) greatly modifies the value of 𝜎!"#. Indeed, the exact protocol for determining the diameter entering formula (1) (location on the root, time to reach this diameter, way of impeding the root tip, stiffness of the force sensor…) should be specified for comparison.
b) Cellular origins of the root growth pressure
Root pressure allowing the penetration of the root into the soil is generated by root growth. In this part, we recall the main features and simplified models of root growth at the cell and organ scales and how the presence of a mechanical impedance is included in these models.
Root growth is mainly due to the expansion of cells within the elongation zone (Fig. 1). Indeed cell proliferation is essential for growth (providing new cells to the elongation zone) but most of the volume increase is due to cell expansion [71]. According to Lockhart [72], the relative expansion rate of a single cell depends mainly on turgor pressure (see Box 1), cell wall properties and membrane hydraulic conductivity (see the review of Geitman and Ortega [73] for more details). The membrane hydraulic conductivity is reasonably assumed to not limit cell expansion, so cell wall properties are considered as the main rheostat of cell expansion and turgor pressure is its driving force. The relative elongation rate or strain rate, 𝜀, is thus given by (see Box 2):
𝜀 = 𝜙 ∙ 𝑃 − 𝑌 (2)
where P is cell turgor pressure and the parameters Y and ϕ denote cell wall properties that are actively regulated in response to environment. Y is a minimum threshold indicating that effective pressure must be high enough to allow cell wall extension and ϕ is the cell wall extensibility.
Understanding the biophysical control of root growth requires upscaling from cell to root. Along the root apex, 𝜀 shows a bell-shaped profile (Fig. 1C), varying greatly from a few percent up to 35%, but cell turgor pressure is uniform over the growth zone [74]. Thus, as cells are moved along the growth zone -pushed by the new cells produced by the meristem- 𝜀 variations must be controlled by changes in cell wall properties through changes of 𝜙 or Y. However the simplified Lockhart model still holds for the whole root (see Fig. 3 in [74] where the root growth velocity is observed to be an affine function of the turgor pressure), then the parameters Y and ϕ are averages of those of all cells or most probably of the fastest expanding cells along the root axis. In addition, in the radial direction, the root organ is made of concentric layers of different cell types that show different geometries and contribute differently to the mechanical properties of the root tissue. Indeed cell layers with extensible walls are connected to layers with less extensible walls. This generates compression and tension forces in addition to the local forces of turgor [75]. Using a multi-scale model built for the Arabidopsis thaliana root, Dyson et al. [76] showed that the epidermis has a more important influence on tissue-level growth parameters than other cell types and thus plays a predominant role in controlling root growth. This contradicts an older view where the internal tissues, inner cortex or endoderm, restrict root growth [74 and references theirin]. Different plant model and root anatomy may explain this discrepancy. The measured Y and ϕ of a root section should correspond to those of the tissue layer that limits growth, whatever the tissue layer is.
Cell expansion is strongly anisotropic, generating the cylindrical shape to the root. As the cell elongates mainly in the axial direction, wall extensibility must be much larger in the axial direction than in the circumferential one [77]. Anisotropic cell expansion is attributed to its mechanical construction, the deposition of stiff aligned cellulose microfibrils perpendicular to the main axis of growth [78, 79], such that the cell wall is considered as an anisotropic fiber-reinforced composite material. Early, it was suggested that both the direction and the degree of anisotropic expansion could be controlled through the direction and the degree of microfibril alignment [80]. However some other control mechanisms may also exist [78]. For example, some Arabidopsis mutants exhibit higher radial expansion in root cells although there is no difference in microfibril alignment compared with the wild type [81]. In roots grown under water deficit, cells are more anisotropic but again no difference was observed in microfibril alignment [82]. Baskin [78] suggested that expansion rates in length and width are regulated by independent mechanisms. The microfibril length could also be involved in controlling
the radial expansion rate. In addition, at the organ scale, anisotropic expansion of some cell types may be controlled by the anisotropic expansion of other cell types in inner tissues. More recent studies of Arabidopsis roots [83] support the idea that cellulose microfibrils are deposited transversely to accommodate longitudinal cell expansion but are reoriented during expansion to generate a cell wall that is fortified against strain from any direction [83]. The orientation of microfibrils, as well as the mechanisms of cell wall loosening, are still intense research areas, in particular in developmental biology for understanding the link between morphogenesis and forces in tissues [84].
To model the biomechanics of a root in a resisting soil, Greacen and Oh [85] modified the Lockhart model to take into account the soil resistance 𝜎. In the axial direction, the soil resistance acts against the effective pressure needed for axial growth and pushing, which results in a decay of the axial strain rate according to the equation:
𝜀 = 𝜙 ∙ 𝑃 − 𝑌 − 𝜎 (3)
In this equation, largely used by the community, the soil/root friction acting axially along the root flanks is omitted, assuming that this component is very small. Since the root-soil system is in equilibrium (quasi-static root growth), the axial force applied by the root equals the force opposed by the soil across the root cross-section. Thus the axial root growth pressure equals the soil resistance 𝜎. It should be emphasized that P, 𝜙 and Y are not constants, but are physiological properties that are actively regulated. They change with root environment and soil resistance 𝜎, as well as with the mechanical stress history of the root [86].
Box 1: The plant cell and its water potential
In contrast to animal cells, plant cells are surrounded by a rigid cell wall. In tissues, cell walls are cemented by a middle lamella, preventing cell migration. The outer boundary of each cell, the plasma membrane, separates the inside, called the cytoplasm, from the intercellular space called the apoplasm. The plasma membrane is selectively permeable: water and small uncharged solutes cross it more readily than large or charged solutes.
Fig. 4: Schematics of a plant cell. P is the turgor pressure acting isotropically.
Plant physiologists use the water potential, Ψ, defined as the chemical potential divided by the partial molar volume of water (free energy of water per unit volume) to quantify the water status. The water potential includes three components: = !+ !+ !.
The gravitational component Ψg depicts the potential energy due to gravity: ! = !g h, where ! is the density of water, g the acceleration due to gravity and h the height. When dealing with water transfer at the cell scale, Ψg can be neglected as compared to the two other components. Thus the cell water potential is = !+ !.
The osmotic potential ! equals the opposite of the osmotic pressure Π ( != −Π). It represents the interactions between dissolved solutes and water. The van’t Hoff equation provides an estimate of the osmotic pressure for diluted solutions: Π = 𝑅𝑇 𝐶!, where R is the gas constant, T the absolute
temperature and 𝐶! the sum of solute concentrations expressed in moles of osmotically active particles per cubic meter of water.
The hydrostatic potential !, also called turgor pressure (P), is the hydrostatic pressure above atmospheric pressure [87].
As long as there is an imbalance of water potentials between the inside (𝜓! for the cell cytoplasm) and the outside (𝜓! for the external solution, soil or apoplast (cell walls and extracellular spaces)), there will be a water flow against the gradient of water potential. Thermodynamic equilibration results in 𝜓! = 𝜓!. Most plant cells live in a hypotonic environment, so the osmotic gradient Π!− Π! > 0 tends to drive water into the cytoplasm until 𝜓! = 𝑃 − Π! = 𝜓! = −Π!. The cell wall prevents the cell from exploding and at equilibrium turgor pressure P balances the osmotic pressure gradient, i.e. 𝑃 = Π!− Π!. Turgor pressure depends on cell type, ranging from 0.5 MPa in root cells to 2 MPa in leaf epidermal cells.
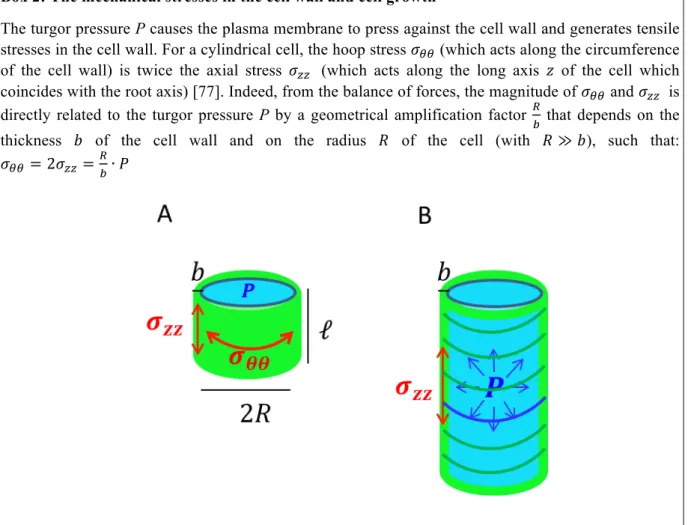
Box 2: The mechanical stresses in the cell wall and cell growth
The turgor pressure P causes the plasma membrane to press against the cell wall and generates tensile stresses in the cell wall. For a cylindrical cell, the hoop stress 𝜎!! (which acts along the circumference
of the cell wall) is twice the axial stress 𝜎!! (which acts along the long axis 𝑧 of the cell which
coincides with the root axis) [77]. Indeed, from the balance of forces, the magnitude of 𝜎!! and 𝜎!! is
directly related to the turgor pressure P by a geometrical amplification factor !
! that depends on the
thickness 𝑏 of the cell wall and on the radius 𝑅 of the cell (with 𝑅 ≫ 𝑏), such that: 𝜎!! = 2𝜎!!=!!∙ 𝑃
Fig. 5: (A) Schematic diagram of a plant cell represented as a cylindrical shell of radius R, length ℓ𝓁 and thickness b under internal pressure P. (B) Anisotropic growth of the cell when the axial stress in the cell wall exceeds the yield stress. The green circumferential curves represent the assumed orientation of the cellulose microfibrils in the cell wall for the simplest model of anisotropic growth.
These stresses induce strains in the cell wall (for the definition of stress and strain, see the review of Boudaoud [88]). The simplest rheological model (relationships between stress and strain) for the cell wall of a growing cell is a Bingham visco-plastic behavior, i.e. the cell wall deforms plastically above a yield stress 𝜎! with a plastic viscosity 𝜂!. Turgor pressure, the motor of expansion, is isotropic, but the cell walls are mechanically anisotropic (see the main text) and cells elongate mainly in the axial direction. Thus a cylindrical cell of length ℓ𝓁 will grow when the axial stress in the cell wall exceeds the axial yield stress and the corresponding axial strain rate 𝜀 (the relative variation of length ℓ𝓁 with time t) will be:
𝜀 =1 ℓ𝓁 𝑑ℓ𝓁 𝑑𝑡 = 𝜎!!− 𝜎! 𝜂!
In most papers, the strain rate of the cell is directly expressed as a function of the turgor pressure P and a pressure threshold Y. In the framework of the Bingham rheological model for the cell wall, 𝑌 is related to the yield stress 𝜎! in the cell wall by 𝑌 =!!
! 𝜎!, such that: 𝜀 =1 ℓ𝓁 𝑑ℓ𝓁 𝑑𝑡 = 𝑅 2𝑏∙ 𝑃 − 𝑌 𝜂!
which is simplified into:
𝜀 = 𝜙 ∙ 𝑃 − 𝑌 (2) where 𝜙 = !!∙!!
! is related to the irreversible axial wall extensibility and to the dimensions of the cell wall. The drawback of this concise formulation is that Y seems to play the same role as the isotropic turgor pressure P. Yet, Y is related to the cell wall yield stress 𝜎! along the axial direction, but the
directional information is hidden in the scalar equation (2).
c) What happens in response to strong soil?
In a strong soil, a root is completely impeded when the growth stops. According to equation (3), the condition 𝜀 = 0 gives an expression for the maximum axial growth pressure:
𝜎!"#= 𝑃 − 𝑌 (4)
Thus the turgor pressure P at the cell level gives the right order of magnitude of the maximum growth pressure 𝜎!"# a root is able to exert in a soil.
When the root is partly impeded in a resisting soil (equation (3)), the root continues to grow (𝜀 > 0) if 𝑃 − 𝑌 − 𝜎 remains positive. Increase in P or decrease in Y thus favor growth maintenance. There are several indirect or direct data showing that P increases in growing cells in response to impedance. Greacen and Oh [85] and Atwell [51] found an increase of the cell osmotic pressure in impeded roots. In these experiments, if the soil water potential was not affected by the impedance (𝜓! = 𝐶𝑡𝑒 - see
Box 1 for notations), the increased cell osmotic pressure (Π! ↗) suggests an increase in turgor pressure
(𝑃 ↗) such that the water potentials remain at equilibrium (𝜓! = 𝑃 − Π! = 𝜓!= 𝐶𝑡𝑒). This
osmoregulation, that could be achieved through cell internal metabolism or solute import, was interpreted as a consequence of the imbalance between phloem unloading (phloem is the tissue that conducts and delivers the solutes produced by aerial parts of the plants to the consuming sites) and reduced growth [51]. Osmotic pressure Π! does not increase indefinitely in long lasting experiments,
meaning that there are feedback regulations. Direct measurements of P in either completely or partially impeded pea roots confirmed the increase in cell turgor pressure in some cases [59, 89]. By contrast Atwell and Newsome [90] and Croser et al. [91] found no change in turgor pressure in impeded lupin and pea roots as compared to unimpeded roots. In these studies, cell turgor was measured on excavated roots and a relaxation of P after removal from the impeding soil cannot be ruled out. However it seems improbable since, in Clark et al’s experiment [59], P remained constant for more than one hour after removal from the constraining ceramic block. Measurements of vacuolar osmotic pressure Π! and turgor pressure P have shown that the water potential 𝜓! of expanding cells
was about 0.15 MPa lower in impeded roots compared to unimpeded roots. Assuming that P did not relax, this suggests that the apoplastic water potential 𝜓! was lowered (see Box 1)and that the osmotic
pressure of the apoplast Π! was increased in impeded roots [91]. This supports the above mentioned
hypothesis of imbalance between phloem unloading and solute retrieval by cells leading to an accumulation of solutes in the apoplast. All in all, P is either not affected or is increased by mechanical stress and thus is not involved in the growth reduction of impeded roots.
Following mechanical stress removal, cell osmotic pressure in the elongation zone of previously impeded roots returned to the control level in less than 12 hours [86]. Meanwhile growth rate required two to three days to recover [48, 50, 91]. If we consider that cell water relations were rapidly restored (return of the cell turgor pressure to the unimpeded state), this means that the cell wall mechanical
properties of elongating cells were durably affected. Focusing on the dynamics of root elongation rate following application (respectively removal) of mechanical stress, Bengough and McKenzie [92] highlighted a response in two steps: (i) a fast change occurring within 30 minutes that could be attributed to changes in effective turgor (so changes in P and/or Y) (ii) a slower and longer change that led to a new steady state of reduced (respectively increased) growth rate (after 15h). Rapid changes of cell wall properties were also shown in response to changes in water availability and were attributed to rapid changes of Y [93]. As seen before, P does not decrease in response to prolonged mechanical stress, thus the second phase of response can be attributed to further stiffening of the cell walls and/or effect of reduced proliferation rate (see below).
Kinematic analysis of durably impeded growth of roots showed that the growth rate reduction was due to a lower strain rate along the root and a shorter growth zone [46]. Cell length profiles established at 0, 24h and 48h after stress retrieval showed that the mature cell length was reduced under stress but gradually recovered and almost reached the length of the unimpeded level after 2 days [91]. This time lapse could correspond to the time necessary to fully renew the cells in the elongation zone and transition zone. The time a cell spends in the different zones along the root apex can be estimated by tracing its trajectory [12, 94]. Croser and co-workers [91] calculated that a cell needs 20h to cross the elongating zone of the unimpeded pea root. In poplar roots with a 10 mm-long growing zone, a cell needed 47h to cross the entire growing zone but spent 38h in the first two millimeters that include the apical meristem and transition zone [95]. The very low strain rate in this location makes the calculation of the time spent in it relatively inaccurate. In any case, the consistency between the time to renew cells in the transition and elongation zones and the time for the RER to recover after stress removal suggests that the potentiality of elongation of a cell could be acquired in this basal part of the meristem and is relatively independent of the environment during the fast expansion. This is in agreement with the idea that cells in the transition zone (Box 1) are quite sensitive to environment and receive their “growth fate” there [96].
A shorter elongation zone can be the direct consequence of shorter mature cells but also of a reduced cell production rate by the meristem, providing fewer cells to the elongation zone [71]. Coordination between changes of strain rate in the elongation zone and cell production rate has often been found. The meristematic cell production rate, that is also the cell flux in purely elongating zone, was decreased in impeded pea root [46]. Other studies also implied that the cell production rate was reduced by mechanical stress as nicely shown by Croser et al. [46]. Discrepancies with this tendency may come from an insufficient exposition time to stress and/or an insufficient level of stress. A lower cell production rate could be due to a longer cell cycle duration (due to lower cytosolic growth rate) and/or to less dividing cells (shorter meristem) [97]. Growth kinematics with sufficient accuracy within the meristem and longer experiments are required to better understand the response of proliferation to mechanical impedance.
d) How maximizing the thrust efficiency?
In the last section, we related the maximum growth pressure at the root level to the turgor pressure at the cell level through 𝜎!"# = 𝑃 − 𝑌 by assuming there is no root/soil friction. However the thrust
force (or pushing force) exerted by the growing part of the root to force its way has to overcome the soil resistance as well as the lateral friction due to the contact with the soil (Fig. 6). The friction involved here in the balance of forces is the one acting on the flanks of the root along the elongation and meristematic zones, where there is a differential motion between the root and the soil. In the following, we will briefly overview the works related to the contribution of the root/soil friction in the mechanisms of root penetration.
Fig.6: The red arrows represent the vertical forces (left panel) and corresponding stresses (right panel) exerted by the soil on the growing zone of the root apex aligned with the vertical z. The green arrows represent the lateral confinement along the radial axis r that might increase along the vertical due to the increase of the soil pressure with depth. The gradient of blue color indicates the location of the root growing zone and the dotted line delimits the elongation zone from the maturation zone, where there is no more motion of the root relative to the soil.
According to Bengough and McKenzie [86, 98], the resistances encountered by a root pushed into compacted soil cores were 2.5 times smaller than the ones encountered by a sharp penetrometer at the same rate of penetration (2 mm.min-1), suggesting that less friction was experienced by the pushed roots. In addition, the resistances of growing roots were even smaller due to a combination of a smaller frictional resistance and a slower rate of penetration, as root growth velocity is of the order of 1 mm.h-1. McKenzie et al. [31] completed these works by using rotating penetrometer probe of similar dimension and rate penetration as for roots. By assuming a half-spheroid shape for the root tip, they inferred that the root-soil friction coefficient was 𝜇 = 0.21 − 0.26 , which is small but not negligible. The root cap is known to improve root penetration due to its tapering shape but also by the exudation of slimy mucilage (a polymeric gel) and the sloughing of the root cap border cells [17] that both line the root channel and contribute to limit soil/root frictions [86, 99]. Experiments compared the penetration of intact roots of maize with that of decapped ones [99]. When the root cap was removed, the elongation rate was about half that of intact roots and the diameter was 30% larger whilst growing in compact soils. The pushing force exerted by these roots was measured independently by placing the soil cores above a digital balance. The corresponding root penetration resistances were 0.31 MPa for intact roots and 0.52 MPa for decapped ones, suggesting that the growing decapped roots have to overcome a higher component of soil friction. Thus the mucilage and the release of border cells issued from the root cap are often viewed as a “lubricant” of the root-soil interface [100].
However the mechanisms underlying the improvement of root penetration by mucilages or other root exudates are still open questions [101]. The nature of the sheared zone at the root-soil interface might
change from a homogeneous solid to a granular heterogeneous medium, to a viscous liquid, or even to a more complex fluid, depending on the presence of mucilage and its degree of hydration [102]. Usually the frictional terms acting against the penetration of probes inside soils are measured by means of a penetrometer and interpreted as a solid-solid friction, i.e. it is assumed a Coulomb criterium that linearly relates the shear stress 𝜏 to the normal stress 𝜎!! at the interface by means of the soil-probe friction coefficient 𝜇 (see Fig. 6 for notation of stresses):
𝜏 = 𝜎!"(𝑧) = 𝜇𝜎!!(𝑧) (5)
Possibly a modified Coulomb criterium can be used to take into account the cohesion (𝑐) due for example to the soil water suction exerted by capillary bridges at the soil particle-probe interface [36], i.e. 𝜏 = 𝜎!" 𝑧 = 𝜇𝜎!! 𝑧 + 𝑐.
The case of root penetration is however more complex. The released cells with the mucilage form a liquid and viscous boundary layer between the root and the soil [99] that modifies the mechanical and wetting properties of the narrow zone of soil immediately surrounding the roots [99]. Read et al. [103, 104] measured the surface tension and viscosity of mucilage collected from maize and lupin root seedlings grown on filter papers with different moisture content. In particular, they found that mucilage contains phospholipid surfactants that lower the surface tension (minimum value of 48 mN.m-1 for filtered and concentrated mucilage) compared with that of pure water (72 mN.m-1). Other studies have shown that after drying, mucilage becomes hydrophobic and limits the rewetting of the root-soil interface [105]. In any cases, mucilage modifies the wetting properties of the root-soil interface compared with the bulk soil. This might affect the way soil particles near the root apex are bound together by capillary bridges and therefore modify the typical size of soil aggregates along the root path, hence the root trajectory itself (see part 1.2). Moreover oscillatory rheological measurements have shown that the mucilage of axenic maize with its border cells behaves at low frequency (lower than 1 Hz) like a weak visco-elastic gel [106]. The authors suggest that due to this elastic contribution at the low shear rates, the movement of the root through the soil will draw soil particles in contact with the mucilage towards the root surface and help maintaining the root-soil contact,.
A second feature that can improve straight penetration of roots is the firm holding of the non-growing part of the root inside soil. A large lateral confinement by the soil will help maintaining the root mature zone static while the root tip is growing. Indeed the confinement might provide a proportionally greater axial resisting force. However a rough estimation of the solid-solid friction force that might be involved at the root mature zone-soil interface indicates that its value for short emerging radicle is relatively low compared with the reaction force exerted by the growing zone. Then the anchorage of the seedling provided by the soil lateral confining pressure is too weak for small depths (see Box 3 for calculations of order of magnitudes).
Indeed a far more efficient anchorage for young seedlings is produced by the presence of root hairs in the root mature zone. In the work of Bengough et al. [107], hairless maize mutants were compared with their wild-type counterparts with hairs. The root tip anchorage was higher in the presence of root hairs and enabled better soil penetration. In particular the depth of penetration was larger for wild–type roots and the length of the root pushed-up above the soil surface was greater for the hairless mutant in the case of the loosest soils. Accordingly the pull-out forces required for extracting the roots of soil were larger for hairy roots than for hairless roots, the force being 13 times larger in the case of the loosest soils. Then the disrupted region of soil during pull-out was greater for hairy roots. In particular this region had a larger lateral extent radially away from the hairy roots with soil motions observed at up to four times the root radius, whereas the hairless mutant hardly disturbed the surrounding soil.
Box 3: Speculative estimation of the friction forces at the root-soil interface
The growing zone of a root exerts an upward reaction force (vertical red arrow in Fig. 7) on the non-growing zone. We take the case of a young seedling root with no laterals, the seed being just located at the top surface of the soil. The resisting forces acting against the up-lifting of the root are the weights of the root and aerial part (downward vertical black arrows) and the static friction forces at the non-growing part of the root-soil interface (orange arrows). These downward friction forces arise due to the upward force produced by the root’s growing zone in the impeding soil. The confinement due to the lateral stress 𝜎!!(𝑧) acting on the flanks of the root determines the amplitude of the friction force
along the mature zone of the root. Thus the maximum friction force 𝐹!"#$%#&'!"# before sliding, hence up-lifting, can be computed.
Fig.7: Schematic diagram of the forces resisting to the up-lifting of the root outside the soil due to growth in the constraining soil. The seedling is artificially decomposed into a growing part (bottom part) and a non-growing part (upper part) over which the balance of forces is made. The root axis z is aligned with gravity. The seed is just lying on the soil surface at z=0 and the non-growing part of the root is buried till the depth z=h.
For this calculation we don’t take into account root hairs, mucilage or root cap cells that might modify the soil frictional properties at the root-soil interface. Thus we assume that the frictional stresses 𝜎!" are purely interfacial and related to the lateral confining stresses 𝜎!! by means of the usual Coulomb law (without any cohesion), that is 𝜎!"!"#= 𝜇𝜎
!!, where 𝜇 is the static coefficient of
root-soil friction. The lateral confinement is itself related to the local vertical stress 𝜎!!(𝑧) that increases with depth z, i.e. 𝜎!"!"# 𝑧 = 𝜇𝜎
!! 𝑧 = 𝜇𝐾𝜎!! 𝑟 = 𝜇𝐾𝜌!𝑔𝑧 with 𝐾 the lateral earth coefficient,
𝜌! the density of the soil and 𝑔 the acceleration of gravity. The corresponding friction force integrated over the length h of the non-growing part of the root inserted in soil will be 𝐹!"#$%#&'!"# = 𝜋!!
! 𝜇𝐾𝜌!𝑔ℎ!.
A crude estimation by using 𝑑!= 1 mm, 𝜌!=2000 kg.m-3, 𝜇 =0.3 [31] and 𝐾 ≈ 1 gives a maximum
friction force of 𝐹!"#$%#&'!"# ≈ 0.1 N for a vertical anchored root length of h =10 cm. As a comparison, the root weight over the same length will be 𝑊!= 𝜌!𝑔ℎ𝜋!!
!
𝑊!≈ 10!!𝑁 for 𝜌!≈ 1000 kg.m-3. The seed weight will be 𝑊!""# = 𝜌!""#𝑔𝜋!!""#
!
! , that is
𝑊!""# ≈ 10!!𝑁 for a seed diameter 𝑑!""# up to ten times larger than the root diameter and a seed
density 𝜌!""# of the order of the root density. Thus in this case of a root having already the length h with the seed at the soil surface (which is the case of the experiment of [107]), the friction force is the main resisting force contributing to the stabilization of the root against the pushing-up force 𝐹!"#!. By
taking 𝐹!"#! ≈ 𝜎!"#×!!!
!
! with 𝜎!"# = 𝑃 − 𝑌 ≈ 0.1 MPa, the maximum growth pressure defined in
part 2.1.a, we obtain 𝐹!"#! ≈ 0.1 𝑁. This is the same order of magnitude as the maximal friction force due to anchorage along 10 cm depth. Alternatively these rough estimations provide a critical length of anchoring above which the root is stabilized against uplifting. Then according to these calculations, the root has to be sufficiently anchored, such that the length of the non-growing zone extends until a depth greater than ℎ!"# . In this way, 𝐹!"#$%#&'!"# = 𝜋!!!𝜇𝐾𝜌!𝑔ℎ!"#! is sufficient to overcome the up-lift
force 𝐹!!"!. By taking 𝜎!"#≈ 𝑃 in the expression of 𝐹!"#!, this gives ℎ!"# = !!!
!!"!!! and we recover ℎ!"#≈ 0.1 m = 10 cm for a root’s diameter of 𝑑!= 1 mm. More generally we obtain that the critical length of anchoring ℎ!"# increases as the square root 𝑑! of the root’s diameter when the root-soil friction is purely interfacial and for the geometry described in [107]. Note that the scaling is different for emerging radicles initiated from a seed sowed at a given depth, then the yield stress and pressure of the soil above the seed has to be taken into account. And as gardeners say, the seed has to be sowed at a depth more or less equal to its diameter.
2.2. Radial thickening of the root a) Macroscopic observations
Mechanical impedance commonly causes roots to become thicker [108]. The magnitude of the swelling for seminal roots of different plant species (dicots and monocots) has been observed to be smaller in field studies than in laboratory studies [53], probably because roots exploit the small scale variations in soil strength which exist in the field. Materechera et al. [53] observed that the roots which had higher thickening also had a higher percentage of penetration into the compacted subsoil below a tilled (non-compact) layer in a field study.
The thickening of the root seems to be localized near the apex in the expanding tissues [109]. This is clearly visible in the model experiment of Kuzeja et al. [110] where a computerized feedback-controlled device allowed applying a constant force at the root tip of a maize seedling. The recorded time-lapse images showed that the radial swelling was localized at about 3 mm behind the root cap for a root diameter of the order of 500 microns. Therefore it is probable that in model experiments and for large impedance, the radial thickening occurs in localized zones at a distance from the root tip, probably in the zone of rapid elongation where the volume increase of cells is the largest one.
b) Cellular observations of the root thickening
Radial thickening of the root can be due either to an increase of the number of cell layers or to an increase in cell diameter. A deep anatomical study focused on the changes induced by impedance on the size, shape and number of cells within the different tissue layers and along the barley root [108]. As already seen by Barley in maize [111], the number of cells in the stele and the cortex was slightly increased, due probably to more periclinal divisions in the apical meristem (divisions tangential to the root cylinder, generating more cell layers). However most of the increase in root diameter could be
attributed to the cell swelling in the outer cortex layers. Similarly, the increase of pea root diameter in response to impedance was mainly due to the swelling of cortex cells rather than to the increase in the number of cortical cell layers [46].
Cell maturation implies no more large changes of cell shape. Cell swelling should thus occur during expansion. Indeed, the diameter increase concerns the root section that has been rapidly expanding under impedance. For instance the root swelling was observed to extend over 5 mm in the elongation zone in the 6h hour experiment of Kuzeja et al. [110] and over 30 mm in the 7 day-long experiment of Wilson et al. [108], which length includes the elongation zone and some mature zone. It appears also that the swelling zone gets closer to the root tip as the root remains longer under stress, which is consistent with the shortening of the meristem.
In optimal conditions growth anisotropy of cells is controlled through the deposition of aligned cellulose microfibrils perpendicular to the main axis [77]. Experiments on pea root growing in a compacted soil layer before entering a loose soil layer showed that root diameter recovered to control level as soon as the root grew in the loose layer, whereas the root elongation rate remained reduced for several days [48]. This supports the idea suggested by Baskin [78] and mentioned before that the control of radial cell expansion (swelling) is different from that controlling expansion along the main axis.
c) Does root thickening optimize penetration?
Several hypotheses presenting the increase in root diameter as a mechanical advantage for root penetration into strong soils were raised up [112]. First, in an homogeneous soil considered as an elasto-plastic medium, finite-element analyses have shown that a radial increase of the root will relieve axial stress ahead of the root tip [113-115]. This mechanism which reduces the axial resisting pressure of the soil helps the root to continue to grow straight along its axis. The same mechanism also explains a possible tensile failure of the soil ahead of the tip and the creation of a crack in which the root tip could engage. In the case of gel substrates, root swelling will help opening and propagation of cracks in front of the root tip, in a way analogous to the burrowing of earthworms in muddy sediments [116], except for the peristaltic wave progression. In the work of Abdalla et al. [113], the same mechanism has been proposed for granular soils, although the calculations are initially based on the assumption of a continuous medium. Indeed, in a granular soil, this root diameter enlargement will open pores between grains and will facilitate the root entering into the gap. In all these cases, root thickening might induce soil cracks ahead of the root tip and/or release of pressure on the root tip, thus facilitating cell elongation and root growth [43, 113]. The cycle of reduced axial elongation, thickening near the root tip, relief of the axial stress, further root elongation, is repeated every time the root tip experiences a zone of larger impedance and the root proceeds to grow with a thickened section. The root cap being suspected to sense obstacles [50, 64], the release of pressure on the root cap could also limit the thigmomorphism response.
Another reason explaining the advantage of radial expansion for root’s straight penetration is the better resistance of thicker roots to bending and buckling. Thus thick roots are supposed to penetrate hard layers more easily [117, 118]. For heterogeneous soil structures, buckling of the root can occur when the root tip is located at interfaces between pores and solid regions but also at interfaces between solid regions of different strengths [40]. Determining the buckling threshold is essential for knowing whether the root will penetrate further or being deflected in the case of hardly deformable soils. From a mechanical point of view, buckling is an elastic instability, i.e. a passive mechanism, producing a deflection of the root above a critical compression force acting along the longitudinal axis of the root.