Publisher’s version / Version de l'éditeur:
Vous avez des questions? Nous pouvons vous aider. Pour communiquer directement avec un auteur, consultez la première page de la revue dans laquelle son article a été publié afin de trouver ses coordonnées. Si vous n’arrivez pas à les repérer, communiquez avec nous à PublicationsArchive-ArchivesPublications@nrc-cnrc.gc.ca.
Questions? Contact the NRC Publications Archive team at
PublicationsArchive-ArchivesPublications@nrc-cnrc.gc.ca. If you wish to email the authors directly, please see the first page of the publication for their contact information.
https://publications-cnrc.canada.ca/fra/droits
L’accès à ce site Web et l’utilisation de son contenu sont assujettis aux conditions présentées dans le site LISEZ CES CONDITIONS ATTENTIVEMENT AVANT D’UTILISER CE SITE WEB.
Proceedings, Division of Building Research, National Research Council Canada, 10, p. 226, 1985-10
READ THESE TERMS AND CONDITIONS CAREFULLY BEFORE USING THIS WEBSITE.
https://nrc-publications.canada.ca/eng/copyright
NRC Publications Archive Record / Notice des Archives des publications du CNRC :
https://nrc-publications.canada.ca/eng/view/object/?id=b38281f0-41d5-4a10-9443-2b9c66191520 https://publications-cnrc.canada.ca/fra/voir/objet/?id=b38281f0-41d5-4a10-9443-2b9c66191520
NRC Publications Archive
Archives des publications du CNRC
Access and use of this website and the material on it are subject to the Terms and Conditions set forth at Energy-efficient office buildings: report of Canadian case studies: proceedings of a symposium
ENERGY-EFFICIENT OFFICE BUILDINGS: REPORT OF CANADIAN CASE STUDIES
Proceedings of a symposium sponsored by the Division of Building Research
September 13-14, 1983 Ottawa, Ontario
A.H. Elmahdy, Project Authority Building Services Section
Division of Building Research
NRCC 24499
Proceedings No. 10 Ottawa, October 1985 Price $16.00
Preface
Overview and Summary by A.H. Elmahdy
The Marsland Centre, Waterloo, Ont. by Bernard D. Deuchars
The Revenue Building, Ste. Foy, Que. by Christian R. Roy
The E.I. Wood Building, Swift Current, Sask. by Jeff Osborne
The Bell Canada Administrative Building, London, Ont. by Peter J. Golem
The Joseph Shepard Building, Toronto, Ont. by Alan Kobayashi
The Red Deer Provincial Building, Red Deer, Alta. by Reg Monteyne
The Public Works Canada Building, London, Ont. by Brian O'Donnell
Summary of the General Discussion and Comments on the Rapporteur's Presentation
Questions and Answers on Individual Office Buildings - The Marsland Centre
The Revenue Building The E.I. Wood Building
The Bell Canada Administrative Building The Joseph Shepard Building
The Red Deer Provincial Building The Public Works Canada Building
Page iii 1 15 41 101 129 145 159 181 197 208 212 214 215 217 220 222
PREFACE
Interest in reducing energy consumption in buildings has increased dramatically in the last decade. In Canada there have been initiatives to improve the thermal performance of houses, to convert from oil heating to other sources and to improve the energy performance of government
buildings.
The Division of Building Research of the National Research Council of Canada undertook work to establish the energy-saving potential of office
(and other type) buildings and to identify ways of achieving good energy performance. As a first step, energy use data for office, school, shopping centre and apartment buildings were gathered and analyzed. The results were characterized by a four to one or greater spread between the unit energy consumption of the worst and best performers. Although the reasons were not apparent, the spread suggested a considerable potential for energy savings.
Following this lead, DBR initiated contracts for studies to analyze, assess and document the energy performance and energy-conserving features
(both physical and operational) of office buildings with much below average energy consumption. The results of those studies of seven relatively new buildings across Canada have been documented in detailed reports available through the Canada Institute for Scientific and Technical Information (CISTI).
To enable further dissemination of this information, the contractors were asked to present their results at a DBR-sponsored symposium in Ottawa in September 1983. This volume contains the papers presented at the
symposium along with an edited version of the discussion. The papers are preceded by a brief overview and summary of the results by Dr. A.H. Elmahdy, who initiated the project and acted as project authority throughout.
I wonld like to acknowledge the efforts of Dr. Elmahdy in this regard, and to thank him for allowing me the pleasure of chairing the symposium.
R.C. Biggs Head
Building Services Section Division of Building Research
ENERGY-EFFICIENT OFFICE BUILDINGS OVERVIEW AND SUMMARY
by A.H. Elmahdy
Division of Building Research National Research Council of Canada
2
-ENERGY-EFFICIENT OFFICE BUILDINGS: CANADIAN CASE STUDIES by
A.H. Elmahdy
INTRODUCTION
Since the energy crisis of the early 1970's, extensive efforts have been devoted to search for ways and means to conserve energy in all building sectors, particularly commercial, institutional and residential buildings. Several conservation measures have been developed, aimed at reducing the total energy consumption in office buildings. These include improved systems and building designs as well as more energy-conscious operating procedures. Implementation of these conservation measures has resulted in a considerable reduction in the annual energy consumption of office
buildings. By the early 1980's, about twelve percent of the total energy consumption in Canada was used in commercial and public buildings (1).
The Division of Building Research (DBR) of the National Research Council of Canada contributed to the technology transfer process by sponsoring a study to analyze and document the energy performance and conservation features of a group of low-energy office buildings. Seven consulting engineering firms were to each study a different low-energy office building, chosen according to predetermined bUilding selection criteria. After the studies were completed, the analysts presented their findings at a two-day workshop, "Energy-Efficient Office Buildings", held in Ottawa in September 1983. Sponsored and organized by DBR, the workshop was attended by consulting engineers as well as representatives from various federal and provincial government departments.
This paper constitutes a part of the workshop proceedings which contain the seven papers presented by the consultants who participated in the study. Also included in the proceedings are summaries of the discussion that
followed each presentation, and a summary of the general discussion at the end of the workshop.
Following the presentation of the seven case studies, this author (also the session's rapporteur) summarized the main results of the contract
reports, in addition to some of the major issues raised in the analysis and during the discussion periods. The purpose of this paper is to introduce the workshop proceedings, provide more background on the study, and
summarize the main issues of concern to building and system designers, and building energy performance analysts.
ENERGY CONSUMPTION OF OFFICE BUILDINGS
Recent surveys showed that actual purchased energy consumption of office buildings in Canada varied between 1000 and 4000 MJ/m2.yr (2,3)
(Figure 1). Remarkable changes in energy consumption of office buildings occurred during the last three decades. Between 1950 and 1973, the average energy consumption in U.S. office buildings was rising and reached about
by Lawrence Berkeley Laboratory (LBL) (4). The study concluded that increasing consumption was due to the popularity of glass facades, very extensive area lighting (up to 65 W/m2), and the use of oversized and inefficient heating, ventilating and air-conditioning (HVAC) systems.
This trend was reversed in the mid-seventies after the introduction of the voluntary ASHRAE Standard 90-75, which recommended a maximum energy budget of 2780 MJ/m2.yr in resource energy. Also, following the energy crisis, conservation programs started to have a substantial influence on annual energy consumption. Figure 2 shows the trends in resource energy consumption in U.S. and Swedish office buildings, in addition to cases of individual energy-efficient office buildings in Canada, the United States and Sweden. The point marked "LCC" in Figure 2 is the estimated
life-cycle-cost minimum using 1980 technology, emphasizing the use of daylighting and thermal storage.
The term "resource energy" will be defined and discussed in the following section.
CANADIAN CASE STUDIES
The seven consulting engineering firms selected were asked to carry out their studies according to specified terms of reference. Each firm had to select a building with which it had no association during the design,
construction or post-construction phases. To be selected, a building had to satisfy the following criteria:
Floor area (gross): 10 000 m2 or more Age: built after 1970
Height: 4 stories or more
Occupancy: office-type building with 95 to 100 percent occupancy during the years 1981 and 1982.
Recorded energy consumption: 1000 MJ/m2.yr or less purchased energy based on working space area for the years 1981 and 1982.
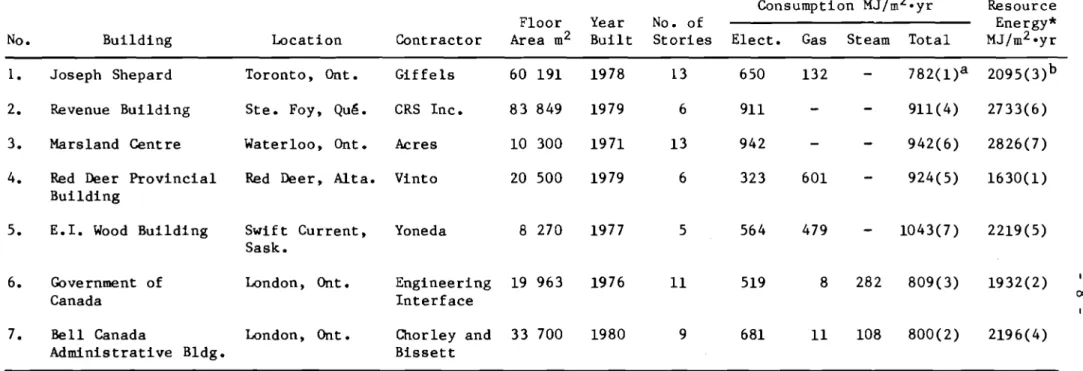
Table 1 gives pertinent information on each building along with the 1982 actual energy consumption, both site (purchased) and resource. The table also shows that all seven buildings satisfied the selection criteria with the exception of the E.I. Wood building, whose purchased energy
consumption is about 4% higher than the target of 1000 MJ/m2·yr and whose gross floor area is about 17 percent lower than the minimum requirement of
10 000 m2• The building was included, however, in order to ensure a fairly representative national sample.
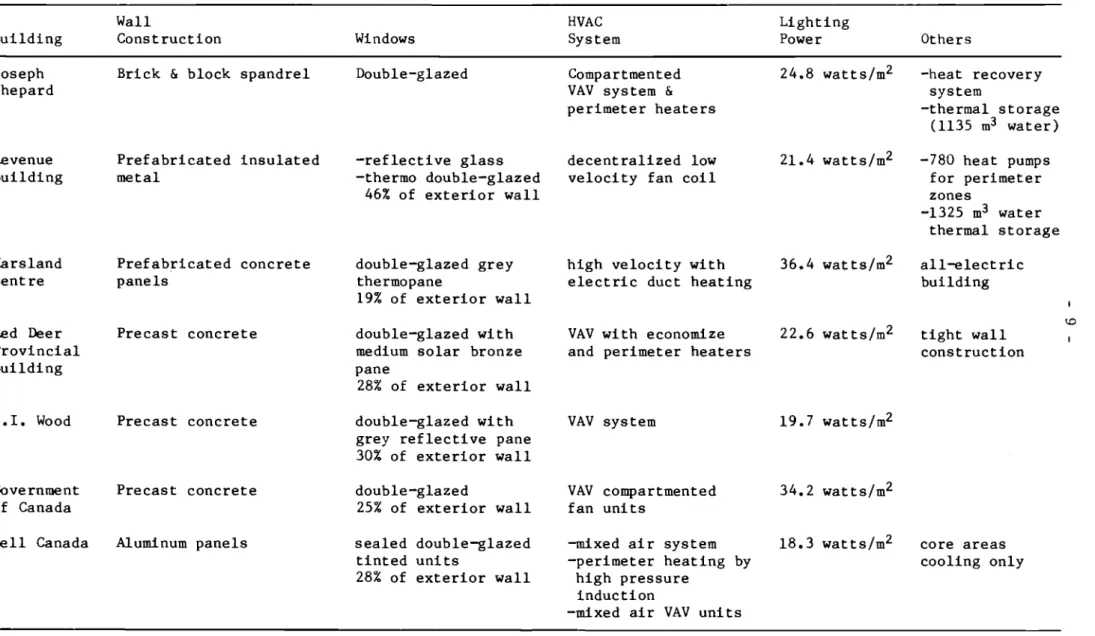
Table 2 summarizes the main design features of the buildings. More details are given in the following individual papers and in the contract reports (5) available from the Canada Institute for Scientific and Technical Information.
4
-SUMMARY OF RESULTS AND DISCUSSION
The breakdown of energy use in the seven buildings is shown in Table 3. The equipment load as a percentage of full load in the Revenue and Bell Canada buildings is very high compared to other buildings because of the extensive use of computers and office equipment.
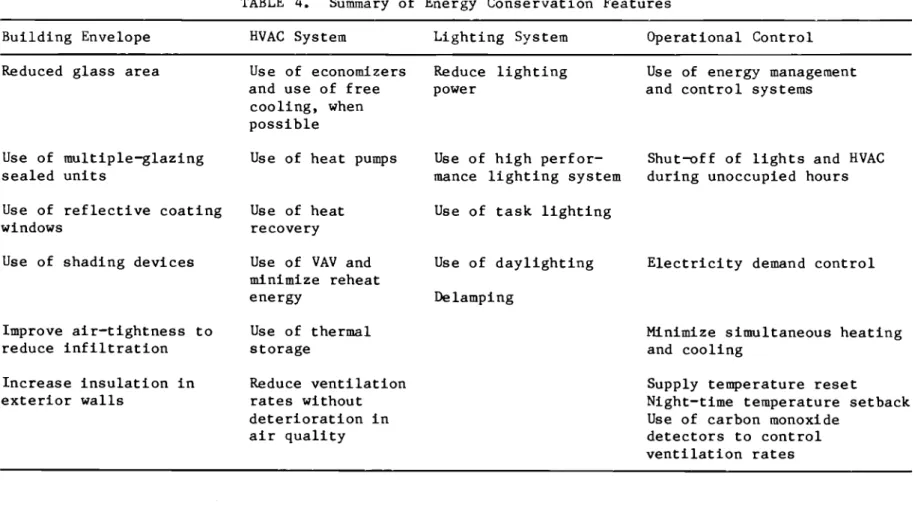
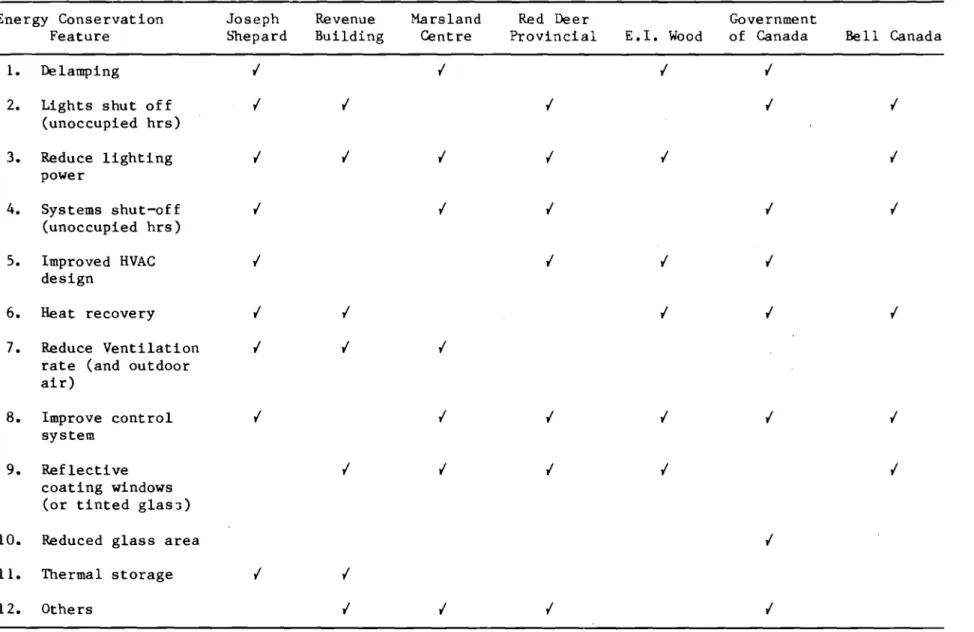
All seven buildings have implemented various energy conservation measures. These features are related to four major areas: building envelope, HVAC system, lighting system, and operating procedures and controls (Table 4). Specific energy conservation features implemented in each building are shown in Table 5.
Improvements in HVAC system design and control strategies have
contributed to the overall energy savings in office buildings. Heat pumps and heat recovery systems have been integrated with conventional HVAC
systems, and compartmented variable air volume (VAV) units have replaced the single large VAV system in IllUlti-storey office buildings. In addition, use of energy management and control systems (EMCS), either in a simple form or in a sophisticated configuration, has had a noticeable impact on energy consumption.
In the lighting area, delamping and the substitution of lower-wattage tubes have been the most effective energy-saving measure. The conventional lighting load of 50 W/m2 or more has been reduced to between 18 and 36 W/m2• The analyses have shown that improved lighting systems and the shut-off of lights during unoccupied hours accounted for about 40 to 60 percent of the overall energy savings. The second major energy-saving measure has been the reduced air circulation rates and HVAC system shut-off during unoccupied hours. This has accounted for about 25 percent of the overall energy
savings. Other features such as heat recovery systems, reflective glazing, night temperature setback, free cooling and tightening of the building envelope have accounted for the remainder of the estimated energy savings.
The energy consumption of office buildings has been expressed in terms of "purchased (site)" energy and "resource" energy. The former represents the energy delivered to the building boundary, whereas the latter is
intended to account for some conversion and transmission losses that occur before delivery to the building.
The purpose of using the resource energy in the assessment of the energy performance of buildings is to allow an equitable comparison to be made between buildings where various sources of energy are used. For example, electrically heated buildings may consume the least purchased energy for heating because there are no conversion losses in the
transformation of electric energy into heat. This fails to account for the losses inherent in the generation and transmission of the electricity.
Similarly, buildings heated by purchased steam appear to consume less energy than those where steam is generated in the building's heating plant. In the latter case, if fossil fuel is burned to generate steam, the conversion losses are "charged" to the building.
It is rather difficult to determine the correct multiplier to transform "purchased" energy into "resource" energy. For example, electric energy could be generated from a number of primary energy sources such as coal, gas
or oil, or generated in nuclear or hydroelectric power stations. Clearly, there are certain conversion losses associated with each method of electric energy generation, hence different multipliers. Moreover, it is common that the electric energy supplied to buildings is produced from a combination of two or more of the above described methods of electric energy generation. This makes it more difficult to arrive at a specific multiplier for electric energy.
Energy analysts tend to rely on their judgment when deciding upon the multiplier, which is influenced by the location, method and efficiency of conversion, and the purpose of the analysis. For example, in the study by LBL (4) the following multipliers were used:
Fossil fuel multiplier Electricity multiplier
unity 3
In another study published by LBL (6), the authors used 3.37 as the electricity multiplier. In a report recently published by the Building Research Establishment (7), the following multipliers were used:
Gas multiplier = 1.07
Electricity multiplier = 3.81
For the purpose of comparing the Canadian case studies with other cases available in the literature, the resource energy figures given in Table 1 were based on the following multipliers:
Electricity multiplier = 3 Gas multiplier = 1.1
Purchased steam multiplier = 1.3
It is common to normalize the annual energy consumption of "office buildings" using the "floor area". The lack of clear definitions of the terms "office building" and "floor area" might result in misrepresentation of data as well as inequitable assessment and comparison of the energy performance of buildings. The normalized energy consumption of a high-rise office building, where all of the working area is used as "office space", would be lower than that of another building where shopping malls and
commercial areas occupy the ground floors. The main reason is the typically high lighting levels and the extensive use of incandescent lighting in
commercial areas.
In practice, buildings fall into three major categories: residential, commercial and industrial (8). Commercial buildings include office
buildings as well as high-rise buildings with mixed occupancy such as office and shopping areas. In situations where energy consumption of
mixed-occupancy buildings is not separately metered for each type of mixed-occupancy, it becomes difficult to determine the actual energy consumption in the office space.
Regarding the use of the "floor area" to normalize the annual energy consumption, there will be differences in definition depending on the energy analyst. Floor area, however, may be one of the following: gross floor area (includes mechanical rooms, corridors and other service areas, but excludes indoor parking areas); net gross area (the same as gross area but
6
-excludes mechanical rooms and elevator shafts); or net rentable area (includes only the floor area that could be leased to tenants -- measured from the inside of the bUilding envelope.) As might be expected, the normalized annual energy consumption of a given bUilding would have
different values depending on the floor area considered in the analysis. On the one hand, many analysts use the gross floor area because it is already available off the blueprints of the building and is easy to identify. On the other hand, analysts in the real estate sector would prefer to use the net rentable floor area because other cost items are based on the unit area of rentable space. It may be that the use of net rentable floor area in normalizing the energy consumption is more appropriate because of its relationship to important economic determinants of the building's value in the marketplace.
It is difficult to identify a specific "floor area" that satisfies the objectives of all energy analysts. It would, however, be beneficial for all if the floor area used in normalizing the energy consumption is clearly defined and standardized.
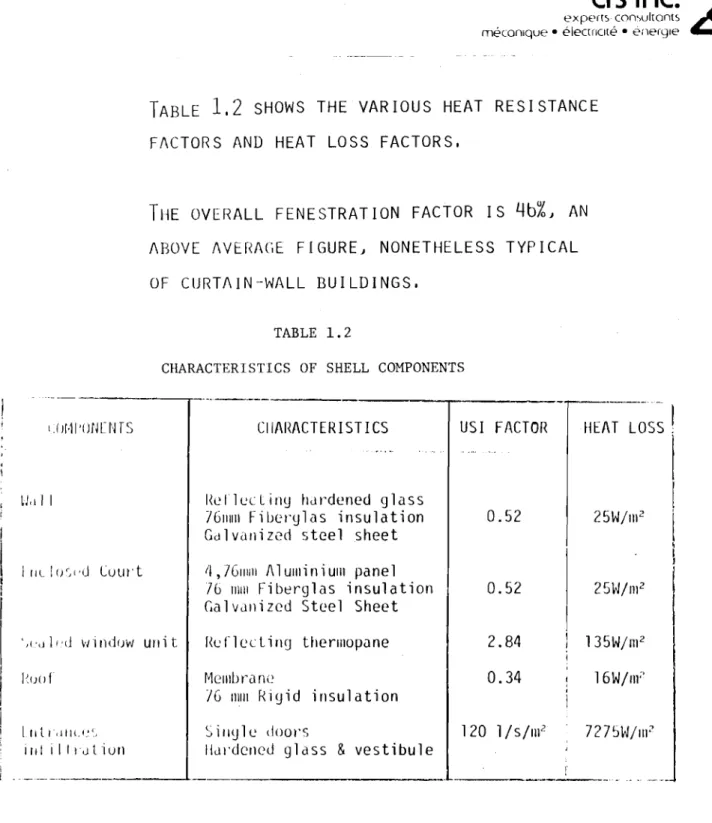
The use of tinted glass and reflective coating on windows was described as a measure to save energy in office buildings. It was indicated that the reason for their use is to reduce the amount of short-wave radiation
entering the conditioned space, and thereby reduce the cooling load, in addition to increasing the R value of the window. The information available about this energy conservation measure did not include any analysis to show its cost effectiveness, particularly for retrofitting existing buildings.
A reduction in the amount of both fresh and ventilation air is one of the measures taken to reduce energy consumption. Although some energy would be saved by implementing this action, It could result in poor air
distribution and a deterioration in air quality in the working space. In turn it could have serious consequences on the productivity and health of employees. Consequently, it is essential to examine all the economic and health aspects of this measure prior to its implementation, particularly when the cost of the lost productivity could exceed the cost of energy saved.
Finally, one of the most commonly used energy conservation measures is the reduction of lighting energy either by reducing the number of tubes in the light fixtures or by replacing existing tubes with lower-power tubes. Although delamping of light fixtures results in reduced electrical energy consumption, this may result in poor lighting. There may also be a
reduction in the service life of lamps and ballasts if the delamping is not done properly. The associated cost of replacing lamps and ballasts together with the effect of poor lighting on productivity should be taken into
account when estimating the cost effectiveness of such action. In addition, the reduction in lighting energy use would reduce internal heat gains within the conditioned space. This means that additional heating may have to be supplied by the heating system, thereby reducing the apparent savings somewhat. Similarly, delamping would also reduce the cooling load
particularly in interior zones. Accordingly, the cooling requirement would be reduced and since the central cooling plant would operate at a lower fraction of its design load, its coefficient of performance would be reduced slightly. However, if this energy-conservation measure were· considered at
7
-the design stage of a new building, substantial cost savings could be realized by the reduction of cooling and air distribution equipment.
SUMMARY
A study of seven energy-efficient office buildings in Canada showed that several factors have contributed to a reduction in energy consumption.
Major energy conservation features are related to four areas: the building
envelope, the heating, ventilating and air-conditioning (HVAC) system, the
lighting system, and operating procedures and controls. HVAC and lighting
systems shut-off during unoccupied hours is the most effective energy-saving
measure, followed by a reduction in fresh and ventilation air rates. The
latter may, however, result in some deterioration in air quality and
consequent lower productivity in the working space. Also, there is a need
to quantify the impact of delamping programs on heating and cooling energy requirements, and HVAC system performance particularly when the delamping is part of retrofit programs.
There needs to be a standardized definition of terms such as office building itself, resource energy, and floor area used in normalizing the
annual energy consumption. Comparison of the thermal performance of office
buildings will not be meaningful or equitable until common terms are clearly specified and accepted by energy analysts and other parties concerned.
6r---,---r---r----,--..., SUPERMARKETS (209) 2000 1990 .. CANADIAN CASE STUDIES 6 U.S. ENERGY-EFFICIENT OFFICE BUILDINGS 1960 U.S. BUILDINGS / \ u.s.STOCK (3900 MJ/m2•yr] o ASHRAl 90-75 STANDARD .. ;/(2:5 MJ/m2.y,) SWEDISH \ . . ASHRAE 90-75R
セ
u i l d i n g s ..6,6 STANDARD 2 6 b-'(1791 MJ/m 'yr) o 6 セセ SWEDISHsbnMWセGVV セ ifBEPS 2 (1305 MJ/m 2.y,);:;-r
セQRUP MJ/m 'y') FARSTA FOLKSAV (1020 MJ/m 2.yr) LCC 2 (B10 MJ/m 'y') 2 3 4 01.--_ _..I...-_ _...J...._ _..._ _..._ _---1 1950 >-<.:) IX ... Z ... ... U IX ::::l o V> ... IX N E NOTL NUMBERS IN BRACKETS INDICATE THE SAMPLE SIZE OF EACH BUILDING TYPE INCLUDED IN THE SURVEY OFF ICES (250) APARTMENTS (216) o 1000 2000 3000 4000 5000 6000PURCHASED ENERGY CONSUMPTION, MJ/m2.yr FIGURE 1
RANGE OF PURCHASED ENERGY CONSUMPTION FOR VARIOUS CLASSES OF BUILDING
FIGURE 2
TRENDS IN RESOURCE ENERGY CONSUMPTION BR 6540-1
TABLE 1. Summary of Information on Seven Energy-Efficient Office Buildings
1982 Purchased Energy
Consumption MJ/ml.yr Resource
Floor Year No. of Energy*
No. Building Location Contractor Area ml Built Stories Elect. Gas Steam Total MJ/ml.yr
1. Joseph Shepard Toronto t Ont. Giffe1s 60 191 1978 13 650 132
-
782(1)a 2095(3)b2. Revenue Building St e , FOYt qオセN CRS Inc. 83 849 1979 6 911
-
-
911(4) 2733(6)3. Marsland Centre Water100 t Ont. Acres 10 300 1971 13 942
-
-
942(6) 2826(7)4. Red Deer Provincial Red Dee r , Alta. Vinto 20 500 1979 6 323 601
-
924(5) 1630(1)Building
5. E.I. Wood Building Swift Current t Yoneda 8 270 1977 5 564 479
-
1043(7) 2219(5)Sask.
6. Gavernment of London t Ont , Engi neering 19 963 1976 11 519 8 282 809(3) 1932(2)
Canada Interface 00
7. Bell Canada London , Ont , Chorley and 33 700 1980 9 681 11 108 800(2) 2196(4)
Administrative Bldg. Bissett
Resource Energy = Electrical x 3 + Gas x 1.1 + Steam x 1.3 a - Ranking according to purchased (site) energy index. b - Ranking according to resource energy index.
TABLE 2. Summary of the Main Design Features of Seven Energy-Efficient Office Buildings Building Joseph Shepard Revenue Building Marsland Centre Red Deer Provincial Building E.1. Wood Government of Canada Bell Canada Wall Construction
Brick &block spandrel
Prefabricated insulated metal Prefabricated concrete panels Precast concrete Precast concrete Precast concrete Aluminum panels Windows Double-glazed -reflective glass -thermo double-glazed 46% of exterior wall double-glazed grey thermopane 19% of exterior wall double-glazed with medium solar bronze pane
28% of exterior wall double-glazed with grey reflective pane 30% of exterior wall double-glazed 25% of exterior wall sealed double-glazed tinted units 28% of exterior wall HVAC System Compartmented VAV system & perimeter heaters
decentralized low velocity fan coil
high velocity with electric duct heating
VAV with economize and perimeter heaters
VAV system
VAV compartmented fan units
-mixed air system -perimeter heating by
high pressure induction
-mixed air VAV units
Lighting Power 24.8 watts/m2 21.4 watts/m2 36.4 watts/m2 22.6 watts/m2 19.7 watts/m2 34.2 watts/m2 18.3 watts/m2 Others -heat recovery system -thermal storage (1135 m3 water) -780 heat pumps for perimeter zones -1325 m3 water thermal storage all-electric building tight wall construction core areas cooling only <.0
TABLE 4. Summary of Energy Conservation Features Building Envelope
Reduced glass area
Use of multiple-glazing sealed units
Use of reflective coating windows
Use of shading devices
Improve air-tightness to reduce infiltration Increase insulation in exterior walls HVAC System Use of economizers and use of free cooling, when possible
Use of heat pumps
Use of heat recovery
Use of VAV and minimize reheat energy Use of thermal storage Reduce ventilation rates without deterioration in air quality Lighting System Reduce lighting power
Use of high perfor-mance lighting system Use of task lighting
Use of daylighting Delamping
Operational Control Use of energy management and control systems
Shut-off of lights and HVAC during unoccupied hours
Electricity demand control
Minimize simultaneous heating and cooling
Supply temperature reset
Night-time temperature setback Use of carbon monoxide
detectors to control ventilation rates
I-' I-'
TABLE 5. Energy Conservation Features Implemented in Each Building
Energy Conservation Joseph Revenue Marsland Red Deer Government
Feature Shepard Building Centre Provincial E.L Wood of Canada Bell Canada
1. Delamping .; .; .; .;
2. Lights shut off .; .; .; .; .;
(unoccupied hrs) 3. Reduce lighting .; .; .; .; .; .; power 4. Systems shut-off .; .; .; .; .; (unoccupied hrs) 5. Improved HVAC .; .; .; .; design I 6. Heat recovery .; .; .; .; .; ...N 7. Reduce Ventilation .; .; .;
rate (and outdoor air)
8. Improve control .; .; .; .; .; .;
system
9. Reflective .; .; .; .; .;
coating windows (or tinted glas3)
10. Reduced glass area .;
11. Thermal storage .; .;
REFERENCES
1. Latta, J. K., "Canadian Energy Consumption and Conservation Programs Related to Buildings". Proceedings of CIB W-67, International
Symposium, Energy Use in the Built Environment, Vol. 1, Dublin, Ireland, 1982.
2. Elmahdy, A. H., "Recorded Energy Consumption Data on Office Buildings". National Research Council of Canada, Division of Building Research, Building Research Note No. 182, Ottawa, Ontario, 1982.
3. Syska and Hennessy, "Energy Conservation in Existing Office Buildings". Phase I, U.S. Energy Research and Development Administration, Contract No. EY-76-G02-2799-0000, 1977.
4. Wall, L. W. and Rosenfeld, A. H., "The Assessment of Progress in Energy Efficient Buildings", Building Energy Management Transitions in
Technologies and Policies. Proceedings of the Second International Congress on Building Energy Management, Iowa State University, Ames, lA, 30 May - 3 June, 1983.
5. "Study of Energy-Efficient Office Buildings" (Seven contract reports, one for each building), Canada Institute for Scientific and Technical
Information, National Research Council Canada, Sept. 1983.
6. Ross, H., and Whalen, S., "Building Energy Use Compilation and Analysis, BECA Part C: Conservation Progress in Retrofitted Commercial
Buildings". Lawrence Berkeley Laboratory, University of California, LBL 141827, Aug. 1982.
7. Crisp, V.H.C. et a l , , "The BRE Low-Energy Office". Building Research Establishment, Department of Environment, Garston, Watford, U.K., 1984. 8. Personal communication with Building Owners and Managers Association
(BOMA) , Toronto office, Dec. 1984.
This paper is a contribution from the Division of Building Research, National Research Council of Canada
15
-ENERGY-EFFICIENT OFFICE BUILDINGS REPORT ON
THE MARSLAIm CENTRE WATERLOO. ONT.
by
Bernard D. Deuchars, p.Eng. Acres Consulting Services Ltd.
Marsland
Centre
" .''セ セゥゥA,
'\ '.セ
jセ
.:(>o
,am17
-CASE STUDY OF AN
ENERGY EFFICIENT OFFICE BUILDING THE MARSLAND CENTRE
WATERLOO, ONTARIO
It is a pleasure to be afforded this opportuni ty to speak to
you.
I will be speaking to you about the Marsland Centre, located
in Waterloo, Ontario. However, before getting into that
topic, I'll relate to you an anecdote concerning what appeared
to be the ultimate in energy efficient building design.
One of our large insti tutional clients operates a central
stearn generation and distribution system. Heating energy to
the build ings which comprise the insti tution is metered using
condensa te meters. User departmen ts wi thin the insti tution
are "charged" for energy use through an internal accounting
procedure. One of the affiliated colleges, (this being a
universi ty client), underwent an expansion project. After
completion of the new addition, the physical Plant Dept. who
supply the stearn, noted that metered condensate"returned from the college to the stearn plant was less per month than before
the expansion project, despite similar weather and usage
conditions. '!be plant operator in the affiliated college
suggested that this phenomenon might be attributed to the
energy e ff icien t design of the new build ing addi t i on ,
Needless to say, this explanation "d idn' t wash" wi th the
physical Plant Department, and it was subsequently discovered
that a considerable volume of the condensate was being
inadvertently sewered upstream from the condensate meter.
Matters have since been rectified, and the Physical Plant
Department has now engaged Acres to install stearn metering for some of the major users on the campus.
*
*
*
*
*
*
*
*
*
*
The Marsland Centre in Waterloo, Ontario is a thirteen-storey
steel frame off ice tower wi th a gross floor area of 10,300
square meeters (111,000 square feet). Its design was
pattern-ed after a build ing in Singapore which was admired by the
building owner, Mr. Stanley Marsland. The architects for the
building were Barnett, Reider-Hyrnmen, of Kitchener, Ontario.
The structural engineers were Walter, Fedy, McCargar,
Hatchburn of Ki tchener. The mechanical/elec tr ical eng ineers
were Yuska Wenzel and Sehl Ltd. of Ki tchener. The general
contractor was Lavern Asmussen Ltd. of Kitchener. The
property manager is Mr. Carl H. Schmidt, whose offices are
loca ted at the top floor of the Marsland Centre Build ing.
The build ing was designed in 1969/70 and constructed in 1971.
princi-pal tenants are the Regional Municiprinci-pality of Waterloo and the
City of Waterloo. Other tenants include several insurance
companies, a bank branch, and a consulting engineering firm.
The Marsland Centre is an all electric build ing, employing
electric resistance heating and electrically driven
centri fugal ch illers for summer cooling. (Mr. Marsland, the
owner, was formerly an electrical contractor, hence he had a
soft spot in his heart for all-electric installations.) In
view of its being electrically heated, the building envelope
was designed with more than the (then) normal amount of
thermal insulating properties. I will elaborate on this
shortly.
In order to be selected for the NRC study of
energy-efficient office buildings, a candidate building had to
satisfy a number of criteria concerning building height, gross
floor area, and of course, unit energy consumption, among
other requirements. The unit energy consumption requirement
was to be not in excess of 1000 MJ/m 2• y (26 EkWh/ft 2 • y) •
The Marsland Centre, as operated in 1974 following full
occupancy, did not meet th is performance parameter by a wide
margin. During calendar years 1974, 1975 and セYWVL the
normalized unit energy consumption was 1360 MJ/m.y (35.1
EkWh/ft 2.y). However, commencing in 1977, the property
manager introduced numerous operational changes and retrofits
designed to reduce both energy demand and consumption. As a
result of these changes, the normalized unit energy
consumption of the Marsland Centre has been reduced to 942
MJ/m 2.y (24.3 EkWh/ft 2.y), an improvement of 30 percent
over pre 1977 values.
At the same time, average monthly electrical demand has been
reduced 22%, from 894 kW/month to 701 kW/month. Through these
measures, which will be discussed shortly, the property
manager and owner have nullified the considerable increase in annual electrical costs which would have occurred as a result of price escalation between 1976 and the present.
As mentioned above, the pre-1977 uni t annual energ
¥
consump-t ion of the Marsland Centre was 1360 MJ/m. y (35.1
EkWh/ft 2.y). While this is not what might be considered
good energy performance by today's standards, it certainly was
considered good at the time of its design in 1969/10' when
uni t energy consumption values of up to 5800 MJ/m -Y (150
EkWh/ft 2• y) were not uncommon. Let us examine some of the
conservation-minded construction features which were incorpor-ated into the original design.
Here is a typical floor plan of the Marsland Centre. It is a
standard rectangular office building design, with rentable
space surrounding the central service core containing
19
-n
i I I I O-J io
o
セ⦅セ
..
aG⦅Pカセセᆬセ
セ
I <J <Jセ
<J <J <Jセ
セ
セ <]セ
<J <J <Jセ
<l
<l
L
'V "V'セセ
V " V V V..
-J
TYPICAL FLOOR PLAN
iᄋセ eM D12Y'WA..LL , - - - - セᄋb C. M セ|cRid IセGZZャulaNtGoエMNNQ ー・ecaNセt COt-.JCI2ETE. PAIiJEL'::. GMMMMMセᄋb CWl iセセulaNNtec P. t--1 paセelセ
TYPICAL HORIZONTAL WALL SECTION
E:>UILT- UP ROOFIr-JG d セNセ eM RIGID , t\JS LJL A.T , 0 ".1 21 -セKMMMMMMM PRECAS,. coセciRete PAt-JELS ROOF
.: ,.' ...
s :
TYPICAL ROOF SECTION
space is itself subdivided by light wall partitions in accordance with tenant requirements.
The exterior walls are precast concrete panels and
pre-manufactured insulated panels, all backed by 3.8 cm (1.5 in.)
of rig id insulation and 1.3 cm (112 in.) of dry wall. The
exterior wall overall RSI value is 1.98 (Rll).
There are 800 windows, all insulated units, tinted gray
thermopane solar glass having an RSI value of 0.36 (R2). The
ratio of glass to wall area is 19 percent.
The roof of the building comprises 10 cm (4in.) concrete deck
wi th 3.8 em (1.5 Ln , ) of styrofoam insulation and buil t-up
roofing. The RSI value of the roof is 1.05 (R6).
As mentioned earlier, the building is all electric. Heating
is provided by electric resistance heaters mounted in the
supply air ductwork, and by perimeter baseboard units. Summer
cooling is provided by an electrically driven centrifugal
chiller. All electric power for heating, cooling, lighting
and equipment is metered through a single demandl energy
meter.
The building interior lighting is predominantly fluorescent
comprising two-tube and four-tube ceiling mounted fixtures
which double as supply air and return air grilles. Local
switching of lighting is provided for the convenience of
tenants. This feature is inherently energy-conserving because
it facilitates shutting off lighting which is not required.
The heating, ventilating and air conditioning of the second
through thirteenth floor is provided by five high pressure
supply air systems and one common return air system. The fans
are located in a 13th floor mechanical room. Four of the
supply air systems serve the four perimeter exposures of the
build ing and include electric preheat coils and cooling coils
located at the units; and reheat coils located in branch
ductwork to groups of perimeter air discharge outlets. The
fifth supply air system serves the interior core of the
build-ing; it has no preheat coils, only reheat coils in the branch
ductwork to air supply light troffers. Air is returned to
ceiling plenums through light troffers from where it passes
into a return air shaft. The common return air fan discharges
into the mechanical room which acts as a common return air
plenum. Each supply air system is equipped to mix return air
with outside air. Provision for "free cooling" is
incorpora-ted in the temperature control scheme, wi th the outside air
dampers reverting to a minimum posi tion setting of 15 percent
23
-OUTSIDE A.IR. ---I='"ROM FA
PLE:I\lU IV'1
UtJ ITS O"'-J LV)
- HIGH prBecZ^セuQRfZ FANS GRZ^セiMセ COOL ING [OIL ELEC.T HTG (OIL outセid・Z AI 12.tセerNm。セBaNQ coエjtセolN」ZZL PowEI:Z. TO PREHEA.T C.OlL.
-
--,
Jr
I I I HpeiRiセeZイeセ,
I I RETuetoJ AI12 l="k?C'l"'" MECI-I RaOM1
-AVEk?AGE' 'Z.C10E TEMPEI2ATUI<E POc"T,OIU':> DAtJlPEI2S! AND C H WATE 12vALvE Ir-J CSEQUE::t.JCE
0"-1 ,-E...,P. riセeB HPSA HP5A
+
"TYPICAL e:.RAtJCH higセ p・eセsuセヲZZ TEkGiv|iセal セックMMMMMML !---TYPICAL H,p' セupplBB AII2 riセfZセ[LECT, HEATING COl L
I
\
\
t
F'"LOOl;2 AIQ SUPPLY TO
セ
HPc:,ALOc:..AL セ A dii]BセオセeNセ TO LoWECC
fBlooセ
LOC.AL theG_セoBZ[ItaNMイ
co/\JTROLCO 2EI..hセZaGt COIL
SCHEMATIC DIAGRAM OF HIGH PRESSURE SUPPLY SYSTEMS FOR FLOORS 2-13
MARSLAND CENTRE WATERLOO
K'OOM C.OOLlIVG TheセエMa ッセゥaNB poセitャ。n・[LNdamperセ BGセt;l. c.H WA,.TEI2 J A.uJE I"-J sセ。lNャeijcZG 0.U TE ,""P l<i」ZZNセ /
--I
II
I
I
I
I
I
I
I
I--L
-5:
---(OOllI>JG C.OlL ッオセLッeG AI" PD211V1ETE12 ELECTl2.IC. , -f:::,A.SEBQ,A.,'2D セadiaBGioエj セ Ii ri i i i i l l ' I ill i II II
Tイュュセ⦅
セ
l
IBzdセ HEATINC. II
theセmostaNtt
eBjeセgizNeセI
PFセQQvQ セteZG_I
L12. l2..E..DiATIOtJセ E:A'"TcoILI ャセ SEGUEtJC,E ICt-..J TEMP. セ・oー
I
.J
-TYPIC.AL -z.ONE: セオpplGv -LO"-JE セljpplv
SCHEMATIC DIAGRAM OF SUPPLY AIR SYSTEM
FOR FIRST FLOOR AND BASEMENT Fig. 2-5
MARSLAND CENTR[ WATERLOO
25
-The supply unit preheat coils are controlled to corne on in
stages in response to dropping outdoor temperature. The
reheat coils are controlled by local room thermostats. An
automatic "night" setting control feature causes the units to
be controlled by a night thermostat set at 18.3°C, and the
units go onto 100 percent recirculation.
The heating, ventilating and air conditioning of the first
floor and basement are provided by a multizone air handler and
two small fan systems located in a first floor mezzanine
mechanical room. The control of these units is similar to the
main units serving floors 2 to 13. The first floor also
incorporates electric baseboard perimeter radiation because of the large glazed areas.
Elec tr ic snow-mel ting cables are embedded beneath the pod ium
steps at the four corners of the building. Power to these
cables was manually controlled. Their use has been
discontin-ued for operational and conservation reasons.
An additional energy conservation feature incorporated into
the original design of the building was the capture of heat
released by electric apparatus located in electrical rooms
throughout the building. The electrical rooms exhaust system
can be discharged ei ther to the return air plenum, or to
outside, depending on whether heating or cooling is required.
The Marsland Centre, being all electric,
attention of ontario Hydro which, in December
it in its "Concept Electric" publication which energy efficient buildings and processes.
attracted the
1973, featured
was devoted to
Despi te the Marsland Centre being a conservation showpiece of
its time, the build ing owner and property manager were aware
that improvements in energy management were desirable and
possible. Despi te being a "showpiece" , the following
shortcomings in design and operation vis-a-vis conservation,
became apparent:
the high pressure high velocity air handling systems used
large quantities of electrical power for air movement,
espec ially as they were run continuously day in-day out,
every day of the year.
- the air handling systems are all reheat systems, presenting
the possibility of simultaneous heating and cooling
- the air preheat coils in the perimeter air handling systems
presented the possibility of simultaneous operation with
26
-CONCEPT ELECTRIC
{Iエセc・ャtQエI・イL 197:3, No 69 Marsland Centre, WaterlooHEAT RECOVERY SYSTEM IS TOTALLY ELECTRIC IN
MARSLAND CENTRE, WATERLOO PRESTIGE OFFICE TOWER
111l' lililes! office building In Waterloo, M,Ilsl,l11l1 cciIHiHセL lowers 187 feel and 13 stoi evs above the downtown area of the city It nr ovides almost 100,000 square feet of office space for 600 occupants all Nセi・」エイゥ」ゥャゥャケ space conditioned. Two of the floor s dre occupied by the city administra
IIO!1.
Mdrslilild Centre sits on a 20-foot decora-tive concrete podium, landscaped with flow-.:1 S dl)(1 trees to provide an attractive entrance .nir] d welcome pause for visitors on a busy <!dY, It is faced with more than 900 vertical precdst concrete panels, some of which are Inlaid with red man-made granite. The contrasting red and white panels accent the vertical lines of the structure
The 800 windovvs of griiY ther mopane
solar qlass reduce heat and glare but allow natural sunliqht to filter throuqh. Douhlo glazing forms one of the insulation cornpo nents.
Built two years ago, Marsland Centre was the first building of its size in Waterloo to be heated and cooled totally by electricity. Tile system makes effective use of power by re-using heat given off within the building from transformers, motors, lighting and business machines. The heated air is collected, cleaned and recirculated.
Fluorescent lighting provides 95-100 foot-candles at floor level.
Fire detectors in all areas feed signals to a master control panel with each floor having a fire-hose cabinet. The building has its own water -p rcssu re system.
STRUCTURE
ョG[ャュヲセv office Illlllrllrlg, 7,550 sq. ft. of space per
11')(lI 1,374.100 cu ft 182 ft. high. 600 occupants.
CONSTRUCTION
Eセ AQセイioi w,i11o precast concrete panels + 2"
·,11'1ofOdm insulation
F r "rlW ,trllC:lulill,I"el FOUilclifllon' huilding rests on ')4 ,'UllCI e te Cdls,ons sunk to average of 40' below '<."'1 Floors. concrete. Roof' 4" concrete t 1'/," '/' oloom wャョ、ッGセBL double glazed WaV thermo pane
DESIGN DATA
.''JrrH f' 1 Outdoor e1eslgn temp, ·3°F Normal degree
dill", zsso
Inlluor (Ie';lgil temp, 7i'F Ventilation, 110,400c!m
ャQLカウエGセQQQ Willi minimum of QUセ[L of fresh air
',lIinllH:r Ou uloor desieJIl Temp. 90° F Indoor desiqn
t f'1I11). JセjG[ F
ELECTRICAL SERVICE DATA
Underground service. Transformation by owner' 2,000 kva. 14.2 kv primary, 600 V - 30 secondary with 150 kva. 600 V to 120/208 V dry type transformer on each floor.
(Note: Q) is a symbol for three-phase)
CONNECTED LOADS
Heating: 1,222 kw. Cooling: 300 ton. Lighting 375 kw. Water heating: 34 kw.
OTHER ELECTRICAL LOADS
Lighting level' 100 foo tcandles. Domestic water
heatinq: bulk central storage
CAPITAL COST
Heatinq. coolinq, ventilation, liqhtinq, mechanical $4.60 per sq. ft. Electrical, 52.80 per sq.ft
OPERATING DATA
SPACE COI\IDITIONING DATA
Ii!! 1"',11111(1'1",11'111 I, .m dll',1Ir system, With both
'!I III ,"111111 ,IIHI "upplv 10 the core throuql- the Ilelllll1HJ frx tur e«. The perimeter heating IS a high ·.eloci ty ;lII' svstern with electric duct heaters to '1I1p1V ifII' ill 、ヲGウゥョセ」i ternperatur es. Each 20 by 20
foc)! ,pile" " controlled by its own thermostat 11!'JlrliilIIHJ lile perimeter heating. The temperature of
111f' <upplv air to the core of the building is regulated
Ill' rnix inq return air with outside air to supply a
icrnper arun: of approximately 60°F. Once the
)[1tSlde tern peliltIIre reaches 60° F, a 300 ton air
"CJI1r!,IIOlter Iilke, over to supply the cooling.
BV ulillLlllCj the heat returned through the light 'IX!lIrp, illl(l re,uslIHJ uus heated air, after it is mixed Wltll frestl .ur fOI' the perimeter, avery economical In';IalldtlOll IS obtained. Also heat released from
I,ill<.lnI111"I', ilnd motors is picked up in the air
.uruu dIH!l.Illl,led
CONTROLS
NII/Ilt sl"tlt"ck with ume cluck control on each floor
I" ,1"lIql'l QPゥヲイャセ cornmq011 In mormnq.
Month kwh kw L.F Net Cost April 1972 279,600 936 41,4';" S 3,59785 May 1972 340,800 720 (iO 7";, 3,(148.25 June 1972 222,000 648 47LUuセQ 2,6DO.65 July 1972 252,000 564 62.0',"" 2,75365 August 1972 249,600 576 60.1';" 2,797.85 September 1972 248,400 552 62.5% 2,707,45 October 1972 271,200 552 68.2% 2,867.05 November 1972 268,800 696 53.6% 3,102.25 December 1972 276,000 816 46.9% 3,362.55 January 1973 366,000 936 54.3% 4,202.65 February 1973 426,000 984 60.1% 4,706.65 March 1973 -.1.25 ,20 0 984 45.9% 4,00105 3,525,600 40,397.90 Average net cost per kwhセ 1.14c
Annual Energy =35.3 kwh/sq. ft. Annual Cost= 40Ac/sq. ft.
Maximum Demand = 9.8 watts/sq.tt. CONSULTANTS
Architects: Reider-Hymmen, Kitchener
Mechanical & Electrical: Yuska. Wenzel & Sehl Ltd. Kitchener
Utility: Waterloo Hydro
Owner & Developer: St anlev Marsl'Jnd. Waterloo.Ontarro
TECHNICAL DATA VERIFIED BY:
jセエM
/
//?
S,lInuelyオウォゥャセ
U
Yusk a, Wenzel&Sehl Limited, Ki tchenerjOritar io.most office areas were found to be over-illuminated in the opinion of the users of the space
- outdoor decorative lighting was excessive
- some electric storage water heaters were found to be
redundant
- the pod ium snow mel ting system was found to create more
problems than it solved. It creates the possibility of
increasing the electric kW demand. At the same time, melted
snow and ice refroze at new unprotected locations, creating
slippery and hazardous conditions for pedestrians.
(Electric snow melting was soon abandoned in favour of
applying ice pellets.)
- occupant access to heating thermostats.
The calendar year of 1976 was chosen as the "milestone" year
against which to measure the effects of energy conservation
measures which were in trod uced by the property manager. You
will remember that 1976 was the first year of full occupancy, and that few conservation measures had been introduced to that point.
This exhibit shows the month-by-month and annual level of
energy consumption in kWh for the Marsland Centre in 1976.
Note the breakdown of energy use into the main components of - lighting, office equipment, DHWand elevators
- air movement
- heating
- cooling.
The breakdown into main components was done with the aid of a computer simulation model (the Merriwether/ PWC ERE program). The significant points to note about this graphical presenta-tion are:
- winter and summer peaks
- the large amounts of energy devoted to air movement and
lighting, compared to heating
- the small amount of energy devoted to cooling, compared to
heating
- some "unnaccounted for" energy showing up during the cooling
season months. Conceivably this might be attributed to
reheat, but the property manager insists that all reheat
500 N \0 Lighting Office Equip. dhセi & Elev. Annual unaccount.
ICOOling
1,000 4,000 \f-a c::: o tI1 s: g 3,000 o 3: ..:>£ ''--+.>g-
2,000 :::l tI1 c::: a u tU :::l c::: c::: c::( DI;
";":':'.:':. -,,:::;.;;. NLAゥセ
Z[セゥセセ
o
fi
SNィゥセ|
セセ
A;{f:·
エセゥXセ
xᄋRjセ[NZ ケZ[セZZ[N J -:...セヲZ ':;':.';セャセ
[セJセセセ
.:... JセiアZ
セセZGILイ .\セ セセ :'.\Lセ[ャヲ[
...;"::::Zセ M :.."..:.':.: ZセI[Nセ[ ᄋᄋZMセN[ᄋZエ Nセセセ[セセL ZZセェG .. イスサNセェN セZNセ セセ[セNNZ A ZセNセGLセZセ[ ZセセセZ ...;QQLセA
M ::NZNセ iGセ L_}セQGNᄋ ZNMGZャセ[ᄋセ[jG
F ZセB ... エ[OZセ セセ AZNセセZZ セセセセ ...-:.•. セゥZセᄋセZ :.j..;:. L[NZ[セZスN J セセiスセZセヲセ
400 s: 3 ..:>£ 4-. a V1 0 300 0 0.
-.. c::: a -r-: +.> 0-E 200 :::l V1 c::: 0 u >, セ s: +.> c::: a 100 LAPPORTIONMENT OF ENERGY USE 1976 MARSLAND CENTRE, WATERLOO, ONTARIO
Fig.3-1
4,000 3,000 Unaccounted Cooling Heating Air Movement
Lighting, Equip., DHW, E1ev.
.J:: 3: .:>£ 4-o V1 o o o c o Nセ -I-' 0-E :::J V1 C o U ro :::J C C c:l: 2,000 1,000
o
セjQセセ
(.N Q 1976 1982COMPARISON OF ANNUAL ENERGY USE, 1976/82 MARSLAND CENTRE, WATERLOO, ONTARIO
セ 1'.J 3-4
energy therefore remains "unaccounted for" at the present time.
The next exhibit is a similar graphical presentation which
demonstrates the effect of the numerous energy conservation
measures which were introduced by the property manager between
1976 and the end of 1982.
Note the following:
overall red uction in energy use of 30% from 3.9 million to
2.7 million kWh
significant reduction in energy required for lighting, and
fans
- an increase in resistance heating energy requirements,
(resulting from the reduced lighting load).
- a decrease in cool ing energy requiremen ts, (also resul ting
from the reduced lighting load).
This next exhibit shows the month-by-month comparison of
energy use 1976 vs 1982. It will be noted that the
conserva-tion measures resul ted in reduced consumption each month of
the year. In 1982, the winter and summer peaks are still
apparent ,
The next exhibit demonstrates the effect that conservation
measures have had upon monthly electrical demand, 1976
compared to 1982. Every month shows an improvement, with the
overall improvement being 22%.
I now wish to discuss the various energy conservation and
demand reduction measures which have been introduced in the
Marsland Centre by the property manager, and which have
produced the very favorable energy record which the Centre now benefits from.
Elimination of Electric Snow Melting
Electric snow melting cables totalling 25 kW in capacity were provided in the stairs to street level at the four corners of
the build ing podi um , In the win ter of 1975-76, their use was
discontinued not so much as a conservation measure but as a
safety measure. Mel ted ice and snow was running off and
refreezing on sidewalk areas increasing the hazard at these
areas. NOW, snow is manually cleared and ice pellets are
applied.
The elimination of electric snow melting was a no-cost
32 Z8 9L Cl
HyIセ
I , . . セ ' 8 : セc==
Nセ _ i 1.L セ > Qj Z8 9L z: w :3 :r: c. Z8 9L o CL ::J +-J a-u c w Qj Qj セ E c Qj en ::J cr, V > C 0 C C セ U -<-J U -<-J £: 'D 0 <0 s, en c 0 Qj LJ :r <t - l Z8 9L Z8 9L Z8 9L Z8 9L N CO セ[セセZヲIセZサセZセ⦅ヲOZセセセセZZZ Z8 en<, セ セ 9L r-.. en 0 ... w a: ZNZセセセヲ[ ZNセ [セセNZZ[セ セ セNZᄋゥ ヲセᄋセセ Z8 U1:::> <: f-z: o::x: >- 0 9L <..!J a: w C) セM 0 W -J セxcヲIスセLZ[セᄋェセセ Z8 >- a:w -J f-:::E :::c o::x: 9L f- 3: Z セ w a: IセセセセセセGセZセNセN[[セセセセZセZ Z8 0l.L f-z: W l.L Z u 9L 0 U1 Cl z a: <:1: o::x: -J ^[ZcセセセセsZ _AセG Z8 c,:::E U1a: 0 セ ' J u 9L o o II' o o <7 o o (V') o o N o o o1,000 900 800 700 600 500
1
ャiセゥャュHGャャ
Ililf'i'1:j
QZャエセゥセゥセャ
iiャャヲHセェ
iiャイᆪセャ
セiェセᆬェ
ヲ|ャヲャサZセAェャ
iャゥャャャ||[セQ
iijヲセエセ
QQQセ
iャャャェセゥ|ャ
セゥャヲ[ZLAGZj
セ
400 300 200 100COMPARISON OF MONTHLY ELECTRICITY DEMAND 1976/82 MARSLAND CENTRE, WATERLOO, ONTARIO
\.0 N r-, co J \.0 N r--, co F \.0 N r-, co セセ \.0 N r-, co A \.0 N r-, co t1 \.0 N r-, co J \.0 N r-, co J l.O N r--, co A l.O N r-, co S \.0 N r-, co
o
\.0 N r-, co N \.0 N r--, co D Fig.3-5•
on up to 365 hours per winter month prior to their being
disconnected, equivalent to 27,000 kW.h per year. The
present-day cost of avoided energy use is $800; the potential
reduction in electrical demand changes, at present day cost,
is a further $200 per year. Cycling of Washroom Exhaust Fan
In November 1976, a seven-day timer was installed to
automati-cally cycle the 1.5 kW washroom exhaust fan to operate from
7:30 asm, to 11:00 pvm , weekdays, and for
two hours per day Sa turdays and Sundays. Prior to this, the
fan was allowed to run continuously. The resul ting annual
energy use avoidance is around 6,000 kW.h. The present-day
cost of this timer installation would be about
s
250.00, andthe annual energy cost avoidance $175.00.
partial Elimination of Supply Air Preheat
The main perimeter supply air systems incorporate electric
resistance preheaters arranged to come on in three stages
correspond ing to reduced outside air temperatures. NOw, as a
means of limiting electrical demand, these preheaters are
timer-con trolled to operate only between midnight and 6: 00
a.m. on Monday mornings in winter. Their operation follows the
weekend-long fan shutdown period during which time building
temperature has been allowed to drop. The length of time they are permitted to operate is determined by the property Manager
who bases his judgment on weekend weather forecasts. 'Itlis
measure was introduced in 1976.
The total connected load of the preheaters is 210 kW. By
ensuring that they do not operate past 6:00 a.m., a potential
210 kW of additional demand load is avoided, during the winter
months, having a present day value of $575 per month. The
present day cost of the timer control installation is about
$1,200.
Cycling of Main Air Handlers
In April 1977, an automatic timer was introduced to cycle the
main air handlers (and all assoc iated and interlocked
equip-ment such as pumps, chiller, and cooling tower) in coord
ina-tion wi th build ing occupancy. The fan systems now operate
from 7:00 a.m. to midnight weekdays, with earlier startup on
Mondays to pick up load following weekend shutdown. (The
reason for running to midnight is that City and Regional
Council meetings on weekday evenings often run very late,
necessi tating running all systems to midnight to ensure that
warm weather cond i tions, the sys terns will be run on weekends
to prevent inside conditions from departing too far from
normal.
The in troduction of fan cycl ing has resul ted in an annual net
reduction in electric power consumption estimated at 535,000
kW.h. The present-day value of this avoided energy use is
$15,800.00. The current value of the retrofit is $2,000.
Minimizing Simultaneous Heating and Cooling
In August 1979, the property manager had installed four
switches which, through relays, can "kill" electric power to
the in-duct secondary (reheat) heaters (776 kW connected load)
throughout the build ing. With these swi tches, the property
Manager prevents "reheating" of chilled air during the cooling
season. He also uses these switches to prevent reheating in
winter whenever return air temperature is observed to be at
23°C or above.
The present day cost of this installation is $400. The cost
avoidance value of the installation cannot be rationally
estimated because power may be "killed" when the coils are
already off due to ac tion of the local thermostats. However,
the Property Manager is secure in the knowledge that reheat
cannot be wastefully applied due to occupant "fiddling" with
thermostats whenever he has actuated the "kill" switches. A
further benefit of this change is the potential reduction in
demand charges which the installation affords. Chiller Capacity Control
The 300-ton centrifugal chiller is equipped with a manual
capacity control which can be used to limit output down to 40
percent of rated capacity. The property Manager and/or his
building operator manipulate the capacity control in response
to weather conditions, thus providing manual reset of chilled
water supply temperature relative to cooling demands. Chilled
water supply temperature is varied between 5.5°C and 7.8°C
(nominal design chilled water supply temperatures is 4.4°C).
By this means, chiller power demand and consumption is kept to the minimum necessary to produce the desired results.
This is a no-cost conservation measure since the chilled water
temperature is being reset manually by existing operating
personnel. It is estimated that this measure contributes an
annual energy use avoidance of 17,000 kW.h, worth, at present day rates, $500.00.
Ventilation Air Control
All main air handlers are equipped to mix outdoor air wi th
return air for ventilation purposes. In winter, the Property
Manager manually closes all outside air dampers in the
periphery supply units, and resets the minimum O/A damper
setting of the mezzanine unit to achieve a mixed air
temperature of 18.3°C. As a result, the bulk of ventilation
air is now introduced through the interior supply unit only,
and the total fresh air quanti ty introduced into the build ing
is much reduced below former levels, i.e. from 15 percen t of
total air circulated to (estimated) 7 percent. The resultant
saving in energy consumption for outside air heating is
estimated to be 60,000 kW.h, worth $1,800.00 at today's
rates.
Temperature Swings
In winter, space temperature is observed to rise during
week-days without the addition of electric heat. This is obviously
due to the combination of internal and solar heat gain during
the work day. The property Manager permi ts the return air
temperature to rise wi thin reason; the resul t being that the
additional heat stored in the structure causes less energy to
be consumed during pickup load the following day. This
is a form of "dead-band" thermostatic control. Insufficient
data exists to permit a rational estimate of the magnitude of energy savings which this measure has contributed.
Delamping
Between 1978 and 1981, extensive building delamping has taken
place. Throughout the building (with the exception of one of
the building tenants which occupies three of the floors), four tube fluorescent fixtures have been delamped to two lamps per
fixture. These modifications were done using existing
opera-ting staff during regular hours, hence this measure was
imple-men ted at no cost. In add i tion, as tube burnouts occurred,
the 40-watt tubes were replaced with 3s-watt tubes. Also,
exterior lighting has been substantially reduced. Tenant
cooperation has been solicited to turn off unneeded lighting.
Night cleaning staff cooperates by illuminating only those
portions of the building in which they are working.
As a resul t of the delamping program, power for lighting has
been reduced by 390,000 kW.h per year. The reduced lighting
levels resul t in lower cool ing requiremen ts in summer, but
increased heating requirements in winter. The net reduction
from delamping is estimated to be 323,000 kW.h per year having a present-day value of $9,500.00.
37
-Reflective Window Film
In April of 1980, reflective window film was applied to the
interior surface of all south and west facing windows at a
cost of $7,850. The property Manager noted that the load on
the chiller was reduced as a result of this measure (no
figures on the load reduction are available). The computer
analysis indicates a reduction in annual power requirements
for cooling of 6,000 kW.h worth $180.00 at today's power
rates. The reduction in solar energy heat input to the
building in winter is claimed to be offset by the reduced
transmission heat losses attributable to the film' s reputed
effect of increasing resistance to heat flow. Reduction of Exterior Lighting
As designed, the Marsland Centre incorporated extensive
exterior perimeter lighting for visual effect purposes. This
lighting has been almost eliminated in the interests of energy
conservation. After-hours interior lighting in the ground
floor offices and lobby provides sufficient spill lighting for illuminating the adjacent exterior podium area.
The few exterior lights and signs which do remain on at night
are controlled by a existing time clock to prevent operation
throughout the night.
The implementation of this no-cost measure reduced
energy consumption by approximately 70,000 kW.h,
$2,000.00 at today's power rates. Reduction in Water Heating
annual worth
The office floors of the building are served by two electric
water heaters, each 10 kW capacity. It was found that one
heater would serve the area adequately. The second heater was
disconnected to ensure it would not cause any increase in
monthly electrical demand. The annual demand cost avoidance,
at the present rate, is up to $330.00. Recommendations
The various energy conserving features which were incorporated into the original design of the Marsland Centre, and the
addi-tional measures which have been introduced by the property
Manager since 1976 are all worthy of consideration by building
designers and owners. A recapitulation of these features and
Recommendations for New Construction
(a) prov ide wall and roof insulation. The optimum thickness
of insulation can be determined by energy analysis and
cost/benefit analysis.
(b) Provide a low fenestration/opaque wall ratio to minimize
winter heat loss and summer heat gain through the
trans-parent glazed areas.
(c) Use insulating window units, complete
reflective coatings. The optimum
facilitated by energy analysis
analysis.
with tinting and/or
selection can be
and cost-benefit
(d) Reclaim energy from waste streams leaving the building.
(e) Building mechanical systems and temperature control
systems should include the following design features
- an "economizer" cycle in the air-side temperature
control systems, Le. provide for "free cooling" using
outside air when conditions permit
- automatic duty cycling of mechanical equipment to match occupancy schedules
- night and weekend temperature set-back
- minimum outside air consistent with satisfying ventila-tion codes
- zero outside air when supply air systems must operate
during unoccupied hours
- dead-band thermostatic control in which neither
mechan-ical heating or cooling can occur during the
tempera-ture swings between the upper and lower dead-band range limi ts
- chilled water temperature reset in response to outside air temperature
- avoid supply air system types which rely on
simultan-eous heating and cooling to achieve controlled
conditions, e.g. terminal reheat and dual duct systems
(f) Do not over-illuminate interior areas.
(g) Provide minimum exterior lighting consistent with safety
and security requirements, and necessary advertising and
fea ture lighting requirements. Prov ide timer control of
(h) Consider the installation of demand limiting controls to
prevent excessive electrical demand charges. Loads such
as water heaters, secondary fan systems, and electric
preheaters can be delayed from operating in order to
limit demand.
Recommendations for Retrofits and/or Operational Improvements
The specific retrofits and operational improvements which have
been implemented at the Marsland Centre are unique to that
buildingIs design and operating parameters. Others may be
able to adapt them directly to their own situation due to
similarities in construction, systems, and occupancy. General
recommendations which emerge from the Marsland Centre study
are
(a) Provide for automatic cycling of mechanical equipment to
match occupancy requirements.
(b) Delamp (including ballast disconnection) where
over-illumination exists. Consider reducing area illumination
in favor of local task lighting which requires less
energy.
(c) If snow melting cannot be eliminated, provide for
auto-matic time-limited operation to ensure it is not
forgotten and left on.
(d) Consider automatic electric load-shedding controls to
control maximum electrical demand. Use manual load
shedding if automatic control cannot be justified.
(e) If feasible, reclaim energy from waste streams such as
warm exhaust. (A general rule of thumb which has emerged
is that exhaust volumes over 472 lis at 93°C [100 cfm at
200°F] to 2,360 lis at 21°C [5,000 cfm at 70°C] are most
easily justified.)
(f) Reduce minimum outside air settings to levels consistent
wi th minimum ventilation code requirements and occupant
comfort.
(g) Implement temperature control modifications
- dead-band operation
40
-night set-back of temperature in winter
- zero outside air during quite hours
- chilled water temperature reset
41
-ENERGY-EFFICIENT OFFICE BUILDINGS REPORT ON
THE REVENUE BUILDING
STE. foyセ
QuE.
by
Christian R. Roy, P.Eng. Les Consultants CRS Inc.
crs inc.
セ
expens consultorus
rneconique • eleanore • enerqie
REPORT ON AN ENERGY EFFICIENT OFFICE BUILDING
BY CHRISTIAN R. ROY OF LES CONSULTANTS CRS INC,
"THE REVENUE BUILDING IN STE.
foyセQUEBEC"
IT IS A GREAT HONOUR FOR ME TO HAVE THIS OPPORTUNITY
fa ADDRESS THE PRESTIGIOUS AND MOST COMPETENT AUDIENCE
CA rIIEI\[U lIL1n TODAY. IT I S ALSO A PLEASURE FOH ME TO
f'ヲhセ SEf\IT TilE ACHI EVE MEN TS 0 F FE LLOri DES IGNERSAN D
WISE BUILDING OPERATORS IN PRODUCING A BUILDING THAT
セffectively OPERATES WITH A SENSIBLE LOW ENERGY UflLIZATION FACTOR,
/
My
LXPOSE WILL COVER:-- FIRST) A SHORT DESCRIPTION OF THE BUILDING
ITSELF AND OF THE MOST SIGNIFICANT OF ITS