HAL Id: cea-01377138
https://hal-cea.archives-ouvertes.fr/cea-01377138
Submitted on 6 Oct 2016
HAL is a multi-disciplinary open access
archive for the deposit and dissemination of
sci-entific research documents, whether they are
pub-lished or not. The documents may come from
teaching and research institutions in France or
abroad, or from public or private research centers.
L’archive ouverte pluridisciplinaire HAL, est
destinée au dépôt et à la diffusion de documents
scientifiques de niveau recherche, publiés ou non,
émanant des établissements d’enseignement et de
recherche français ou étrangers, des laboratoires
publics ou privés.
Ba(Fe 1 – x Co x ) 2 As 2 and BaFe 2 (As 1 – x P x ) 2
D. Leboeuf, Y. Texier, M. Boselli, A. Forget, D. Colson, J. Bobroff
To cite this version:
D. Leboeuf, Y. Texier, M. Boselli, A. Forget, D. Colson, et al.. NMR study of electronic
correla-tions in Mn-doped Ba(Fe 1 – x Co x ) 2 As 2 and BaFe 2 (As 1 – x P x ) 2. Physical Review
B: Condensed Matter and Materials Physics (1998-2015), American Physical Society, 2014, 89 (3),
�10.1103/PhysRevB.89.035114�. �cea-01377138�
and is consequently related to the nature and strength of the electronic correlations present in the system. We study this polarisation using 75As NMR in Co-122 and both 75As and 31P NMR in
P-122. The NMR spectra of Mn-doped materials is made of two essential features. First is a satel-lite line associated with nuclei located as nearest neighbor of Mn impurities. The analysis of the temperature dependence of the shift of this satellite line shows that Mn local moments behave as isolated Curie moments. The second feature is a temperature dependent broadening of the central line. We show that the broadening of the central line follows the susceptibility of Mn local moments, as expected from typical RKKY-like interactions. This demonstrates that the susceptibility χ0(r) of FeAs layers does not make significant contribution to the temperature dependent broadening of the central line. χ0(r) is consequently only weakly temperature dependent in optimally doped Co-122 and P-122. This behaviour is in contrast with that of strongly correlated materials such as under-doped cuprate high-Tc superconductors where the central line broadens faster than the impurity
susceptibility grows, because of the development of strong magnetic correlations when T is lowered. Moreover, the FeAs layer susceptibility is found quantitatively similar in both heterovalent doped and isolvalent doped BaFe2As2.
PACS numbers:
I. INTRODUCTION
Superconductivity in Fe-based materials can be in-duced in a remarkable amount of fashions1:
car-rier doping2,3 (heterovalent substitution), chemical
pressure4,5 (isovalent substitution) and hydrostatic
pressure6. In each case the experimental phase dia-grams are very similar: magnetism becomes unstable as a function of the tuning parameter and superconduc-tivity arises around the magnetic instability. There is nonetheless a rich palette of variations from one material to the other, and physical properties such as supercon-ducting gap structure, superconsupercon-ducting critical temper-ature Tc, Fermi surface, magnetic ordered moments may
vary significantly7. Such variations appear as well in the
strength of electronic correlations present in those ma-terials. Different experimental signatures of those elec-tronic correlations have been reported, such as reduced kinetic energies8, enhanced masses9, deviations from
con-ventionnal (T1T )−1 Korringa law due to the presence of
AF spin fluctutations10,11. The strength of electronic
correlations assessed from those experimental findings vary significantly from one material to another12, and whereas mass enhancement (m?/mband) can reach 24 in
KFe2As213, it can be as low as 2 in LaFePO14.
The experimental observation of those variations raises
a central question in the field : can those systems fall un-der a universal description? The answer is not clear so far and basic issues about how strong are correlations within each family or iron-based superconductors, and how correlation strength may vary from one family to another are still not completly resolved. In order to de-termine the importance of electronic correlations in the description of those systems, it is necessary to perform experiments sensitive to correlation strength on different families of iron-based superconductors, and to compare those experiments with well established examples of ma-terials where correlations are significant.
Here we use NMR to study the strength of mag-netic correlations in two particular BaFe2As2 (122)
materials at optimal doping: heterovalent doped Ba(Fe1−xCox)2As2 (Co-122) with xCo ' 6.5% and
iso-valent doped BaFe2(As1−xPx)2 (P-122) with xP = 35%.
To do this we introduce diluted Mn impurities that sub-stitute to Fe. It has been shown that in Mn-doped BaFe2As2, that the hole carried by Mn does not
delo-calise but rather acts as a local moment15. This
impu-rity local moment induces a staggered spin polarization in its vicinity. This phenomenon has been studied ex-tensively in metals (RKKY interaction) and correlated materials16. The impurity induced staggered
polariza-tion can be probed using the NMR of nuclei neighboring
these local moments. The polarisation results in the ap-pearance of satellites on the sides of the central line and in a temperature dependent broadening ∆ν(T ) of the NMR spectrum which in the diluted regime is:
∆ν(T ) ∝ hSimp(T )i · yimp· f (χ0syst(r, T )) (1)
where hSimp(T )i is the thermodynamic average of the
impurity spin, yimp the impurity concentration and
f (χ0syst(r, T )) a function of the real part of the real space susceptibility of the system, which determines the am-plitude, the extension and the shape of the staggered spin polarization induced around the impurity. Knowing the temperature dependence of the susceptibility of the impurity local moments hSimp(T )i, one can access the T
-dependence of χ0syst(r). In a metal, it has been shown that RKKY interaction leads to a Lorentzian broaden-ing ∆ν(T ) that follows the T -dependence of the local moment susceptibility, because χ0syst(r) is mainly a con-stant as a function of T17. However in correlated
sys-tems, ∆ν(T ) can have a different T - dependence, due to the existence of magnetic correlations that imprint a T -dependence to χ0syst(r)18. Assuming that the presence
of the impurity does not locally affect the nature of the magnetic interactions, the NMR response in the vicin-ity of a local moment is consequently a good probe of magnetic correlations in a system.
Here we show that in the case of Mn-doped Co-122 and P-122, the broadening of the central line follows the sus-ceptibility of Mn local moments. This demonstrates that the susceptibility of FeAs layers is only weakly temper-ature dependent in both materials. This behaviour is in contrast with that of the underdoped cuprate supercon-ductor YBa2Cu2Oy, where the CuO2layer susceptibility
has a strong 1/T dependence18.
The Article is organized as follows. In sec. II, we de-scribe the samples studied here and the measurement technique used. In sec. III, we present the evolution of the NMR spectra as a function of Mn doping in both Co-122 and P-Co-122 materials. In sec. IV, we determine the susceptibility of Mn impurities local moments. In sec. V, we show that the broadening of the central line follows the susceptibility of Mn local moments, and from that we conclude that the susceptibiltiy of FeAs plane in Co-122 and P-Co-122 is only weakly temperature dependent. In sec. VI, we finally discuss the implications of this result and compare it with other probes of correlation strength in BaFe2As2.
II. SAMPLES AND METHODS
We studied 4 single crystals of Ba(Fe1−x−yCoxMny)2As2 (Co-Mn-122) with Co content
xCo ∼ 6.5% and Mn doping ranging from yMn = 0.65%
to yMn = 1.5% (see table I). The crystals were grown
using a self-flux method from a mixture of Ba and FeAs, CoAs and MnAs powders in the molar ratio 1:4-x-y:x:y. The mixtures were heated in evacuated quartz tubes at
Material x (%) yMn (%) Tc(K) Ba(Fe1−x−yCoxMny)2As2 6.5 0.65 18 7.5 0.9 13.5 6.0 1 12.5 6.5 1.5 8 Ba(Fe2−yMny)2(As1−xPx)2
35 0 30
35 1.5 16 35 3.0 < 2
TABLE I: Characteristics of the samples : Mn contents and superconducting transition temperatures Tcfor both
Co-Mn-122 and P-Mn-Co-Mn-122. In Co-Mn-Co-Mn-122, the growth technique de-scribed in the text yields homogeneous Mn content amongst different samples from the same batch, except for yMn= 0.65
where a variation yMn= 0.65 ± 0.15 was observed.
1180◦C for 6 hours, cooled down to 1000◦C at 6◦C/hour, then down to room temperature. Clean crystals of typical dimensions 5 × 5 × 0.05 mm3 were mechanically
extracted from the solid flux. Chemical analyses were performed with an electron probe (Camebax 50) on several crystals for each Co and Mn doping. SQUID measurements show that the superconducting transition temperature Tcdecreases by ∼ −9 K for every percent of
Mn (see table I), while staying well defined for all dop-ings. For the sake of clarity, most of the data presented here focus on samples with Mn doping yMn = 0.65%
and yMn = 1.5%, though nearly identical results were
obtained with the other samples.
Ba(Fe2−yMny)2(As1−xPx)2 (P-Mn-122) powders with
xP = 35% and with Mn doping yMn = 0%, yMn = 1.5%
and yMn = 3.0% were synthesized using a solid state
technique at 950◦C during 36 hours from a stoichiomet-ric mixture of Ba lumps, Fe, MnAs, P and As powders. The MnAs powder was prepared from a stoichiometric mixture of Mn and As powders heated in an evacuated quartz tube at 520◦C for 10 hours and then 870◦C for 10
hours. X-ray powder diffraction revealed a small amount of Fe2P and a minority phase of an unidentified iron
based compound. Thanks to the ability of NMR to adress and resolve nuclei originating from different phases, the presence of parasitic phases in the powders does not con-stitute an obstacle for the present study and can be ig-nored. The powders were then mixed with a standard two component epoxy. Using the anisotropy of the sus-ceptibility of iron pnictides and a rotating sample holder placed in a static 7.5 T magnetic field applied perpen-dicularly to the rotating axis of the sample holder, the crystals constituting the powder can be aligned while the epoxy hardens. As a result, the components of the pow-der are oriented such that their c-axis is perpendicular to the rotation axis. Success of the orientation procedure has been checked by measuring the angle dependence of the75As and31P NMR frequency when rotating the field with respect to the c-axis. Tc in P-Mn-122 decreases at
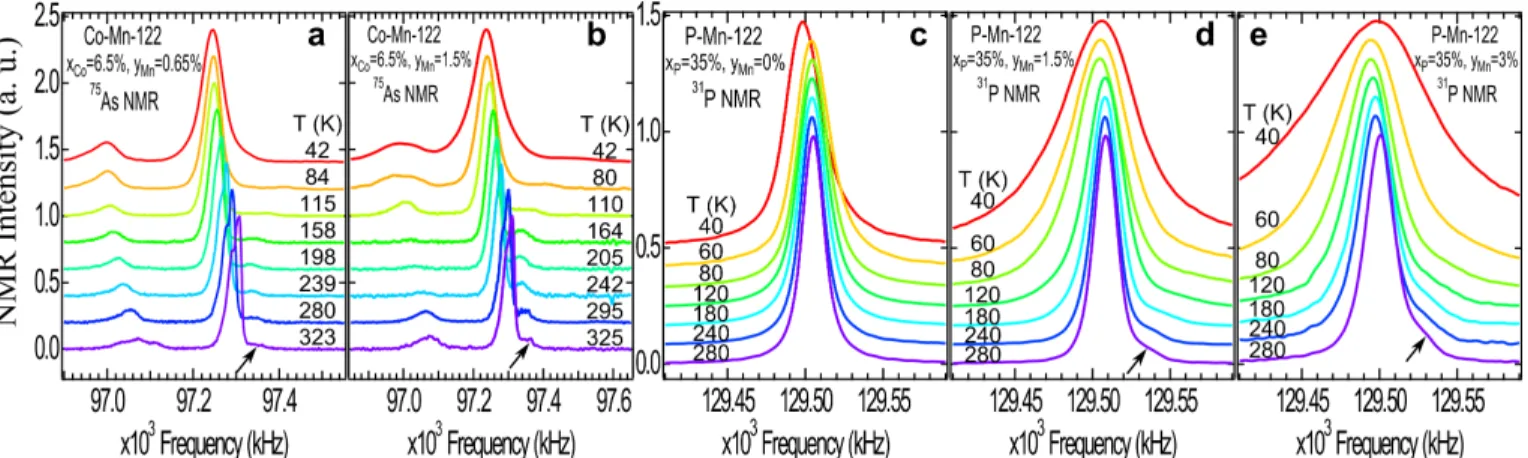
FIG. 1: (Color online) Pannels a and b: 75As NMR measured with H0 = 13.3 T, H0 k c, in Co-Mn-122 single crystals with
xCo = 6.5% yMn = 0.65% (pannel a) and yMn = 1.5% (pannel b). The main line develops a structure at high temperature
indicating that it is composed of several peaks with similar intensities. This structure might be a consequence of a modification of the hyperfine coupling or quadrupolar environment due to Co atoms. Pannel c, d and e: 31P NMR measured with H0= 7.5
T, H0 k c, in P-Mn-122 powders with xP = 35%, yMn = 0 (pannel c), yMn = 1.5% (pannel d), yMn= 3.0% (pannel e). In
pannels a,b,d and e, the arrow points to the satellite associated with As nuclei nearest neighbor to Mn atoms. In all pannels, curves are arbritarily shifted vertically for clarity.
yMn = 3.0% shows no sign of superconducting transition
down to 2 K (see table I).
75As NMR in Ba(Fe
1−x−yCoxMny)2As2 and
Ba(Fe2−yMny)2(As1−xPx)2 was performed with an
applied magnetic field of 13.3 T. 31P NMR was
mea-sured at 7.5 T. All the spectra were acquired for field applied along the c-axis and using a standard Fourier transform recombination after a π/2 − τ − π pulse sequence.
III. DESCRIPTION OF THE NMR SPECTRUM IN DOPED BaFe2As2
Figure 1 shows the temperature dependence of 75As NMR central line in Co-Mn-122 and 31P NMR central
line in P-Mn-122, for different Mn concentrations. 75As
NMR central line in Co-Mn-122 is splitted such that two additional peaks, associated with different local atomic environment, appear on each side of the main line (pan-nels a and b of figure 1). The low frequency peak is due to a modification of the second order quadrupole ef-fect in the vicinity of Co atoms and the high frequency peak (indicated by the arrows in fig. 1a,b) comes from a modification of the shift in the vicinity of Mn impuri-ties, as will be discussed below. 31P NMR central line in P-Mn-122 with yMn = 0 is not splitted (fig. 1c).The
introduction of Mn induces a splitting of the central line with a satellite appearing on the right hand side of the main line, as indicated by the arrows in fig. 1d, e.
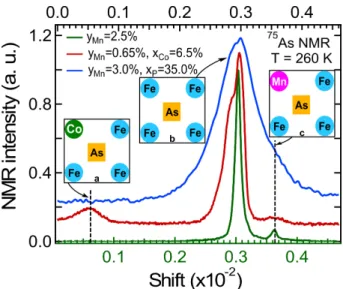
Let us first describe and explain in more detail the different features of the spectra shown in fig. 1. We do so with the help of figure 2 where we compare the
75As NMR central line in Mn doped materials:
Mn-122 ( Ba(Fe1−yMny)2As2) (green curve), Co-Mn-122 (red
curve) and P-Mn-122 (blue curve). Since 75As nuclear spin is I = 3/2, its NMR frequency depends on both local magnetic field and electric field gradients (EFG):
75ν = 75γ 2πH0+ 75γ 2πH0 75K + α ν 2 Q 75γH 0 (2) where νQ is proportionnal to the main axis EFG, α
de-pends on the orientation of the crystal with respect to H0 and on the asymmetry in the EFG and 75γ/2π =
7.2919 MHz/T is the gyromagnetic factor of 75As nu-cleus.
75K is the shift induced by the hyperfine interaction
between the As nuclei and the Fe electrons orbitals and spin susceptibilities. The frequency of the main central line of the75As NMR spectra originates from As nuclei located in regions far from any doping atom, a configu-ration sketched in fig. 2, inset b. In 122 materials, where one As nucleus is surrounded by 4 Fe atoms,75K is given
by:
75K
central= 4AFe· χ0Fe+ Korb (3)
with χ0Fe the Fe layer susceptibility probed far from any doping atom, AFe the hyperfine coupling between one Fe
and the As nucleus, and Korba temperature independent
shift due to orbital effects.
In Mn-doped 122, the NMR frequency of As nuclei located as nearest neighbor of Mn atoms (a situation de-picted in fig. 2, inset c) is modified. This results in the splitting of the NMR central line such that a satellite on the right-hand side of the main line appears (green curve in fig. 2). Eq.(2) indicates that this satellite may arise from a modification of75K or of the local EFG. A
previ-ous NMR study of Mn-122 has shown that the satellite shift is proportionnal to H0 and that it is therefore due
FIG. 2: (Color online) Typical75As NMR spectra at T = 260
K in Mn-122 compounds, measured with H0= 13.3 T, H0k c.
Pure Mn-122 (yMn= 2.5%) is shown in green (bottom axis)
and features a satellite on the right wing of the central line associated with As nuclei nearest neighbor to Mn, as sketched in inset c (from ref.15). Red curve (top axis) shows Co-Mn-122 with xCo= 6.5%, yMn= 0.65%. The satellite associated
with Mn is still visible (right hand side of central line), and an additional satellite due to the modification of the second order quadrupole effect of As nuclei nearest neighbor to Co atoms (inset a) appears on the left wing of the central line. Blue curve (top axis) shows P-Mn-122 with xP= 35%, yMn=
3.0%. The central line width has significantly increased in comparison to Co-Mn-122 because of higher disorder for xP=
35% than for xCo = 6.5%. The satellite associated with Mn
is still here, but is merged with the central line. Curves are shifted vertically.
By substituting Fe atoms with xCo= 6.5% Co atoms,
we get Co-Mn-122 which typical 75As NMR spectrum is
shown in red in figure 2. Co substitution has three main consequences that we will discuss now. Eq.(3) indicates that 75Kcentral depends on carrier population in Fe
or-bitals. The first consequence of Co subsitution is thus a shift of the75As NMR spectrum as observed in previous
work11. The second consequence of Co substitution is
the appearance of an additional satellite on the left-hand side of the central line, as shown in figures 1a, 1b and 2. This satellite originates from the modification of the second order quadrupolar contribution to the NMR shift (the last term in eq. (2)) in the vicinity of Co atoms, as shown earlier11. For symmetry reasons, α = 0 in the
spe-cific case of BaFe2As2, on the As atomic site, for H0k c,
so that the position of the central line does not depend on the EFG. However Co substitution locally breaks this symmetry and shifts the frequency of As nuclei located as nearest neighbor of Co atoms (inset a in fig. 2), giving rise to this low frequency satellite (see figure 2). This identi-fication is confirmed by the fact that the T -dependence of the shift of this satellite follows the T -dependence of the sift of the central line (see fig. 1a,b). The third
conse-quence of Co doping, is a broadening of the NMR lines, due to increased structural and electronic disorder in-duced by Co-doping. This broadening is however small enough so that both the position of the satellite line and the full width at half maximum of the central line can be followed as a function of temperature (see fig. 1a and b). Those quantities will be central for the discussion that follows in the next sections.
Finally, the blue curve in fig. 2 is a typical 75As NMR
spectrum for P-Mn-122, with xP = 35% and yMn = 3%.
Disorder is significantly increased in comparison to Co-Mn-122 with xCo = 6.5%. Now the high frequency
Mn-related satellite is merged with the central line. Signa-ture of this satellite is still slightly visible though in the asymmetry of the central line, with a higher weight on the right-hand side, where the satellite associated with As nuclei nearest neighbor to Mn atoms is expected. Note that there is no visible splitting due to second or-der quadrupolar effect. This can be a result of higher disorder than in Co-Mn-122, and/or of the fact that the As atomic sites are closer to Co atoms than to P atoms, meaning that this quadrupolar satellite could merge with the central line in the case of P-Mn-122. The fact that the
75As NMR frequency is sensitive to EFG disorder results
in a very broad line in the case P-Mn-122 sample, due to high P-doping level. This can be a major drawback in the study of the magnetic broadening of this line. To circumvent this problem we use31P NMR in P-Mn-122.
31P has a nuclear spin I = 1/2 and is hence insensitive
to EFG : 31ν = 31γ 2πH0+ 31γ 2πH0 31K (4)
with31γ/2π = 17.2356 MHz/T the gyromanetic factor of P nucleus. Figures 1c, 1d and 1e show the temperature dependence of31P NMR in P-Mn-122 for three different
Mn dopings. In the case of yMn= 0 and xP= 35.0%, the 31P NMR line width is31∆ν ∼ 20 kHz whereas the75As
NMR line width in the same sample is75∆ν ∼ 60 kHz.
31P NMR is thus a cleaner probe of magnetic braodening.
The31P NMR line width observed here is a factor ∼ 4.5
smaller than that observed previously in mosaic of single crystals10, demonstrating the quality of the powders and
the efficiency of our orientation procedure.
In the following we will study the Mn-induced broaden-ing of the75As NMR central line in Co-Mn-122 and that
of the75As and31P NMR central line in P-Mn-122. But
in order to understand these broadenings we first need to determine the susceptibility of the local moments carried by Mn impurities.
IV. DETERMINATION OF THE Mn LOCAL MOMENT SUSCEPTIBILITY
Texier et al.15used the temperature dependence of the Mn satellite shift75Ksat(T ) in order to determine the
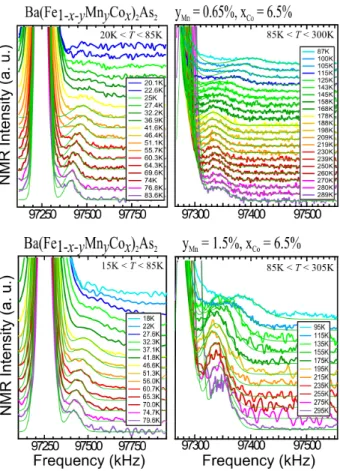
FIG. 3: (Color online) Zoom on the 75As NMR satellite associated with As nearest neighbor to Mn atoms in Co-Mn-122 with xCo = 6.5%, for 15 < T < 300 K, measured with
H0 = 13.3 T, H0k c. Green lines are fits to the experimental
data used to determine the shift of satellite line75K sat. Top
pannels : yMn = 0.65%. Bottom pannels : yMn = 1.5%.
In all cases, the satellite line merges with the main line for T . 50 K, preventing us to confidently determine the shift of the satellite line in this temperature range.
χ0Mn(T ) in Mn-122. We apply the same method to our data on Co-Mn-122. In the diluted limit, each As site participating to the high-frequency satellite intensity is hyperfine coupled to 1 adjacent Mn atom and 3 Fe atoms (see inset c in fig. 2) such that eq.(3) is modified in the following way: 75K sat = 3AFe· (χ0Fe+ ∆χ 0) + A Mn· χ0Mn+ K 0 orb (5) where χ0
Fe is the Fe susceptibility far from Mn, and ∆χ0
accounts for possible modification of this susceptibility in the vicinity of Mn. Combining this with eq.(3), assuming that AFeis unaffected and that ∆χ0 ∝ χ0Mn leads to:
χ0Mn(T ) ∝ 75Ksat(T ) − 3 4 75K central(T ) + Korb00 (6) with K00
orb = 3/4Korb − Korb0 , a T -independent orbital
term. We first determine75Ksat by fitting the spectra of
fig. 1a,b. Fig. 3 shows a zoom of the satellite and the fits to the spectra used to determine 75K
sat(T ). χ0Mn(T ) is
FIG. 4: (Color online) Determination of Mn impurity local moments susceptibility χ0Mn in Co-Mn-122 (xCo = 6.5%) for
yMn = 0.65% (red) and yMn = 1.5% (blue). a) χ0Mn(T )
de-termined with the75As NMR shift. Continuous and dashed black lines are fits to the data with a Curie-Weiss model y0+ C/(T + θ) with θ respectively fixed to 0 and 40 K. b)
χ0Mn(T ) determined with macroscopic susceptibility
measure-ments where the Fe layer contribution to the homogeneous susceptibility, namely χ0Fe(T ) ∝
75
Kcentral(T ) has been
sub-tracted. Black lines are fits to the data with a Curie law y0+ C/T .
then computed and plotted in fig. 4a. The errorbars in-crease considerably when the temperature is lowered be-cause both the satellite and the main line broaden faster than they shift apart. For T . 50 K the satellite line merges with the main line such that the shift of the satel-lite line cannot be reliably determined anymore. The fact that curves for yMn = 0.65% and yMn = 1.5% overlap
shows that the Mn induced polarisation does not depend on Mn concentration, and is evidence that As nuclei are coupled to at most 1 Mn atom. Additionnal confirmation that the Mn content is within the diluted regime comes from the Mn-doping dependence of the intensity ratio be-tween the satellite and the central line, which follows the probability law of finding As atoms with exactly one Mn nearest neighbor15. χ0
temperature dependence to what was observed earlier in Mn-12215. A Curie-Weiss fit to χ0
Mn(T ) gives θ = 20 ± 20
K. Such a low value of θ, and independent of Mn doping, indicates that Mn-Mn interactions are weak.
This is further confirmed by an analysis of the macroscopic susceptibility of Co-Mn-122 samples mea-sured by SQUID. By subtracting the Fe contribution to the macroscopic homogeneous susceptibility, namely χ0Fe(T ) ∝ 75Kcentral(T ), one can derive the Mn
contribu-tion to this macroscopic susceptibility (see Appendix A for details). The resulting macroscopic χ0Mn(T ) is shown in fig. 4b. The data fits nicely to a Curie model (black lines in fig. 4b). A Curie-Weiss fit to those data would yield θ = 0 ± 10 K. In a Curie model χ0(T ) = y0+ C/T ,
C is proportionnal to µ2
eff, with µeff = gpS(S + 1) the
magnetic moment carried by the Mn impurity. Fits to the data of fig. 4b give µeff = 1.63 ± 0.3µB for all samples.
This value is in agreement with µeff = 1.73 calculated for
a spin S = 1/2 and g = 2, as expected in a case where each Mn atom carries one localized hole.
In summary, this study of the Mn local moment sus-ceptibility is consistent with a scenario where each Mn atom carries a local S = 1/2 moment, and where those local moments are only weakly coupled to each other, and behave as isolated Curie moments.
V. CENTRAL LINE BROADENING The analysis of the shift of the NMR spectral weight originating from the population of 75As nuclei located
as nearest neighbors to Mn impurities, namely the high frequency satellite in fig. 1a,b and 3, allowed to determine the T -dependence of the Mn local moments susceptibility.
75As nuclei located further away from Mn impurities do
not contribute to the satellite amplitude, but rather to the central line broadening ∆ν(T ). In combination with χ0Mn(T ), the determination of ∆ν(T ) allow to reveal the FeAs layer susceptibility χ0Fe(T, r) (see eq.(1)), and the strength of magnetic correlations in Mn-doped Co-122 and P-122.
We measure the full width at half maximum ∆ν(T ) of
75As NMR central line in Co-Mn-122 and of both 75As
and 31P NMR central lines in P-Mn-122. In order to
isolate the Mn-induced broadening from over sources of broadening, we subtract the line width measured at the highest T (where the Mn impurity contribution to the line width becomes negligeable) to the measured ∆ν(T ). The resulting quantity, normalized by the Mn content yMn, is plotted in figure 5a in the case 75As NMR for
Co-Mn-122 and P-Mn-122 and in figure 5b in the case of31P NMR for P-Mn-122. In each case, the normalized
∆ν(T ) obtained for different Mn contents overlap, con-firming the linear dependence of ∆ν(T ) on yMnindicated
in eq.(1).
A Curie model nicely reproduces the temperature de-pendence of ∆ν(T ) in Co-Mn-122, as shown by the red line in fig. 5a. It indicates that ∆ν(T ) follows the same
FIG. 5: (Color online) Central line broadening plotted as (∆ν − ∆νhigh−T)/yMn. a) From 75As NMR spectra in both
Co-Mn-122 (dark and light blue markers) and P-Mn-122 (black and green squares). b) From31P NMR spectra in P-Mn-122. In both pannels, red dashed line is a least square y0+ C/T2 fit to the data and red continuous line is a least
square Curie law y0+ C/T fit to the data. While75As NMR
∆ν(T ) is best reproduced by a Curie model in both cases. Incompatibility with the 1/T2 fit is more obvious in the case
of ∆ν(T ) deduced from31P NMR in P-Mn-122.
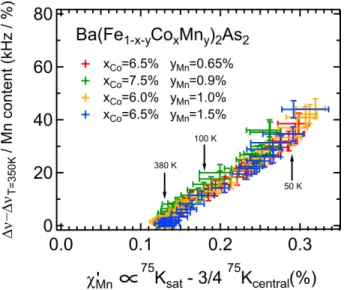
T -dependence as χ0Mn(T ). Figure 6 shows the central line broadening ∆ν as a function of χ0Mn determined earlier in fig. 4a. Within the errorbars, the two quantities track each other in a linear fashion. There is no strong devi-ation from proportionality between ∆ν(T ) and χ0
Mn(T ).
This indicates that the magnetic susceptibility of FeAs layers χ0Fe(T ) is only weakly temperature dependent in Co-Mn-122.
In P-Mn-122, we have not been able to determine χ0Mn(T ) via Ksat because the high frequency satellite is
merged with the central line, even in31P NMR spectra
(see fig. 1d,e). We assume that χ0
Mn(T ) in P-Mn-122
fol-lows a Curie law T -dependence just as in Co-Mn-122. Two facts make this assumption reasonable. First, Mn acts as local moment in P-122, just as in Co-122 (no modification of the Knight shift as function of Mn dop-ing, broadening of the central line, appearance of a satel-lite at the same position as in Co-Mn-122 in75As NMR spectra, see fig. 2, as a consequence of the polarization around the Mn local moments). Second, Mn contents
FIG. 6: (Color online) 75As NMRcentral line broadening plotted as a function of the Mn local moments susceptibility χ0Mn(T ) derived from75As NMR satellite shift, for all
Co-Mn-122 samples studied here. This plot shows that, within error-bars, ∆ν(T ) ∝ χ0Mn(T ), such that the FeAs layer
suscpetibil-ity has a very weak T -dependence. There is remarkable agree-ment for all Co and Mn contents, indicating that Mn doping is within the diluted regime and that magnetic correlations are not dependent on carrier concentration within the errorbars.
studied here in P-Mn-122 are within the same range of concentration studied in Co-Mn-122, such that the ef-fects of Mn on the spectrum are also proportional to Mn content in the case of P-Mn-122 (ratio of the satellite in-tensity with respect to central line inin-tensity, and central line broadening proportionnal to yMnas shown in fig. 5a
and b).
Based on this assumption, the fact that ∆ν(T ) from
75As NMR in P-Mn-122 is quantitatively identitical to
∆ν(T ) from 75As NMR in Co-Mn-122, as plotted in fig. 5a, shows that χ0Fe(T ) is quantitatively similar in P-122 and Co-122. χ0Fe(T ) is thus weakly T -dependent in both heterovalent and isovalent-doped 122. It also suggests that magnetic correlations have comparable strength in both materials such that χ0Fe(T ) appears to be insensitive to the number of carriers in the system. 31P
NMR can be used to confirm the temprature dependence of ∆ν(T ) in P-Mn-122. The absence of quadrupolar ef-fect in31P NMR makes it a cleaner probe of magnetism.
As plotted in fig. 5b, 31P NMR central line broaden-ing follows a Curie model almost perfectly. 31P NMR
shows more compelling evidence that χ0Fe(T ) is weakly T -dependent and strengthens the results derived from
75As NMR.
VI. DISCUSSION
Studies of magnetic correlations using the NMR of nu-clei located in the vicinity of an impurity have been
per-derdoped cuprates. In the overdoped regime, the 1/T dependence of the broadening is lost and a more conven-tionnal 1/T law is recovered19.
In figure 5 we compare ∆ν(T ) of both75As NMR and 31P NMR with a fit of the form y
0+ C/T2 (dashed red
line). Departure from this 1/T2 dependence is observed
in both cases though more strikingly for31P NMR. While
a 1/T dependence nicely reproduces the data, a 1/T2 dependence is clearly incompatible with our data. We thus conclude that both isovalent and heterovalent doped 122 materials lie closer to a conventionnal metal or an overdoped cuprate than to an underdoped cuprate, in terms of correlation strength as inferred from this NMR technique.
Numerical simulations of the NMR spectrum of Co-Mn-122 were performed in order to determine the shape and the spatial extension of the staggered polarization in the vicinity of Mn impurities (see Appendix B). The best simulations are achieved when AF correlations are turned on, whether at Qstripe= (12,12) or QN´eel= (1, 0)
(in r.l.u. with respect to the tetragonal structure). The staggered magnetization around the impurity rapidly de-creases as a function of distance to the impurity, typically extending over λ ∼ 3-5 units of in-plane lattice param-eter, or λ = 22 ± 5˚A. This characteristic length can be compared to some extent with the AF correlation length ξ found in inelastic neutron scattering (INS). In Co-122, with xCo = 15%, the 9.5meV INS AF peak at T = 40 K
has a finite width that corresponds to ξ = 20 ± 4 ˚A20, comparable to the spatial extension of the staggered po-larization we measured here in real space by NMR. More-over, we found that for yMn= 0.65% we can simulate the
temperature dependence of the spectrum by simply con-sidering the 1/T dependence of χ0Mn while keeping the spatial extension λ constant and equal to 4 units of in-plane lattice parameter (see fig. 8b and 8c). This is con-sistent with our previous conclusion drawn from fig. 5: magnetic correlations in the FeAs plane are only weakly T -dependent.
Short range, weakly temperature dependent AF corre-lations seem to be the origin of the75As NMR central line
broadening in Co-Mn-122. In fig. 5a we see that ∆ν(T ) is almost identical in both Co-Mn-122 and P-Mn-122. This suggests that the very same short range, weakly T -dependent AF correlations exist in both heterovalent
and isovalent doped BaFe2As2, around optimal doping.
This similarity between the two systems adds up to an increasing list of others: similar maximum Tc (25 K for
Co-122, 30 K for P-122), similar thermodynamic phase diagrams and similar coupling of magnetism and super-conductivity to the lattice21. (T1T )−1 measured with 75As NMR in Co-122 is also found to be very similar to
(T1T )−1 measured with 31P NMR in P-12210,11. A
re-markable resemblance between the two compounds and yet very different tuning parameters (chemical pressure vs carrier doping) and very different levels of disorder (as illustrated in fig. 2 by the width of the75As NMR central line). Authors of ref.21 argue those similiraties might be
related to the fact that Co and P doping act similarly on the Fe-As(P) bond length, which has been shown to be a central parameter to control Tc and to suppress
mag-netism (ref.21,22and ref. therein). Our results are consis-tent with such an explanation: they indeed suggest that AF correlations, which are believed to be the underlying architects of the phase diagrams of those systems, do not depend on charge carrier doping. Nonetheless there is at least one dissimilarity between the two systems: they have different superconducting gap structures. Indeed while Co-122 is fully gapped around optimal doping23,
line nodes were found in the superconducting gap of op-timally doped P-12224. Our results suggest that this
dif-ference in gap structure cannot be accounted for by a difference in magnetic correlation strength.
Finally we compare our results with other probes of correlation strength in 122 materials. Yang et al.25
performed x-ray absorption (XAS) and resonant inelas-tic x-ray scattering (RIXS) measurements in BaFe2As2
that showed remarkable similarity with Fe-based met-als while showing only poor comparability with Fe-oxide insulators, highlitghing the itenerant character of iron-pnictides. They then extracted from their spectra a value of the Coulomb repulsion U , and Hund’s coulping JHund:
U ∼ W > JHund, with W the bandwidth, indicating
the existence of only moderated electronic correlations. Qazilbash and coworkers8 used the ratio of kinetic en-ergy of the electron extracted from optical conductivity data Kexpto the kinetic energy computed from band
the-ory Kband. They found that the value of Kexp/Kbandin
BaFe2As2 is similar to Kexp/Kband in ovderdoped
high-Tccuprates. Our study of electronic correlation strength
with NMR is in agreement whith those findings.
Probes of correlation strength in 122 materials in-dicate that they feature only moderated correlations, weaker than in underdoped cuprates superconductors. However, high value of Sommerfeld coefficient and mass enhancement of certain bands derived from quan-tum oscillations in KFe2As2 suggest electronic
correla-tions may be stronger in the case of hole-doped 122 materials13,26,27. Recent theoritical work proposed that
hole-doped KFe2As2 is more correlated than
electron-doped Co-122 because it stands closer, in terms of band filling, to an orbital-selective Mott transition driven by Hund’s coupling between the different orbitals at play28.
The significant variation of band renormalization from one band to another observed in KFe2As2 is supporting
evidence for proximity to this selective Mottness. This scenario calls for an experimental investigation of correla-tion strength in KFe2As2, and comparisons with the work
achieved here in Co-122 and P-122 using NMR might help quantify and understand the evolution of electronic correlations in different iron-based superconductors.
VII. SUMMARY
We studied the strength of electronic correlations around optimal doping in both isovalent doped (P-122) and heterovalent doped (Co-122) BaFe2As2. To do so,
we introduced local magnetic moments carried by diluted Mn impurities that polarise the FeAs plane in its vicinity. This polarization results in the appearence of a satellite and in a broadening of the NMR spectra that we mea-sured with75As NMR in Co-122 and with both75As and
31P NMR in P-122. We used the satellite shift to
demon-strate that the Mn impurity local moments behave as nearly isolated free moments. We then studied the T -dependence of the NMR line width and showed that it follows the T -dependence of the Mn-impurity susceptibil-ity in both Co-122 and P-122. This behaviour indicates that magnetic correlations are only weakly T -dependent in both materials. Moreover, the quantitative agreement between the T -dependent NMR line broadening found in P-122 and Co-122 suggests that those magnetic cor-relations are independent of carrier doping. Numerical simulations of the 75As NMR spectrum of Co-Mn-122 show that AF correlations, extending over 3-5 units of in-plane lattice parameters, reproduce satisfactorily the experimental data.
The T -dependence of the NMR line broadening ob-served here is in contrast with that obob-served in under-doped cuprate, where the CuO2layer susceptibility
mea-sured with NMR in the vicinity of impurities shows a sig-nificant T -dependence, due the development of strong AF correlations as a function of temperature. We conclude that both isovalent and heterovalent doped 122 materi-als lie closer to a conventionnal metal or an overdoped cuprate than to an underdoped cuprate, in terms of cor-relation strength as inferred from this NMR technique.
Appendix A: Determination of the macroscopic susceptibility of Mn local moments
Here we explain in more details the method we use to extract the Mn local moments contribution to the macro-scopic susceptibility of Co-Mn-122. Magnetization mea-surements were performed up to 7 T using a Magnetic Properties Measurement System (MPMS) produced by Quantum Design. Isothermal M (H) curves were mea-sured and showed linear behaviour in the temperature range we focus on. Fits to M (H) allow to extract the
FIG. 7: (Color online) Illustration of the method for the ex-traction of the macroscopic susceptibility of Mn local mo-ments, using SQUID and NMR measurements. Green squares (left axis): sample (raw) macroscopic susceptibility obtained using the slope of M (H) isotherms measured with SQUID. Blue circles (left axis): Mn local moments susceptibility con-tribution to the sample macroscopic susceptibility. It is ob-tained by subtracting the FeAs layer susceptibility, measured here with the shift75K of the central NMR line in the same
sample of Co-Mn-122 (red triangles, right axis), to the sample macroscopic susceptibility (green squares).
macroscopic susceptibility of the sample as a function of T , that is plotted in fig. 7 (green squares) for Co-Mn-122 with xCo = 6.5%, yMn= 1.5%. The sample susceptibility
is mainly the sum of two contributions: the FeAs layer susceptibility and the Mn local moments susceptibility. The FeAs layer susceptibility is measured in the same sample using NMR: it is given by75K(T ), the shift of the central line of fig. 1a,b, shown with red triangles in fig. 7 for xCo = 6.5%, yMn = 1.5%. By subtracting 75K(T )
(suitably multiplied by a factor such that75K(T ) and the
sample macroscopic susceptibility overlap for T > 200 K) to the sample macroscopic susceptibility (green squares in fig. 7), we obtain the Mn local moments contribution, shown with blue circles in fig. 7.
Appendix B: Simulations of the NMR spectrum We can elaborate to some extent about the shape and the spatial extension of the staggered magnetization in-duced in the vicinity of the Mn local moment by simu-lating the NMR spectrum. We do so in the case of75As
NMR in Co-Mn-122, following some of the methodology developed earlier in the case high-Tc cuprate YBCO19.
The idea is to compare the simulated spectra given by a set of models and to find which model best reproduce the important features of the experimental data.
We simulate the NMR spectra under the assumptions that Mn concentration is within the diluted regime such that one As nucleus is nearest neighbor to at most one Mn atom, and such that the effect of several Mn atoms
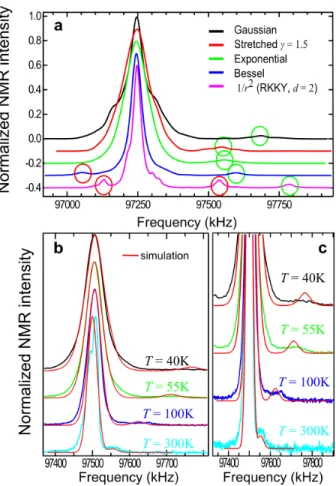
FIG. 8: Simulations of75As NMR in Co-Mn-122 with yMn=
0.65% and xCo = 6.5%. a) Simulated spectra obtained with
different forms of polarisation (see text). Green circles high-light the satellite line which would be compatible with the experiment. Models giving rise to more than one satellite line (red circles) are not compatible with the experimental data. b) Experimental spectra (H0 = 13.3 T, H0 k c) at
differ-ent temperatures compared with simulations obtained with
fStretched, γ = 1.5, Q = Qstripeand λ = 4 (red lines). A zoom
on the satellite line is shown in pannel c.
on the Fe electronic susceptibility is additive. Such as-sumption has been checked experimentally (see figures 4, 5 and 6). In these simulations, we ignore the effect of Co substitution, since they mainly affect the local EFG environment of As nuclei. We assume that the hyper-fine coupling between As nuclei and Fe atoms is isotrope. We compute the staggered magnetization in the FeAs layer and the resulting simulated spectra are convoluted with a Gaussian function to account for other sources of broadening that are already present in Co-122 without Mn doping.
We used two classes of model of the staggered mag-netisation close to the impurity local moment, that we will discuss now.
RKKY model
The first class of model relies on a RKKY interaction. For a two-dimensionnal interaction, the staggered mag-netization in the vicinity of the magnetic impurity takes
the general form29:
mFe(kF, r) ∝
cos(2kF(r − 1) + φ)
r2 (B1)
with kFthe Fermi wavevector, r the distance to the
impu-rity and φ a phase we choose to be zero. Eq.(B1) is how-ever not appropriate in the case of a multi-band system. The simulated spectra strongly depends on the value of kFbut systematically feature more than one satellite line,
in disagreement with the experiments.
Phenomenological models with AF correlations In this second class of model, we assume that the nat-ural tendency of iron-pnictides towards the formation of AF order should appear in the shape of the staggered magnetisation such that:
mFe(Q, r, λ) ∝ cos(2QAF· r) · f (r, λ) (B2)
with QAF the wavevector at which AF correlations are
maximum, r the vector coordinate of each atomic site in a coordinate system where the Mn impurity seats at the origin, λ a characteristic length controling the spatial extension of the staggered magnetization, and f (r, λ) a function for the spatial damping of the stag-gered magnetisation. We simulated NMR spectra with several f (r, λ):
fBessel(r, λ) =
Yk(0, r/λ)
Yk(0, 1/λ)
(B3) with Yk a Bessel function of the second kind.
fGaussian(r, λ) = exp − r − 1 2λ/√2ln2 !2 (B4) fStretched(r, λ) = exp − r − 1 2λ/(2ln2)1/γ !γ (B5) fExponential(r, λ) = exp − r − 1 2λ/2ln2 ! (B6)
In all the models mentionned above, we allow for a dif-ference between the magnitude of the moment carried by
Mn impurity and the moment carried by nearest neighbor Fe atoms.
Comparison to the data
We now compare the different simulations we get from the different models of the staggered magnetisation we considered with the experimental spectra. There are two main constraints that allow to eliminate models which are not compatible with the data: first is the number of satellite lines, second is the shape and width of the central line. Fig. 8a shows the simulated spectra for the different models exposed above. Amongst those models, three can already be discarded because they show more than one satellite line. Moreover, a simulation based on fGaussian
do not yield a satisfactory shape for the central line. In the end, the model that best reproduces the experimental spectra is based on AF correlations at Qstripe, with a
damping function given by eq.(B5) with γ = 1.5 and λ ∼ 3 − 5 units of in-plane lattice parameter.
Using this particular model (fStretched, γ = 1.5, Q =
Qstripe and λ = 4), and taking into account the 1/T
de-pendence of χ0Mn(T ), we were able to simulate the tem-perature dependence of the75As NMR spectrum in
Co-Mn-122 with yMn = 0.65% and xCo= 6.5%, as shown in
fig. 8b,c. Both the width of the central line and the satel-lite shift of the experimental spectra are well reproduced by this specific model.
These simulations do not however constitute a demon-stration that the model we favour here (fStretched, γ =
1.5, Q = Qstripeand λ = 4) is the only model that could
describe the data. Other models we did not consider here may work as well. Nonetheless, this approach allows to theorize the basic electronic correlations required to de-scribe the NMR spectra, and since all models compatible with our data give a consistent value for λ, it also allows to constrain the spatial range of those correlations.
Acknowledgements
The authors would like to thank H. Alloul, F. Bert, V. Brouet, P. Mendels, F. Rullier-Albenque for construc-tive discussions, S. Poissonnet (SRMP/CEA) for chemi-cal analysis on the crystals and A. Larcelet for help with the experimental setup. We acknowledge support from the French ANR PNICTIDES.
1
J. Paglione and R. L. Greene, Nat. Phys. 6 645 (2010)
2
M. Rotter, M. Tegel and D. Johrendt, Phys. Rev. Lett. 101 107006 (2008)
3
A. S. Sefat, R. Jin, M. A. McGuire, B. C. Sales, D. J. Singh and D. Mandrus Phys. Rev. Lett. 101 117004 (2008)
4 S. Jiang, H. Xing, G. Xuan, C. Wang, Z. Ren, C. Feng,
J. Dai, Z. Xu and G. Cao, J. Phys.: Condens. Matter. 21 382203 (2009)
5 S Sharma, A. Bharathi, S. Chandra, V. R. Reddy, S.
Paulraj, A. T. Saya, V. S. Sastry, A. Gupta and C. S. Sundar, Phys. Rev. B 81 174512 (2010)
6 P. L. Alizera, Y. T. Chris Ko, J. Gillett, C. M. Petrone,
J. M. Cole, G. G. Lonzarich and S. E. Sebastian, J. Phys.: Condens. Matter 21 012208 (2009)
7 D C. Johnston, Adv. Phys. 59 803 (2010) 8
M. M. Qazilbash, J. J. Hamlin, R. E. Baumbach, Lijun Zhang, D. J. Singh, M. B. Maple and D. N. Basov, Nat. Phys. 5 647 (2009)
Y. Kohori, H. Harima and S. Uji, J. Phys. Soc. Jpn. 79 053702 (2010)
14 A.I. Coldea, J.D. Fletcher, A. Carrington, J.G. Analytis,
A.F. Bangura, J.-H. Chu, A.S. Erickson, I.R. Fisher, N.E. Hussey, and R.D. McDonald, Phys. Rev. Lett. 101 216402 (2008)
15 Y. Texier, Y. Laplace, P. Mendels, J. T. Park,l G. Frieme,
D. L. Sun, D. S. Inosov, C. T. Lin and J. Bobroff, Euro-phys. Lett. 99 17002 (2012)
16 H. Alloul, J. Bobroff, M. Gabay and P. J. Hirschfeld, Rev.
Mod. Phys. 81 45108 (2009)
17
R. E. Walstedt and L. R. Walker, Phys. Rev. B 9 4857 (1974)
18
J. Bobroff, H. Alloul , Y. Yoshinari, A. Keren, P. Mendels, N. Blanchard, G. Collin and J.-F. Marucco, Phys. Rev. Lett. 79 2117 (1997)
19 S. Ouazi, J. Bobroff, H. Alloul and W. A. MacFarlane,
Phys. Rev. B. 70 104515 (2004)
20
D. S. Inosov, J. T. Park, P. Bourges, D. L. Sun, Y. Sidis, A. Schneidewind, K. Hradi, D. Haug, C. T. Lin, B. Keimer and V. Hinkov, Nat. Phys. textbf6 178 (2010)
21
A E. B¨ohmer, P. Burger, F. Hardy, T. Wolf, P. Schweiss, R. Fromknecht, H. v. L¨ohneysen, C. Meingast, H. K. Mak, R. Lortz, S. Kasahara, T. Terashima, T. Shibauchi and Y. Matsuda, Phys. Rev. B 86 094521 (2012)
22 V. Zinth and D. Johrendt, Europhys. Lett. 98 57010 (2012) 23
J-P. Reid, M. A. Tanatar, X. G. Luo, H. Shakeripour, N. Doiron-Leyraud, N. Ni, S. L. Budko , P. C. Canfield, R. Prozorov, and L. Taillefer, Phys. Rev. B 82 064501 (2010)
24 K. Hashimoto, M. Yamashita, S. Kasahara, Y. Senshu, N.
Nakata, S. Tonegawa, K. Ikada, A. Serafin, A. Carrington, T. Terashima; H. Ikeda, T. Shibauchia and Y. Matsuda, Phys. Rev. B 81 220501(R) (2010)
25
W L. Yang, A. P. Soni, C.-C. Chen, B. Moritz, W.-S. Lee, F. Vernay, P. Olalde-Velasco, J. D. Denlinger, B. Delley, J.-H. Chu, J. G. Analytis, I. R. Fisher, Z. A. Ren, J. Yang, W. Lu, Z. X. Zhao, J. van den Brink, Z. Hussain, Z.-X. Shen and T. P. Devereaux, Phys. Rev. B 80 014508 (2009)
26 H. Fukazawa, Y. Yamada, K. Kondo, T. Saito, Y. Kohori,
K. Kuga, Y. Matsumoto, S. Nakatsuji, H. Kito, P. M. Shi-rage, K. Kihou, N. Takeshita, C. H. Lee, A. Iyo, and H. Eisaki, J. Phys. Soc. Jpn. 78 083712 (2009)
27 F. Hardy, A. E. B¨ohmer, D. Aoki, P. Burger, T. Wolf, P.
Schweiss, R. Heid, P. Adelmann, Y. X. Yao, G. Kotliar, J. Schmalian, and C. Meingast Phys. Rev. Lett. 111 027002 (2013)
28
L. de’ Medici, G. Giovannetti and M. Capone, preprint at arXiv:1212.3966