Direct correlation between aromatization of carbon-rich
organic matter and its visible electronic absorption edge
The MIT Faculty has made this article openly available. Please share how this access benefits you. Your story matters.
Citation Ferralis, Nicola; Liu, Yun; Bake, Kyle D.; Pomerantz, Andrew E. and Grossman, Jeffrey C. “Direct Correlation Between Aromatization of Carbon-Rich Organic Matter and Its Visible Electronic Absorption Edge.” Carbon 88 (July 2015): 139–147 © 2015 Elsevier Ltd
As Published http://dx.doi.org/10.1016/j.carbon.2015.02.075
Publisher Elsevier
Version Final published version
Citable link http://hdl.handle.net/1721.1/110575
Terms of Use Creative Commons Attribution-NonCommercial-NoDerivs License
1
Direct correlation between aromatization of
carbon-rich organic matter and its visible electronic
absorption edge
Nicola Ferralis a,*
, Yun Liu a
, Kyle D. Bake b
, Andrew E. Pomerantz b
, Jeffrey C. Grossman a
a
Department of Materials Science & Engineering, Massachusetts Institute of Technology,
Cambridge, Massachusetts, United States
b
Schlumberger-Doll Research, Cambridge, Massachusetts, United States
The evolution of the electronic absorption edge of type I, II and III kerogen is studied by diffuse
reflectance UV-Visible absorption spectroscopy. The functional form of the electronic
absorption edge for all kerogens measured is in excellent agreement with the "Urbach tail"
phenomenology. The Urbach decay width extracted from the exponential fit within the visible
range is strongly correlated with the aliphatic/aromatic ratio in isolated kerogen, regardless of the
kerogen type. No correlation is found between the decay width and the average size of aromatic
clusters, which is explained in terms of a non-linear increase in optical absorption with
increasing size of the aromatic clusters determined by 13C NMR. Further, absorption spectra
calculated with density functional theory calculations on proxy ensemble models of kerogen are
*
2 in excellent agreement with the experimental results. The correlation of the decay width with
conventional maturity indicators such as vitrinite reflectance is found to be good within a
particular kerogen type, but not consistent across different kerogen types, reflecting systematic
variations in bulk composition for different type kerogen types with the same vitrinite
reflectance. Thus, diffuse reflectance visible absorption spectroscopy is presented as a rapid,
calibrated and non-destructive method to monitor both the maturity and the chemical
composition of kerogen. The chemical insight of kerogen in relation to its optical absorption
provided by this methodology may serve for rapid screening of kerogen for electronics and
optical devices in place of functionalized produced carbon.
1. Introduction
Resurgence in interest in the fundamental chemistry of carbon-rich organic matter has been
driven by the recent revolution in oil and gas production from organic-rich mudstones,
commonly referred to as organic shales[1, 2]. Despite the attention, the molecular chemistry of
the insoluble organic matter from these rocks (known as “kerogen”) is poorly understood [3].
Kerogen is a carbon-rich organic compound often categorized into three classes. Type I is
typically derived from lacustrine sources and may contain the highest hydrogen:carbon (H:C)
ratio, Type II is typically derived from marine sources and contains moderate H:C ratio, and
Type III is typically derived from terrestrial sources and contains low H:C ratio[4-6]. Beyond the
source material, the composition of kerogen is impacted by thermal processes occurring in the
subsurface (known as “catagenesis”, Fig 1)[7], resulting in a rich and complex framework of
carbon-rich organic material, plus fluid hydrocarbons that comprise oil and gas. The extent to
which kerogen has been altered by these processes (known as kerogen “thermal maturity”,
3 Common methods of estimating thermal maturity are informative but involve a compromise
between accuracy, level of detail, and simplicity[4]. Some methods can quantify maturity but
provide no direct characterization of chemical composition (for example, vitrinite reflectance,
VRo [10, 11] or Rock-Eval pyrolysis[12, 13]). Chemically specific methods (such as 13
C NMR
[14] or elemental analysis) require destructive sample preparation (kerogen isolation through
acid demineralization[12, 15]) that is significantly more time consuming than the measurement
itself. Furthermore, such alterations to the samples limit the ability to correlate the molecular
composition with the local mineralogy.
Figure 1. Van Krevelen diagram (modified from [6]) highlighting the biological origin of each kerogen type. The shaded area indicates the catagenesis window[6], where biological material is transformed into carbon-rich organic matter under pressure and temperature: thermal maturation.
4 The importance of understanding the maturity and composition of kerogen motivates new
approaches to accurately and non-destructively characterize its detailed chemical structure.
Inspired by the role played by the conjugation length and configuration in the optical absorption
of aromatic systems, we present a combined experimental and computational approach based on
UV-Visible absorption spectroscopy to relate the maturity of kerogen with its conjugation
configuration and chemical structure. Benefitting from similar methods that have been used
characterize hydrocarbon fluids[16], we employ calibrated techniques that use the Urbach tail
phenomenology [17] (described by the exponential dependence of the coefficient of optical
absorption with wavelength) to define maturity indicators extracted from kerogen UV-Visible
spectra. Through the aid of quantum mechanical simulations for a large set of proxy ensemble
models of kerogen, we use these metrics to evaluate and predict with high accuracy the
aromatic/aliphatic ratio, through the evolution in concentration of the largest sized aromatic
clusters. Finally, we highlight the potential use of UV-Visible diffuse reflectance spectroscopy as
a chemically-specific complement to traditional maturity measurements.
2. Materials and Methods 2.1 Experimental
UV-visible spectra are recorded for type I, II, and III kerogen samples. Type I kerogens
were collected from the Green River formation and thermally matured by semi-open pyrolysis,
[18, 19] providing estimated VRo [11] between 0.48% and 1.65% (see Supplementary
information, Table S1). Type II kerogens were collected from three different formations
spanning a range of VRo between 0.55% and 2.2% (see Supplementary Information, Table S2).
5 Argonne Coal Bank, [21] and their VRo ranged 0.28% to 1.42% (see Supplementary
Information, Table S3 and S4). Type I and type II kerogens were isolated from their inorganic
matrices by acid demineralization [12]. Coal samples were sufficiently organic rich (at least 70
wt% organic) that they were used without purification. 13
C NMR spectroscopy and elemental
analysis were used to derive aromatic and aliphatic content, as shown in Table S2. Spectra of
pure graphitic-like materials such as single wall carbon nanotubes and reduced graphene oxide
(from Graphene Supermarket) and graphite microplatelets (Fisher Scientific) were recorded to
identify the reference baseline for the sensitivity of the optical absorption edge of kerogen to
graphitization. The quantification of evolution of the extinction coefficient with the aromatic
cluster size was performed using pure aromatic compounds (Sigma-Aldrich): 1-ring
(hexamethylbenzene), 2-rings (naphthalene), 3-ring (anthracene), 4-rings (tetracene). UV-visible
absorption spectra were acquired using an Agilent Cary 300 UV-Vis spectrometer, with a
maximum spectral range between 200 and 800 nm, through a Xe-arc lamp (see Supplemental
Information).
2.3 Proxy Ensemble Models of Kerogen
While detailed atomic representations of kerogen are reported in the literature [22, 23], new
large ensembles of proxy models of kerogen were designed to specifically capture the relation
between optical absorption, the substantial degree of statistical variability in conjugation length
and configuration, and chemical composition of kerogen, as represented in the Van Krevelen diagram (H/C ratio up to 0.6 and O/C ratio up to 0.17, Figure S1). Two approaches were
employed to create proxy ensemble models (Figure 2) using Molecular Dynamics (MD)
simulations, in order to remove potential initial configuration bias from the preparation of any
6 software package [24]. A reactive force field (ReaxFF) [25] were employed to describe the
inter-atomic interactions so that molecules could react freely. In one approach, a given number of C, H
and O atoms were randomly mixed in a small simulation cell with periodic boundary conditions,
and their bonds further randomized by equilibrating the system at 6000K with NVT ensemble.
After heating the system for 5 ns, the structure was cooled down to 500K and re-equilibrated
with constant temperature and zero external pressure before the structure was relaxed from ab
initio. In the other approach, smaller samples were cut from large atomic structures pre-equilibrated from MD simulations. First, 3000 aromatic hydrocarbon molecules with a specific
H/C ratio were generated in a simulation cell with at least 4Å separation between each molecule.
The total number of atoms in each simulation cell varied from 50,000 to 150,000 depending on
the H/C ratio given. The system was then equilibrated under 500 psi pressure and 1500K
temperature until the total energy was constant (typically 25 ps of equilibration time). The
equilibrated system was then separated into small cubic samples with dimensions
13Å×13Å×13Å each. Oxygen atoms were randomly inserted into each small cubic sample until
the desired O/C ratio was reached within that sample. These small samples were then
re-equilibrated at 500K within the NVT ensemble to re-establish their periodic boundaries. After
the proxy samples were generated from either of the above-mentioned approaches, the structure
of each proxy sample was further relaxed with ab initio calculations using VASP [26, 27].
During this ab initio relaxation step, all the energies were calculated using Density Functional
Theory (DFT) with the Perdew-Burke-Ernzerhof[28] (PBE) exchange-correlation functional and
a wave function energy cutoff of 500 eV. The positions of the atoms were relaxed until all the
forces on the ions were smaller than 0.01 eV/Å.
Absorption spectra were calculated from the Random Phase Approximation (RPA)[29] at the
7 determined from a summation of the overlap between occupied and empty electronic bands, and
2000 frequency grid points were used to resolve the absorption spectrum of each sample. From
the absorption spectra, specific trends (linear and exponential) can be extracted in a manner
similar to that employed for the experimental absorption spectra, as described in the next section.
Figure 2. Proxy ensemble models of kerogen used in the ab initio UV/Vis calculations, generated from two different methods: a) a small piece cut from the large equilibrated system and b) atoms start with random positions in the small box and are then equilibrated. The sample shown in a) has a bulk density of 1.17 g/cm3
, H/C ratio of 0.58 and O/C ratio of 0.04. The sample shown in b) has a bulk density of 2.24 g/cm3
, H/C ratio of 0.46 and O/C ratio of 0.07. c) A portion of the large equilibrated system which started with a box of random poly aromatic hydrocarbons (PAH) molecules. Grey, red and yellow corresponds to H, C and O atoms, respectively. Bonds are only shown in c) for the ease of viewing. Images are generated using the VMD software package[30].
a)
b)
8 3. Results and Discussion
The widespread use of UV-Visible absorption spectroscopy for characterizing
polyaromatic compounds is favored by the highly quantum-mechanical sensitivity of light
absorption to chemical conjugation (details in Supporting Information, Chapter S3). For
polycyclic aromatic hydrocarbons (PAH), the particle in a box model predicts a reduction of the
bandgap as the aromatic cluster size increases. Thus, the spectra of PAHs exhibit sharp edges
that shift to the red as the size of the PAH increases (Figure S2). Results for kerogen samples are
presented below, first for type II, then type III, then type I. Raw, unprocessed UV-Visible
absorption spectra of type II kerogen are shown in Figure 3. The absorption spectra consist of
exponential absorption trends with graded slopes in the visible range, a flattening of the
absorption in the UV range, and a set of highly reproducible spectral bands around ~3 eV (Figure
3, inset). These bands (such as the Soret band) are typically associated with porphyrins[31] and
can be used to assign maceral type (such as liptinite for the Soret band, rather than inertite or
vitrinite[32]). Their presence in most cases does not hinder the ability to extract the nearly linear
absorption trends in the visible. Absorption trends in the UV range (E > 3 eV) are not determined
by conjugation but rather by saturated alkanes [33]. In the interest of relating absorption to
aromatic content, we therefore restrict the energy to the visible (1.9 - 3 eV, corresponding to 414
9
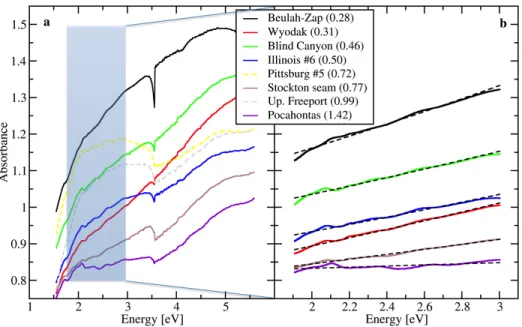
Figure 3. Visible absorption spectra of the isolated type II kerogens with exponential fit according to equation 1. (Inset) Full UV-Vis absorption spectra.
The exponential nature of the kerogen spectra contrasts the sharp absorption edges obtained for
pure aromatic compounds (Figure S2). Exponential spectra indicate chemically heterogeneous
samples and are caused by the overlap of many absorption edges at different wavelengths
originating from many diverse light absorbers (chromophores). For example, exponential
spectra are observed in crude oils[16] where optical absorption occurs mostly from the
asphaltene fraction, which is a complex mixture of single aromatic cores with aliphatic
substitutions as described by the Yen-Mullins model [34-36]. Exponential spectra can be
described by the Urbach tail phenomenology[16, 37], where the absorption coefficient 𝛼 is given
by:
𝛼 𝜔 ~𝑒𝑥𝑝 ℏ!!
! (1)
According to this description, absorption across the entire range is defined by 𝐸!, the Urbach
10 which lowers the band gap by exactly the thermal excitation energy (𝐸! = 𝑘𝑇)[16, 38].
However, for crude oils, the decay width 𝐸! corresponds to a measure of the population
distribution of chromophores, because larger chromophores have smaller bandgaps while smaller
chromophores have larger bandgaps. Visible absorption spectra of isolated type II kerogens are
found to conform closely to the Urbach exponential decay (Figure 3), and their decay widths
range from 1.8 - 14 eV.
UV-Vis absorption spectra from the type III Argonne Premium Coals are shown in
Figure 4a (relevant structural information about the aromatic concentration and configuration
[14], are highlighted in Table S4). Because of their high oxygen contents, these samples are in
some regards similar to processed amorphous films and graphitic carbonaceous materials, such
as polymer-functionalized reduced graphene oxide[39]. As can be seen in the figure, two of the
eight coals display highly non-linear behavior: for Pittsburgh No. 8 (HVB) and Pocahontas
(LVB), a highly convoluted set of bands characterize the visible portion of the spectra. Similar to
the Soret band in the type II kerogens, these bands are not related to the aromatic content in the
coals; however, in this case their presence strongly affects the extraction of a meaningful Urbach
decay width. Thus, these two coals are not considered in the analysis. This is indeed a general
procedure: substantial deviations from the Urbach exponential trends are due to competing
absorption processes, and therefore the spectra discarded from the analysis.
The absorption spectra in the visible range for the subset of the Argonne coals are shown
in Figure 4b. As with the type II kerogens, these type III kerogens are well described by the
Urbach phenomenology. While additional modulation exists in the coal spectra, likely due to
11
Figure 4. a) UV-Visible absorption spectra of selected Argonne Premium Coals. Dashed spectra in Pittsburgh No. 8 (HVB) and Pocahontas (LVB) display a highly non-linear behavior in the visible. The shaded region corresponds to the visible range, plotted in b). b) Visible absorption spectra of the restricted set of Argonne Premium Coal collection. Each spectrum is fitted with an exponential function according to equation 1. For each coal, the corresponding mean vitrinite reflectance value is reported in parentheses.
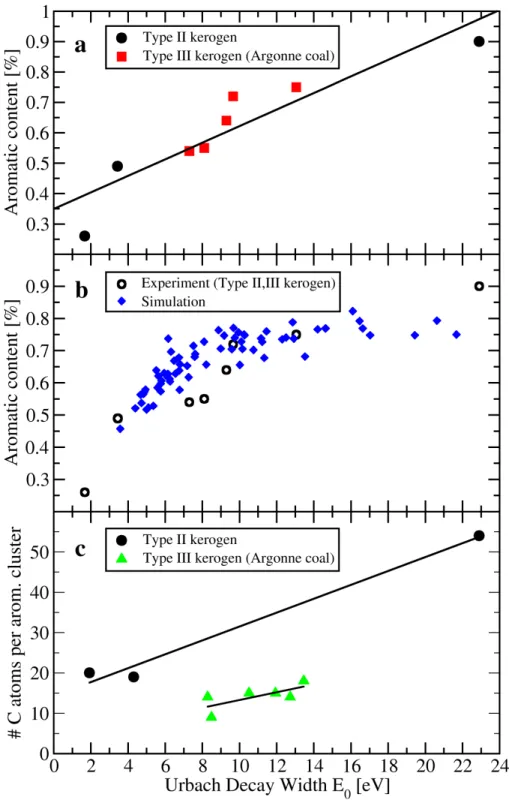
To understand the chemical significance of E0, fitted values are plotted against average
molecular parameters from NMR (Figure 5). E0 is found to correlate tightly with the
aliphatic/aromatic ratio for type II and type III kerogens (Figure 5a). Additionally, E0 from proxy
ensemble models with different H:C and O:C ratios (and therefore different aromatic contents)
correlates strongly with the aliphatic/aromatic ratio (Figure 5b). Even though no fitting
parameters are used in the calculations, the trends for measured and simulated samples
essentially overlap. Furthermore, the use of two, purposefully different methods in the
simulations for the generation of proxy ensemble models for a particular H:C and O:C did not
induce a systematic difference in the computed absorption trends. This correlation between Eo
and aromaticity, along with known correlations between aromaticity and maturity,[40] form the
12
Figure 5. a) Correlation between E0 and the aromatic content in type II and type III kerogens (Argonne coals) through a linear fit (Aromatic Content = 0.349 + 0.028*E0, R
2
=0.917). b) The correlation between E0 and aromatic content is compared between experimentally measured kerogens (type II and III) and calculations of kerogen ensemble proxy models. c) Correlation between E0 and the average aromatic cluster size in type II and type III kerogens.
13 In crude oils, the correlation between E0 and the aromatic content is further extended to a unique
correlation with the distribution of aromatic cluster sizes [16]. In particular, the conjugation
length of PAH increases—and therefore the bandgap decreases—with increasing aromatic
cluster size (the rate of increase depends on the geometry of the cluster) [14]. If each aromatic
cluster contributes equally to the optical absorption (i.e. if the cluster has a similar extinction
coefficient regardless of cluster size), a correlation between E0 and the average cluster size
(defined as the number of atoms per aromatic cluster size) might be expected. However, a
general, type-independent correlation between E0 and the average cluster size is not found for
type II and type III kerogens, as shown in Figure 5c. A possible explanation for the lack of
correlation is a non-linear increase in the extinction coefficient for increasing aromatic cluster
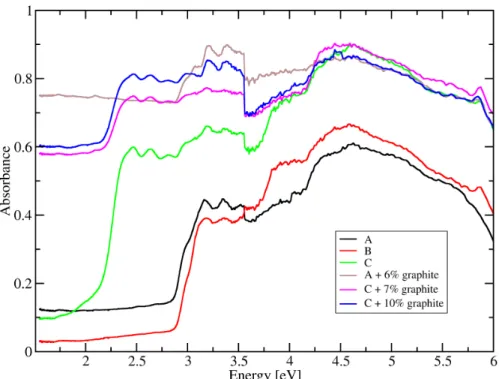
sizes. To verify this hypothesis, Figure 6 presents UV-Vis absorption spectra of mixtures of pure
aromatic molecules with well-defined number of aromatic rings (details of the composition of
the mixtures in the Supplementary Information). It is found that adding a small amount of a large
aromatic cluster to a mixture of smaller cluster results in a marked change in the optical
absorption. For example, adding 10% tetracene (4 rings) to a mixture averaging 2 rings (mixture
B, Table S5) results in a significant increase in absorption across the full spectra) (mixture C,
absorption edge at ~2.2 eV); and adding 6% or 7-10% graphite to mixtures A (average 2.25
rings) and C (average 2.2 rings) respectively nearly doubles the absorption in the pre-edge
region, resulting in this mixture with a small average aromatic size having a spectrum that is
nearly indistinguishable from that of pure graphite. The non-linear increase in absorption with
cluster size might be associated with the larger polarizability per carbon atom in larger aromatic
clusters, due to the higher mobility of π electrons [40]. This phenomenon suggest that the
absorption spectrum is particularly sensitive to large clusters, such that E0 should be correlated
14 (which cannot be measured by NMR).
Figure 6. UV-Vis absorption spectra from mixtures of pure aromatic compounds and graphite. Mixtures A and B have an average ring size of 3 and 2, respectively. Mixture C is similar to B with added 11% of tetracene (4-ring aromatic). Detailed concentrations of each molecule within each mixture are reported in Table S5.
The use of artificial aromatic mixtures highlights a major difference with kerogen. While
in kerogen there is a strong correlation between E0 and aromatic content, such correlation does
not necessarily exist for less complex artificial mixtures. For example, different spectra from
aromatic mixtures (Figure 6), all of which are nearly 100% aromatic, have different E0. The
excellent correlation of E0 with aromatic content in kerogen indicates that kerogen with the
largest aromatic clusters also has the highest aromatic content. While the average may change
(given the statistical nature of the average over an extensive number of sizes and shapes of
aromatic clusters), the tail of the distribution with the largest aromatic clusters may be formed by
components that can only be present at a specific maturation stage, regardless of type, resulting
15 carbonaceous mixture measured through E0 regardless of the kerogen type, provides predictive
capabilities of the state of kerogen maturation defined by the degree of aromatization. From a
technological standpoint, the largest aromatic clusters in kerogen largely dictate optical
absorption, thus providing a crucial parameter for the use of kerogen for light-harvesting
applications (i.e., solar cells[41, 42], or photodetectors).
Furthermore, the lack of a unique relation between E0 and the average cluster size
suggests that the average size of the aromatic clusters does not represent a consistent indicator of
the state of aromatization in kerogen. Kerogen from different biological origins (and therefore of
different types) may initially include aromatic compounds with different cluster sizes, which
then follow different trajectories during thermal maturation based on their local organic
composition. Therefore, when a similar thermal process is applied, a different value for the
average size of the aromatic cluster is to be expected. Conversely, from this work we observe
that at reservoir conditions, a given kerogen follows a type-specific maturation process that
depends on the kerogen original composition. In essence, the predominantly aliphatic nature of
biological material before transformation into hydrocarbons (catagenesis) acts as a common
denominator across kerogen types, and leads to a common maturation evolution to highly
aromatic kerogen. This is consistent with the traditional Van Krevelen diagram, where every
kerogen type shows a decrease in H:C ratio (normally associated with an increase in aromaticity)
16 .
Figure 7. The higher limit of the Urbach decay width (dashed vertical line at 25 eV) is provided by the broadband absorption in the visible of graphitic nanomaterials.
As the aromatic concentration in kerogen approaches that of graphitic materials, it is
important to evaluate the onset of graphitization. UV-Visible spectra of test graphitic compounds
(graphite flakes, reduced graphene oxide, single-wall carbon nanotubes SW-CNT, Figure S4)
exhibit extremely shallow slopes of the Urbach tails, asymptotically approaching a horizontal
line. The low values for the slope translate into large but unstable values of Eo. The linear
correlation between Eo and aromaticity holds for kerogen samples with Eo below 25 eV; values
17
Figure 8. Correlation between E0 and H:C ratio is compared between kerogen and simulated kerogen ensemble proxy models. The correlation between the experimentally derived E0 and H:C ratio in type II and type III kerogens is found to be linear (black line, H:C = 1.218 + 0.037*E0, R
2
=0.92).
In many carbonaceous materials, aromaticity is strongly correlated to the H:C ratio,
because aromatic systems typically contain lower H:C ratios than aliphatic systems [20].
Consistently, a strong correlation between Eo and H:C ratio is observed for type II and type III
kerogen (Figure 8a). When the experimental correlation is compared to that obtained from
kerogen ensemble models (Figure 8b), the H:C ratio in the latter appears to be underestimated,
despite a similar trend. We attribute the lower H:C in the proxy ensemble models to subtle
differences in the structure and functional groups (such as the lack of methyl groups) compared
to kerogen. Kerogen can contain abundant methyl groups formed by breaking weak beta bonds
in alkyl-aromatic structures, and that kinetic effect is not included in the model construction [43].
Methyl groups do not contribute significantly to the optical absorption in the visible range
18 relative lack of methyl groups in the models therefore decreases the H:C ratio compared to
kerogens with the same E0.
Figure 9. Visible absorption spectra of artificially matured Type I kerogens (Green River Formation). Values on the left of each spectra correspond to the estimated reflectance value (%Ro).
Maturation typically results in a decrease in H:C ratio and an increase in aromaticity [40].
The tight correlations of E0 with H:C ratio and with aromaticity suggests that UV-visible
spectroscopy might be used as a rapid measurement of maturity. Maturity is most commonly
measured by vitrinite reflectance (VRo) [13], in which the amount of light reflectance of a
particular organic carbonaceous maceral, vitrinite, is used (when present in the natural
carbonaceous material) to indicate maturity. When vitrinite is not present in kerogen, kinetically
derived models have been developed to estimate the effective reflectance values (such as the
“Easy%Ro” method[11]), based on thermal history. Figure 9 shows the UV-Visible spectra of
19 the same initial kerogen, is similar to the use of processed carbon to understand its thermally
induced aromatization, as it tests the consistency of estimates in optical response based on the
chemical kinetics during thermal processing or maturation[17]. The spectra follow the Urbach
tail phenomenology, consistent with the other kerogen types.
Figure 10. Correlation between the Urbach decay width, E0 and reflectance (VR0 for type II, III; EasyRo [11] for type I kerogen).
Figure 10 compares E0 with the measured or simulated reflectance values for types I, II,
and III kerogen. Tight, linear correlations are found for each kerogen type, spanning the entire
maturity range investigated. However, each type is found to have a unique correlation between
E0 and VRo. This result contrasts the correlation with aromaticity, where a single correlation
20 All kerogen types become more aromatic with increasing maturation [44]. However,
different kerogen types have different rates of aromatization and different distributions of
aromatic compounds at a given maturity [16]. These variations are expected based on the
different geochemical compositions of the initial organic compounds. By extension, it is to be
expected that the rate of aromatization of processed carbon (such as graphene oxide [45])
depends on the initial covalently bonded oxygen content. While the Urbach decay width captures
the chemical composition of the entire sample, vitrinite reflectance provides a measurement of
the thermal evolution of only the vitrinite maceral. While the restriction to a single maceral
enables comparison of VRo values across different kerogen types, it results in different kerogen
types having different bulk compositions even at the same VRo. Because E0 captures the
composition of the entire kerogen, as opposed to a single maceral, different correlations with
VRo are obtained for different kerogen types. At high maturity (VRo > 2), all kerogen types
transform into similar, highly graphitic materials[6], and consistently the correlations of E0 with
VRo trend towards convergence.
4. Conclusions
Unlocking the potential of carbon rich organic matter in organic shales for hydrocarbon
production as well as for their applications in novel nanostructure carbon-based devices will
benefit from a deeper understanding of its complex chemical and structural composition. Yet, the
chemical heterogeneity of kerogen and its evolution upon thermal maturation impose severe
limits in the application of conventional methods for characterization. Current methods either
rely on subsets of the mixture (enabling comparison across kerogen types but lacking direct
connection with chemical composition) or on extensive material preparation (prohibiting routine
21 calibrated and non-destructive method to monitor the chemical evolution of kerogen through the
process of natural and artificial maturation. We show, both experimentally and computationally,
a strong correlation between the visible optical absorption with the aliphatic/aromatic ratio,
justified within the Urbach phenomenology. We underscore that the universality of such
correlation (compared to the non-unique relation between VRo and kerogen composition)
highlights the intimate connection between the chemical evolution of the largest aromatic
clusters and the evolution of the aromatic/aliphatic ratio achieved through thermal maturation.
The theoretical framework presented in this work indicates the key role played by the statistical
nature of the evolution of different organic natural carbon materials during thermal maturation,
as captured by the Urbach tail phenomenology. The Urbach decay width can serve as a universal
indicator for the state of aromatization and, when calibrated for kerogen type, for thermal
maturation in carbon-rich organic matter.
The observed non-linear increase in optical absorption with the aromatic cluster size is
essential to capture the state of thermal maturation and also provides new technological insight
for the design of light gathering devices based on natural and processed carbon. Together with
the Urbach decay width, it serves as a validation step in the design of micro-structurally and
chemically accurate kerogen models, which can act as theoretical bases for the use of kerogen as
a light-gathering nanoscale electronic material. Understanding the structure of kerogen is crucial
beyond the hydrocarbon production standpoint. Inspired by the use of produced nanostructured
carbon materials in electronics [46, 47] and solar power generation [41, 42], the chemical,
physical and structural diversity of natural carbon from kerogens and its potential tunability
through sample selection, offers a set of yet unexplored and unconventional opportunities for its
22 5. Acknowledgements
We gratefully acknowledge Shell Oil Company for providing kerogen type II samples
and AMSO for providing kerogen type I samples. We wish to thank the X-Shale consortium and
its members Schlumberger and Shell Oil Company for partial funding of this effort under the
MIT-Energy Initiative. We are grateful to NERSC for providing computing resources for this
work.
6. References
[1] Alexander T, Baihly J, Boyer C, Clark B, Waters G, Jochen V. Le Calvez J, Lewis R. Miller
CK, Thaeler J, Toelle BE, Shale gas revolution. Oilfield Review 2011; 3:40-55.
[2] Vanderbroucke, M.; Largeau, C., Kerogen origin, evolution and structure. Organic
Geochemistry 2007, 38, 719-833.
[3] Durand D, Kerogen: Insoluble Organic Matter from Sedimentary Rocks. Paris: Technip
Editions; 1980, 13-33.
[4] Curtis JB, Fractured shale-gas systems. AAPG Bulletin 2002; 86(11):1921-1938.
[5] Zargari S, Prasad M, Mba KC, Mattson ED. Organic maturity, elastic properties, and textural
characteristics of self-resourcing reservoirs. Geophysics 2013; 78:D223-D235
[6] Bustin RM. Shale gas and shale oil petrology and petrophysics. Int. J. Coal Geology 2012;
103:1-2.
23 1984.
[8] Jarvie DM, Hill RJ, Ruble TE, Pollastro RM. Unconventional shale-gas systems: the
Mississippian Barnett Shale of north-central Texas as one model for thermogenic shale-gas
assessment. AAPG Bulletin 2007; 91(4):475-499.
[9] Cardott B, Sondergeld CH, Rai CS. Development of organic porosity in the Woodford Shale with increasing thermal maturity. Int. J. Coal Geology 2012; 103:26-31.
[10] Mukhopadhyay PK. Vitrinite Reflectance as Maturity Parameter: Petrographic and Molecular Characterization and Its Applications to Basin Modeling. ACS Symposium Series 1994; 570(1):1-24.
[11] Sweeney JJ, Burnham AK. Evaluation of a Simple Model of Vitrinite Reflectance based on chemical kinetics. AAPG Bulletin. 1990; 74:1559-1570.
[12] Vandenbroucke M. Kerogen: From types to Models of Chemical Structure. Oil and Gas Science and Technology 2003; 58:243-269.
[13] Peters KE, Cassa MR. Applied Source Rock Geochemistry. In: Magoon LB, Dow WG, editors. The petroleum system-from source to trap: AAPG Memoir, vol 60; 1994; 5:93-120.
[14] Solum MS, Pugmire RJ, Grant DM. Carbon-13 solid state NMR of Argonne-premium coals. Energy & Fuels 1989; 3:187-193.
[15] Suleimenova A, Bake KD, Ozkan A, Valenza II JJ, Kleinberg RL, Burnham AK, Ferralis N, Pomerantz AE, Acid demineralization with critical point drying: A method for kerogen isolation that preserves microstructure. Fuel 2014; 135:492–497.
[16] Mullins OC, Mitra-Kirtley, Zhu SY. The electronic absorption edge or petroleum. Appl. Spectr. 1992; 46:1405-1411.
[17] Connell GAN. Optical properties of semiconductors, in: Amorphous Semiconductors. Editor: Brodsky MH, Berlin: Springer-Verlag; 1985.
24 [18] Penn State Coal Bank, Energy Institute, Penn State University. Analytical data: http://www.energy.psu.edu/sites/default/files/files/CSB_Fact%20Sheet.pdf
[19] Argonne Premium Coal Bank, now handled by the PSU Coal Bank. Analytical data:
http://web.anl.gov/PCS/report/part2.html
[20] Le Doan TV, Bostrom NW, Burnham AK, Kleinberg RL, Pomerantz AE, Allix P. Green River Oil Shale pyrolysis: semi open conditions. Energy & Fuels 2013; 27:6447-6459.
[21] Feng Y, Van Le Doan T, Pomerantz AE. The chemical composition of bitumen in pyrolyzed Green River Oil Shale: Characterization by 13
C NMR spectroscopy. Energy & Fuels 2013; 27:7314-7323.
[22] Orendt AM, Pimienta ISO, Badu SR, Solum MS, Pugmire RJ, Facelli JC, Locke DR, Chapman KW, Chupas PJ and Winans RE, Three-Dimensional Structure of the Siskin Green River Oil Shale Kerogen Model: A Comparison between Calculated and Observed Properties, Energy & Fuels, 2012; 27(2): 702-710.
[23] Mathews JP and Chaffee AL. The molecular representations of coal – A review, Fuel, 2012. 96(0): p. 1-14.
[24] Plimpton S. Fast parallel algorithms for short-Range Molecular Dynamics. J. Comp. Phys. 1995; 117 (1):1-19.
[25] Chenoweth K, van Duin ACT, Goddard WA. ReaxFF Reactive force field for molecular dynamics simulations of hydrocarbon oxidation. J. Phys. Chem. A 2008; 112 (5):1040-1053.
[26] Kresse G, Hafner J. Ab initio molecular dynamics for liquid metals. Phys. Rev. B 1993; 47:558-561.
[27] Kresse G, Furthmüller J. Efficiency of ab-initio total energy calculations for metals and semiconductors using a plane-wave basis set. Comput. Mat. Sci. 1996; 6:15-50.
[28] Perdew JP, Burke K, Ernzerhof M. Generalized gradient approximation made simple. Phys. Rev. Lett. 1996; 77(18):3865-3868.
25 [29] Gajdoš M, Hummer K, Kresse G, Furthmüller J, Bechstedt F, Phys. Rev. B 2006; 73(4): 045112.
[30] Humphrey W, Dalke A, Schulten K. VMD - Visual Molecular Dynamics. J. Molec. Graphics 1996; 14:33-38.
[31] Rimington C. Spectral-absorption coefficients of some porphyrins in the Soret-band region. Biochem. J. 1960; 75:620-623.
[32] Speight JG. The chemistry and technology of coal 3rd ed. CRC Press; 2013.
[33] Costner EA, Long BK, Navar C, Jockusch S, Lei X, Zimmerman P, Campion A, Turro NJ, Grant Wilson C. Fundamental optical properties of linear and cyclic alkanes: UV Absorbance and index of refraction. J. Phys. Chem. A 2009; 113:9337-9347.
[34] Mullins OC. The Asphaltenes. Annu. Rev. Anal. Chem. 2011; 4:393-418.
[35] Mullins OC, Pomerantz AE, Zuo JY, Dong C. Downhole fluid analysis and asphaltene science for reservoir evaluation. Annu. Rev. Chem. Biomol. Eng. 2014; 5:325-345.
[36] Mullins OC, Sabbah H, Eyssautier J, Pomerantz AE, Barre L, Andrews AB, Ruiz-Morales Y, Mostowfi F, McFarlane R, Goual L, Lepkowicz R, Cooper T, Orbulescu J, Leblanc RM, Edwards J, Zare RN. Advances in asphaltene science and the Yen-Mullins model. Energy & Fuels 2012; 26:3986-4003.
[37] Ruiz-Morales Y, Wu X, Mullins OC. Electronic Absorption edge of crude oils and asphaltenes, analyzed by Molecular Orbital Calculations with optical spectroscopy. Energy & Fuels 2007; 21:944-952.
[38] Sa-Yakanit V, Glyde HR. Urbach Tails and Disorder. Comments Cond. Mat. Phys. 1987; 13:35.
[39] Zhuang XD, Chen Y, Liu G, Li PP, Zhu CX, Kang ET, Noeh KG, Zhang B, Zhu JH, Li YX. Conjugated-polymer-functionalized graphene oxide: Synthesis, and Non Volatile Rewritable Memory Effect. Adv. Materials 2010; 22:1731-1735.
26 [40] Schuyer J, Blom L, van Krevelen DW. The molar refraction of condensed aromatic compounds. Trans. Faraday Soc. 1953; 49:1391-1401.
[41] Bernardi M, Lohrman J, Kumar PV, Kirkminde A, Ferralis N, Grossman JC, Ren S. Nanocarbon-based Photovoltaics. ACS Nano 2012; 6:8896-8903.
[42] Gong M, Sastry TA, Xie Y, Bernardi M, Jasion D, Luck KA, Marks TJ, Grossman JC, Ren S, Hersam MC. Polychiral semiconductive carbon nanotube-fullerene solar cell. Nano Lett. 2014; 14:5308-5314.
[43] Lin R, Ritz GP. Studying individual macerals using IR microspectroscopy, and implications on oil versus gas/condensate proness and “low-rank” generation. Org. Geochem. 1993; 20:695-709.
[44] Kelemen SR, Afeworki M, Gorbaty ML, Sansone M, Kwiatek PJ, Walters CC, Freund H, Siskin M, Bence AE, Curry DJ, Solum M, Pugmire RJ, Vanderbroucke M, Leblond M, Behar F. Direct characterization of kerogen by X-ray and solid-State 13
C NMR methods. Energy & Fuels 2007; 21:1548-1561.
[45] Kumar PV, Bardhan NM, Tongay S, Wu J, Belcher AM, Grossman JC. Scalable enhancement of graphene oxide properties by thermally driven phase separation. Nat. Chem. 2013; 6-151-158.
[46] Wu J, Pisula W, Mullen K. Graphene as potential material for electronics. Chem. Rev. 2007; 107:718-747.
![Figure 1. Van Krevelen diagram (modified from [6]) highlighting the biological origin of each kerogen type](https://thumb-eu.123doks.com/thumbv2/123doknet/14747180.578617/4.918.127.744.459.917/figure-krevelen-diagram-modified-highlighting-biological-origin-kerogen.webp)