Publisher’s version / Version de l'éditeur:
Vous avez des questions? Nous pouvons vous aider. Pour communiquer directement avec un auteur, consultez la première page de la revue dans laquelle son article a été publié afin de trouver ses coordonnées. Si vous n’arrivez pas à les repérer, communiquez avec nous à [email protected].
Questions? Contact the NRC Publications Archive team at
[email protected]. If you wish to email the authors directly, please see the first page of the publication for their contact information.
https://publications-cnrc.canada.ca/fra/droits
L’accès à ce site Web et l’utilisation de son contenu sont assujettis aux conditions présentées dans le site LISEZ CES CONDITIONS ATTENTIVEMENT AVANT D’UTILISER CE SITE WEB.
Contract Report (National Research Council of Canada. Division of Building Research), 1982-07-30
READ THESE TERMS AND CONDITIONS CAREFULLY BEFORE USING THIS WEBSITE.
https://nrc-publications.canada.ca/eng/copyright
NRC Publications Archive Record / Notice des Archives des publications du CNRC :
https://nrc-publications.canada.ca/eng/view/object/?id=a76a9ce8-1737-48a1-8961-aa3865fa4587 https://publications-cnrc.canada.ca/fra/voir/objet/?id=a76a9ce8-1737-48a1-8961-aa3865fa4587
Archives des publications du CNRC
For the publisher’s version, please access the DOI link below./ Pour consulter la version de l’éditeur, utilisez le lien DOI ci-dessous.
https://doi.org/10.4224/20326324
Access and use of this website and the material on it are subject to the Terms and Conditions set forth at Dynamic fatigue of flat glass, phase III: final report
I
• Ref TA450 J65l BLDG , . - - ----.. CONTRACT REP OR T r l ·· -· .::J - - - · • ,_.., N⦅NエオNNjセ@ Phase III DSS File No . 09SX . 311 55- 9- 4421 (67049)ONTARIORESEAR[It
FOUNDATION
c t S T I"'itDG.
R£5. L\&RARY83-
06- 2 4
V|Fuoャhセouセ@
D.'!"':\,· Gセi@ lfll\
. .M
Mセ@
•DEPARTMENT OF METALS, GLASS AND CERAM ICS Dynamic Fatigue of Flat Glass
Phase III
DSS Fi l e No . 09S X. 31155- 9- 4421 (67049 )
FINAL REPORT Submitted to:
Nati onal Research Counc il Canada , Ottawa, Ont . PPG Industries Canada Ltd ., Toronto, Ontar i o Li bbey- Owens -For d Compa ny , Toledo , Ohio
Pilkington Gl ass Industries Ltd ., Toronto, Ont . Prepared by:
S. Johar
Ju l y 30 , 1982.
The Nation al Research Council Canada , PPG Industries Canada Lt d., Lib beyOwe ns Ford and Pilkington Glass Industries Ltd. , do not ma ke any represen -tations wi t h respect to the accuracy , completeness , or usefulnes s of the i nformation contained in this report and do not assume liabilities wi th res pect to t he use of, or damages resulting from , the use of any i nf orma-t ion , apparaorma-tus , meorma-thod or process disclosed in orma-this re po rorma-t .
ONTARIORESEARCit
FOUNDATION
SHER I DA N PA RK RESEARCH COMMUNITY
M ISSISSAU GA, ONTARIO, CANADA LSK 183 • (416) 822-41 11 • TELEX 06-98231 1
WE, THE ONT A RIO R ESE A RCH F OUNDA T ION , STIPULATE THAT THIS DOCUMEN T IS S U BJE C T T O T HE F OLLOWING T E RM S AN D CON DI TI O N S :
1 ANY PROPOSAL CON T AINED H E REI N WAS PREP A R ED FOR T H E CON S IDE R AT I ON OF T H E A D DR E SSEE ONLY ITS CONTE N TS MAY N O T B E USE D BY N O R D I SCLO SED TO
ANY O T HE R PARTY WI T HOU T OU R PRIO R W R I TT EN CONSEN T .
2 ANY TES T ING, INSI'ECTION OR INVES T IGATION PE RF ORM E D BY US WIL L B E CONDUCTED IN ACCORDANCE WITH NORM AL PROF ESSI O N AL STAN D A R DS. NEITH ER WE
NOR OUR EMPLOYEES SHALL BE RE SPONSIB L E FOR A NY LOSS O R DAM AGE RESUL T ING DI R ECTLY O R IN D IRECTLY F R OM ANY DEFAULT, ER R O R OR OMISSION .
3 ANY RE PORT, PROPOSAL O R QUOTATION PREPARED BY US REFERS ONLY TO THE PARTICULAR MATERIAL, INST RUMENT OR OTHE R S U B JE CT REF E RRED TO IN IT NO
REPRESENTATION IS M ADE THAT SIMILAR AR T ICLES WILL BE OF LIKE QUALITY
4 NO REPORT ISSUED BY US SHALL BE PUBLISHED IN WHOLE OR IN PART WITHOUT OUR PR IOR WR I TTEN CONS E NT
5 OUR NAME SHALL NOT BE USED IN ANY WAY IN CONNECTION WITH THE SALE. OFFER OR ADVERTISEMEN T OF ANY ARTICLE, PROCESS OR SERVICE.
I
..
_ MMセᄋセセᄋ^@ - セN@ NNNセ@ セ@ ( i ) TABLE OF CONTENTS 1. INTRODUCTION 2. EXPERIMENTAL APPARATUS 2. 1 Test Facility 2.2 Principles of Operations 3. TEST PROCEDURE 3.1 Destructive Testing PAGE 1 2 2 2 2 23.1.1 Test Panel Preparation and Installa ion 2
3.2 Tests 3
3.3 Precision of Measurements 3
3.4 Break Origin 4
3.4 . 1 Coordinate System 4
3.4 . 2 Mirror Radius 6
3.4. 3 Alternate Method for Selecting the Break 6
Origin
4. TEST RESULTS
4. 1 Destructive Testing
4.2 Data With Superimposed Vibrations REFERENCES
LIST OF APPENDICES APPENDIX A: Check List
APPENDIX bセ@ Loading Calibration Cu rves
APP ENDI X C: Test Data
APPENDI X D: Data With Superimposed Vibrations
6 6 8 9 10 12 19 50
carri ed out by the Ontario Research Foundation under the contract
entitled 11
Dynamic Fati gue of Flat Glass11
• Phase I, financed by the
Federal Government of Canada, covered the design and construction of a uni que test apparatus capable of applying a linearly increas
-i ng a-ir pressure d-ifference to glass panels 6011 x 9611 (1525 mm
x 2440 mm) at rates ranging f rom less than 0. 0015 psi/s (0 . 01 kPa/s) to more than 4. 4 psi/s (30 kPa/s)(l). Phase II of the project
consisted of destructive testing of 90 panels of annealed float glass
nominally 1/ 411
(6 mm) th i ck, using three different loading rates, 0. 022 , 0. 22 and 2. 2 psi/s (0 . 15 , 1. 5 and 15 kPa/ s), as well as non -destructive tests on a strain gauged tempered glass panel with strain gauges bound to its surface( 2).
Phase III of the project comprised of the destructi ve testing
of 100 panels of annealed float glass nomi nall y l / 411 (6 mm) thick
using five different loading rates from 0. 00036 to 3. 6 psi / s
(0.0025 to 25 kPa/s), increasing by a fa ctor of 10( 3) . Both phases II and III were jointly supported by three glass manufacturers:
PPG Industries Canada Limited, Libbey-Owens - Fo rd and Pil kington Glass Industries Limited , and the Di vision of Building Research , National Research Council Canada .
The underlying motive for the program was the need to relate
the strength of windows under a 11
60- second load11
to their capacity for resisting a series of short, sharp gusts and , in particular, the peak gust for which they are designed . When a model study is carried out i n a boundary layer wi nd tunnel to generate information for cladding design, one occasionally finds peak pressures of extremely short durati on and great magnitude. The appropriate design value depends on duration as well as magnitude .
2
The overall objective of the project was to generate data to determine the effect of the loading rate on the average
breaking strength of glass panels of the size 6011 x 9611 x セセセ@
(1525mm x 2440mm x 6mm) widely used in the building industry . The purpose of Phase III was to supplement and extend the results of
Phase I I.
2. experゥエセental@ APPARATUS
2. 1 Test Facility
The test facility, designed and constructed under Phase I of the project consists of three major components :
i ) Glass plate test system
ii) Loading and edge restraining system iii) Servo drive and data acquisition system
A detailed description of the test facility is given in the Final Report of Phase I, submitted by ORF to the National Research Council Canada(l) .
2. 2 Principles of Operations
Principles of operations of the test apparatus i ncluding the edge restraining system and loading rates were given in the Final
Report of Phase
ii セ
RIN@
3. TEST PROCEDURE
3.1 Destructive Testing
3. 1.1 Test Panel Preparation and Installation
For the most part, the procedure followed in preparati on and installation of the test panel was si milar to that in Phase II
of the program . The details are given in the Final Report of Phase 11( 2). In addition to this, due to availability of a light inspection box, the panels were inspected for bulk and surface flaws over the light source.
Also a check list was maintained to ensure that a uniform procedure was followed for all tests. The check list is attached as Appendix A.
3.2 Tests
One hundred and eleven panels were tested between January 19th and June 9th , 1982. During this period, room temperature ranged from 16°C to 24°C , wh ile the relative humidity ranged from 26% to 57%. Four sets of results were discarded, either due to the break origin co-inciding with edge flaws noticed during visual checking, or due to other experimental problems.
Five pallets of twenty glass panels each, for a total of one hundred and twenty test specimens, were purchased from one manufacturer. To minimize the handling of the glass, all panels in a given pallet were tested sequentially. To min imize systematic errors, the five loading rates we re mixed . The order of testing was as indicated by the dates in the glass failure data (Tables C2-C6).
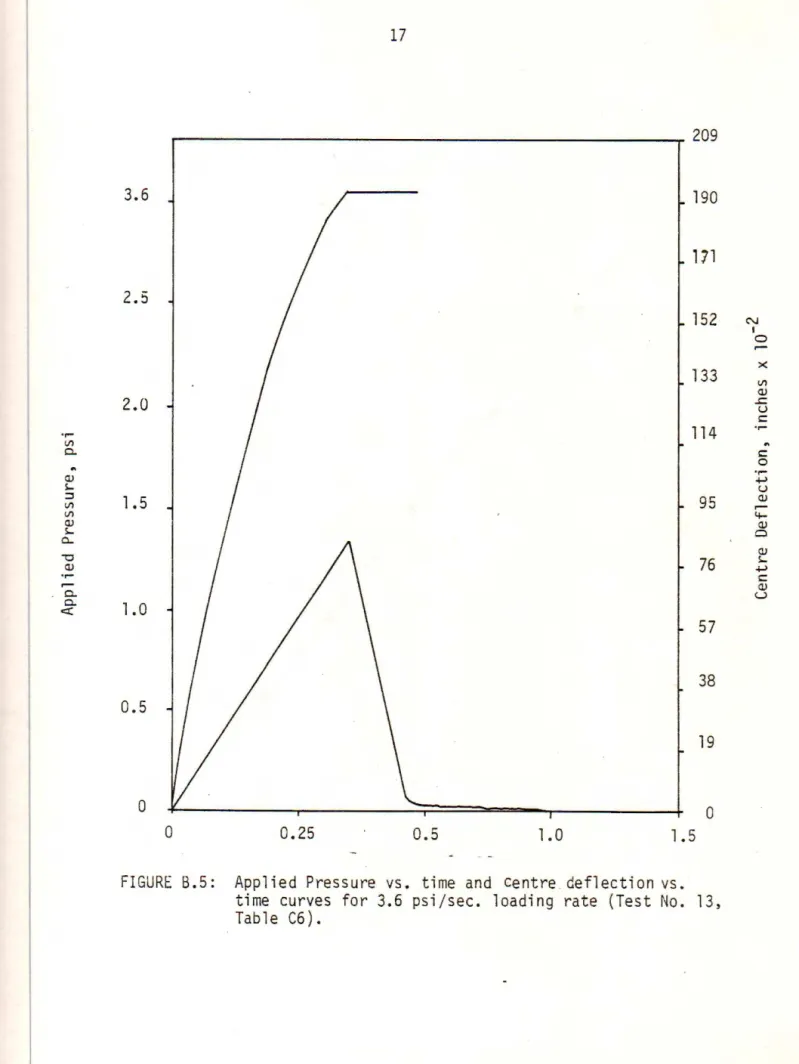
Samples of applied pressure vs time and load vs time curves for the five loading rates are given in Figures 81 to B5 .
3.3 Precision of セ ャ・。ウオイ・ ュ ・ョエウ@
As breaking pressure, time of failure, and deflection were recorded on an X- Y recorder, the precision of the measurements were governed by the resolution attainable in reading charts. These are given bel ow.
Quantity Breaking Pressure Time for - 0. 00036 psi / s rate - 0. 0036 psi / s rate - 0.036 psi /s rate - 0 .36 psi/s rate - 3. 6 psi / s rate 4 Precision of Measurements 0. 01 psi (0. 07 kP) ± 5 sec ± 5 sec ± 0.5 sec ± 0.05 sec ± 0. 025 sec
The pressure transducer and associated electronics were calibrated at regular intervals. A typical calibration graph is gi ven in Figure 86 .
3. 4 Break Origin
3. 4.1 Coordinate System
The gl ass panels were taped to retain the Possible Failure Origins (PFOs) . The PFOs were identified by t heir position on t he glass panel and their t ype (su rface or edge ) . The numbering sys tem
of the four quadrants is shown in Figure 1, which i llustrates the
sys tem viewerl from the "chamber interior"* side.
The positions of the PFOs is given with respect to an origin in the lower left hand corner, with X axis along t he short side of the glass panel an d the Y ax i s al ong the long side of the panel . The angle - listed in Tables C2 to C6 and C9 to Cl3 , is between the fracture plane and positive X axi s measured in a counter clockwise direct i on.
*The side of the glass pa nel f acin g the hydraulically driven piston .
( 0,0 QUADRANT 4 I
t
-,4.
QUADRANT 3 QUADRANT 1 QUADRANT 2 Fracture / .:" Plane X )Figure 1: Quadrant System l ooking from the "chamber interior" side used for labelling PFOs
6
3.4 . 2 Mirror Rad i us
The PFO pieces were labelled and saved . The mirror radius, r , was measured with an opti cal mi croscope and converted into stress values using the formu l a (4) ,
cr p (psi ) = 1950 ( 1)
/ r(in )
In each test , the PFO with the lowest stress value was sel ected as t he break ori gin .
3. 4. 3 Alternate Method for Selecting the Break Origin
Anot her way to select t he break origin from several PFOs was deve l oped, making the assumption that the quadrant i n wh ich a break origin is located shows a fracture pattern with cross lines widely separated from each other. By comparison, t he other three quadrants show a finel y-meshed ne t work . The break origin selected
using this 11alternate method11 differed from t he PFO havi ng the
lowest stress value in eight of the forty cases suitable for comparison .
4. TEST RESULTS
4.1 Destructive Testing
Data from the destructive tests is given in Appendix C in Imperi al Units . A conversion table (Table Cl ) for Impe ria l Units vs Metric Units is included for relevant quantities .
Tables C2 to C6 list the failure test data for the five loading rates . Each of the tables include test data, average thick -ness of the panel , centre and edge deflections as we ll as the brea k-ing load . Also listed are the break origins selected as the PFO with the lowest stress value (largest mirror radius). For each break origin, the following parameters are given:
( 1 ) Type
(2) X, Y coordinates and angle of orientation
(3) cr p (Ksi) calculated オウゥョセ@ equation (1)
Table C7 lists the
a
cases in which, using the .. alternatemethod .. , a different PFO was se 1 ected as the break origin . Table C8 lists the mean breaking pressures with their standard deviations. Tables C9 to C13 list the PFDs .
Time plots, given in Figures Cl to C5, for various loading rates, represent plots of the breaking pressure vs testing sequence of a particular rate. These are plotted to show that there are no systematic trends in the brea king pressure data. The lines between the pointshaveno significance, but are drawn to help guide the eyes .
8
Figures C6 to ClO show breaking pressure · vs deflection data, each point of the graph representing a different test. In the case of 3.6 psi / s loading rate (Figure ClO), several data points are significantly lower than others . All these points are from early testing, during which the Linear Position Potentiometer (LPP) used for measuring deflection had insuffic ient response time for the fastest rate. Later on the problem was corrected.
4.2 Data With Superimposed Vibrations
Certain data sets had low frequency (6 cps) sinusoidal vibrations superimposed on the linear ramp loading. This noise was introduced by the electronics and the resonance frequency of the test apparatus. The applied pressure increased linearly at the start
but 。エ セ@ 0.3- 0.4 psi ,. sinusoidal vibrations set io. The amplitude
of the vibration increased with time.
Data reported in Tables C2 to C7 is presented on the basis
of a linear ramp loading. The data points marked with (t) had vibra
-tions present during testing.
An exampl e of the applied pressure vs time and centre de flection vs time curves with the aforementioned superimposed vibra -tions is shown in Figure. Dl .
Table D2 lists the correction factor, uncorrected and co rrected breaking pressure for the tests with superimposed sinu-soidal vibrations . The correction factors are derived by finding the loading rate which gi ves the same area under the (applied
pressu re )16 versus time to failure curve as does the linear ramp
plus sinusoidal vibrations representing the l oading of the test in question. Except for the one case (Loading rate 0.36 psi / s Test No . 5), the correction intro duced by the presence of vibration
REFERENCES
1. Staurnaras ,C . J . , Development and Eva luation of a Rig for the Study
of Dynamic Fatigue in Flat Glass - Final Report (6 7005 ) for the
National Research Council of Canada by the On ta rio Research Foundation - July 3, 1979.
2. Johar, S., Dynamic Fatigue of Flat Glass- Phase II, Final Report
(67039) for Nat ional Research Council Canada, Ottawa , Ontario, Canadian Pittsburgh Industries, Glass Division of PPG Industries Canada, Limited, Toronto, Ontario, Libbey-Owens - Ford Company, Toledo, Ohio, and Pilkington Glass Industries Limited, Toronto, Ontario , by Ontario Research Foundation, February 25, 1981.
3. Department of Supply and Serv'ices (DSS) File No . 07SX31155l 4414
-A Study to Determine the Dynamic Fatigue of Flat Glass - Phase III.
4. Orr, L., "Practical Analysis of Fracture of Glass Windows" - Material
Research and Standards, MTRSA, Vol . 12, No. 1, 1972, pp . 21-23, 47 .
10
APPENDIX A Check List
Preparation of Glass
Placement of Test Spec i men
Testing
CHECK LIST
- Wash tension side found with the aid of ultra - violet l i ght
- Measure room temperature and humidity - Measure glass thickness
- Wipe glass after wash i ng
Search for non -edge flaws using light source table
- Search for edge flaws
- Position gl ass panel in the apparatus - Return cylinder
- Ensure that the seals are in place
- Position Li near Position Po t entiometers(LPP) - Position Protective Screen
Check air pressure (11 . 9 inches of Hg ) - Adjust scales on chart recorders
- Balance servo controller , pressure meter - Make final check of instrumentation - Load glass panel to failure
- Measure deflections of LPPs - Take photos
12
APPENDIX B
Loading Calibration Curves
Vl 0. セ@ (l) !-::s Vl Vl (l) !-0.. "0 (l) .,.. r -0. 0. c:r: 133 2.0 114 1.5 95 76 1.0 57 38 0.5 19 0 セセ MMNMMM MMNM MM MNMM MM セMMMMMN MM MMMNMM MMMイ セ MM K P@ 0 100 200 300 400 500 600 700 800
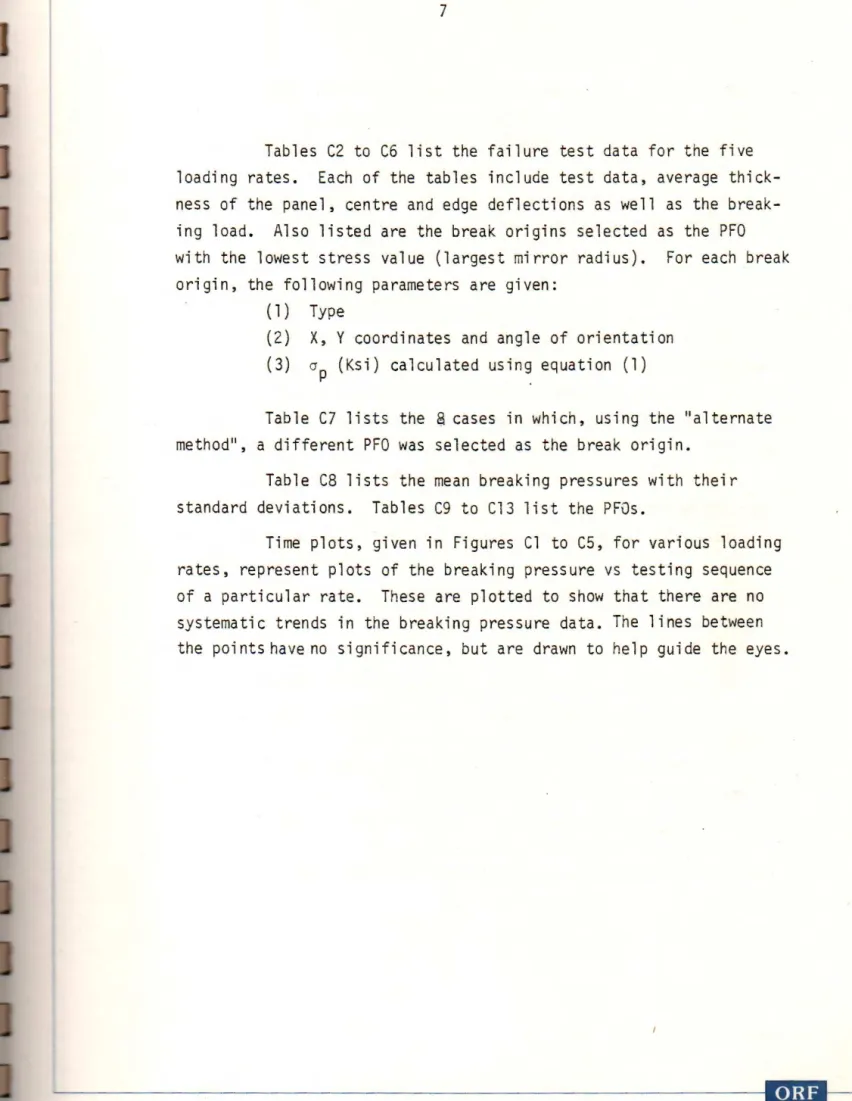
FIGURE 8.1: Applied Pressure vs . Time and Centre Deflection
vs . Time Curves for 0.00036 psi / sec. lッ。、ゥョセ@ Rate.
(Test No . 14, Table C.2 ) "" I 0 ... X Vl (l) .r. u 1:: .,.. セ@ 1:: 0 .,.. +-> u (l) r - 4-(l) c:::l (l) !-+-> 1:: (l) u
le);Jj
.,... Vl a.
..
QJ s... :::J Vl Vl QJ s... c.."
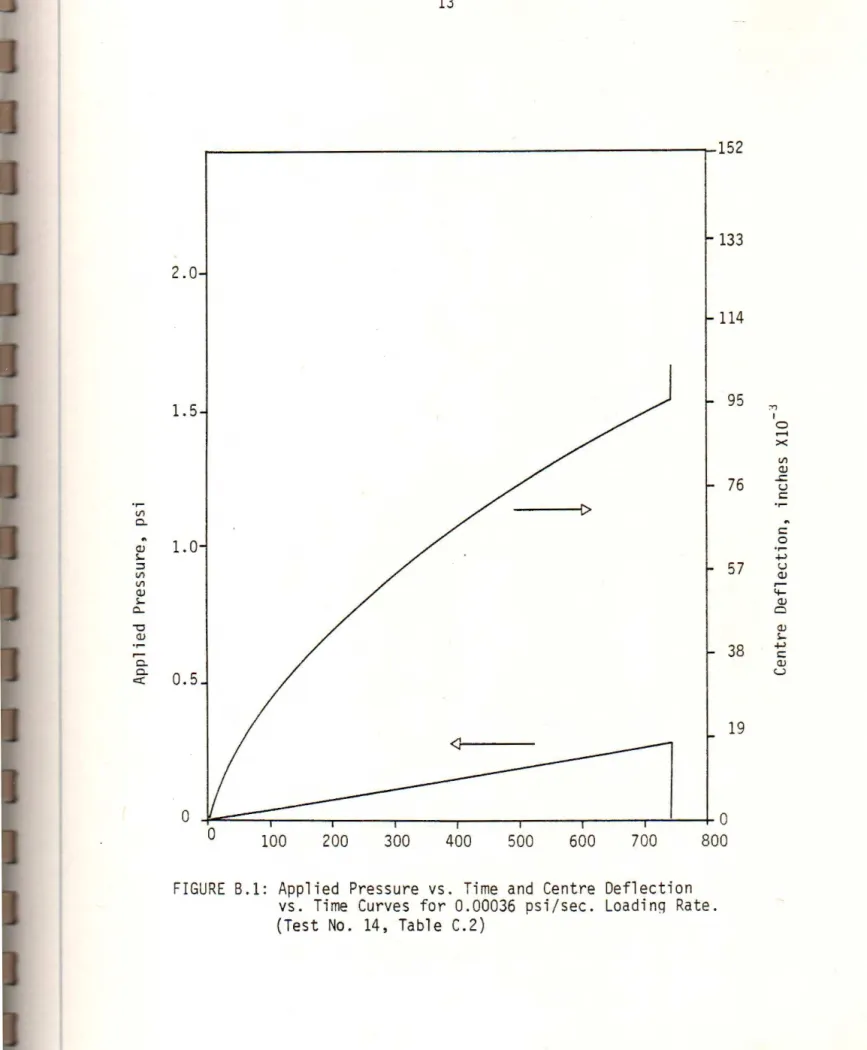
QJ .,... r -a. a. c::t: 1-i-2.0 [> 1.5 -1.0 0.5 0 0 25 50 75 100 125 150 Time (sec . )FIGURE B.2: Applied Pressure vs. Time and Centre Deflec tion vs . Time Curves for 0. 0036 psi / sec . Loading Rate . (Test No. 11 , Table C. 3)
114 m I 0 95 ... X Vl QJ ..r::. u c .,... 76
..
c 0 ᄋ セ@ -+-' u QJ ;: 57 QJ Cl QJ s... -+-' c QJ u 38 19 0•
••r-Vl c. セ@ Q) s.... ::l Vl Vl Q) s.... 0... "0 Q) r -c. c. <C 1.5 1.0 0. 5 10 Ti me (sec. ) 15
FIGURE 8.3 : Applied Pressure vs . Time and Centre Deflection vs. Time Curves for 0. 036 psi / sec. Loading Rate .
(Test No. 12, Table C.4).
152 133 114 95 m I 0 ... >< Vl Q) ..s:::: u 76 •r-c セ@ c 0 •r-+-' 57 u Q) r - 4-Q) 0 Q) s.... +-' c 38 Q) u 19
ᄋ セ@ Vl c.. セ@ QJ !.... ::s Vl Vl QJ !.... 0.... -o QJ ᄋ セ@
I
r -c.. c. c::x::I
I
I
I
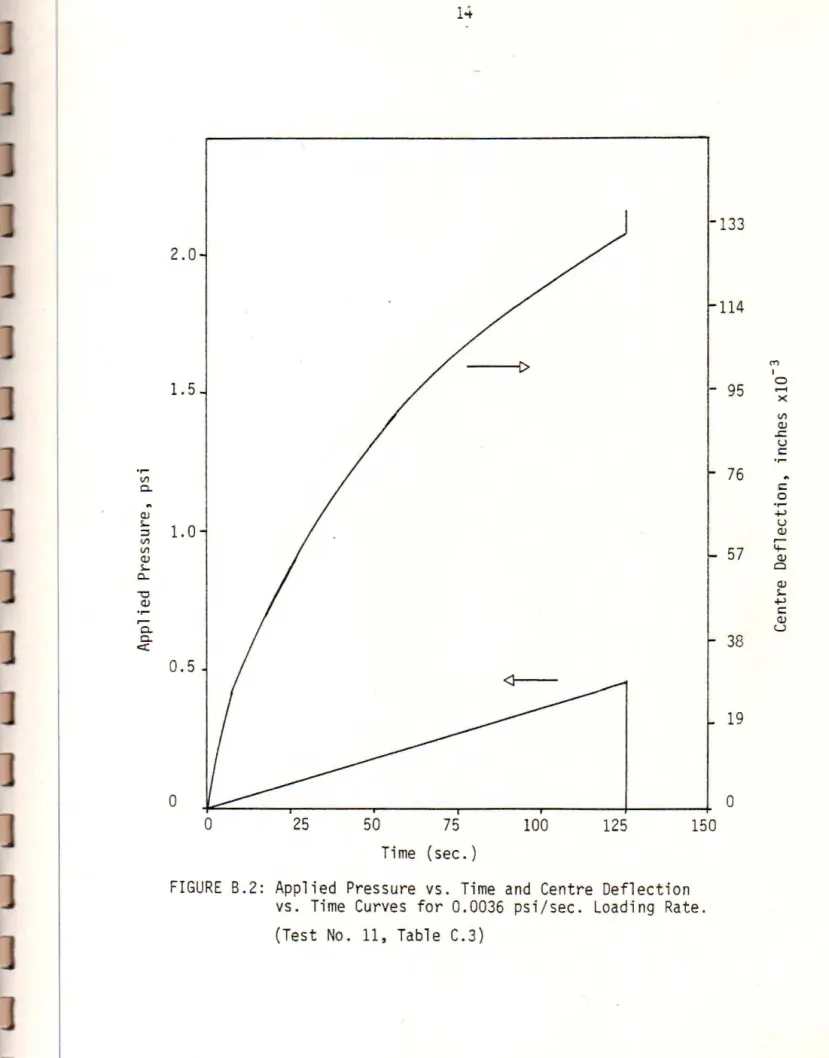
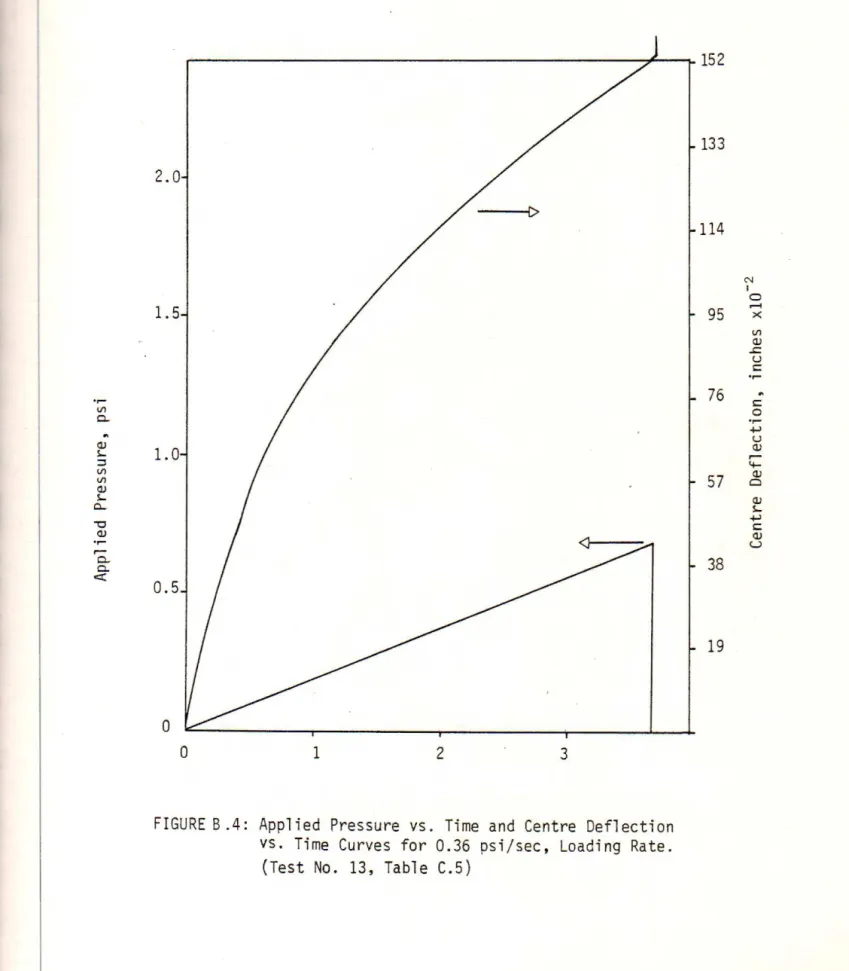
16 セMMMMMMMMMMMMMMMMMMMMMMMMMMMMMMMMMM MM セセ QUR@ 2. 0 !> 1.5 1.0 0. 5 0 0 1 2 3FIGURE B . 4: Applied Pressure vs . Time and Centre Deflecti on vs . Ti me Curves for 0.36 psi / sec, Loading Rate .
(Test No. 13, Table C. 5)
133 114 95 76 57 38 19 N I 0 ... X Vl QJ .s::::. u t: .,... セ@ t: 0 .,... .!-) u QJ r - '+-QJ 0 QJ !.... .!-) t: QJ u
·.--V1 0. セ@ (1) セ@ ::I V1 V1 (1) セ@ 0.. "0 (1) ·.--0. 0. c:( 3. 6 190 171 2.5 152 133 2. 0 114 1.5 95 76 1.0 57 38 0.5 19 0 0 0.25 0.5 1.0 1.5
FIGURE 8. 5: Applied Pres sure vs. time and centre . deflection vs . time curves for 3.6 psi/sec. l oading rate (Test No . 13, Table C6). N I 0 X V1 (1) ..c: u c: セ@ c: 0 ·.--+.> u (1) r - 4-(1) 0 (1) セ@
..,
c: (1) u•
•セ@ +J r--0 > セ@ en セ@ +J r--0 セ@ II 18 2 1 0 1 2 Pressure (psi )
FIGURE B.6: Pressure vs . Voltage Calibration Curve for Pressure Transducer.
Ill
APPENDI X C Test Data
20
TABLE Cl: CON VERSION TABLE
PARAMETER IMPERIAL UNITS MET RIC UN ITS
Mass pound 453.6g
Length inch 2.54 ern .
Pressure 1 psi 6.9 kP
Stress 1 ksi 6 .9 MP
Edge Restraining Force pound/ in 0.17 N/rnrn
Tes t Date Thi ck ness Rate Ce ntre · Edge Pressure Radius Coordinate s Ang l e St r es s
I
No. 1982 (in . ) ps i /s ec (in . ) (; n. ) (psi ) (in.) Type X in. Y in. Degree aP ( ksi )
1 20 .1 0. 2277 0. 00036 1. 25 - 0.45 0. 163 l S 3. 1 4. 2 40 4. 8
I
2 22: 1 0. 2295 0.00036 l. 31 0.085 0.57 0. 064 4S 4. 0 95 . 6 125 7.7 3 27: 1 0.2306 0. 00035 1. 23 0. 104 0.43 0.1 02 l S 2. 75 3.0 45 6. 1 4t 2:2 0. 2297 0.00034 1. 63 0. 103 0.68 0.10 4S 2.6 95.5 114 6.2 5t 11 :2 0.2271 0. 00035 1.48 0.1 38 0. 49 0 .132 4S 1. 6 92.4 130 5. 4 6 18:2 0. 2300 0.00035 1. 19 0. 083 0.39 0. 170 2E 60 2.0 Edge 4. 7 7 23.2 0.2294 0. 00036 l. 14 0. 129 0.37 0.388 Centre 30 48 0 3. 1 8 9:3 0.2291 0. 00020 1. 26 0. 063 0. 41 0. 168 1S 2. 6 4. 1 42 4. 8 9 11 : 3 0.2299 0.00033 1.25 0.095 0.47 0.038 lE 3. 2 0 Edge 10. 0 10 25:3 0.2299 0.00040 1.37 0.095 0. 50 0.141 1S 8.6 16.1 90 5. 2 N ..._.セ@
セ@
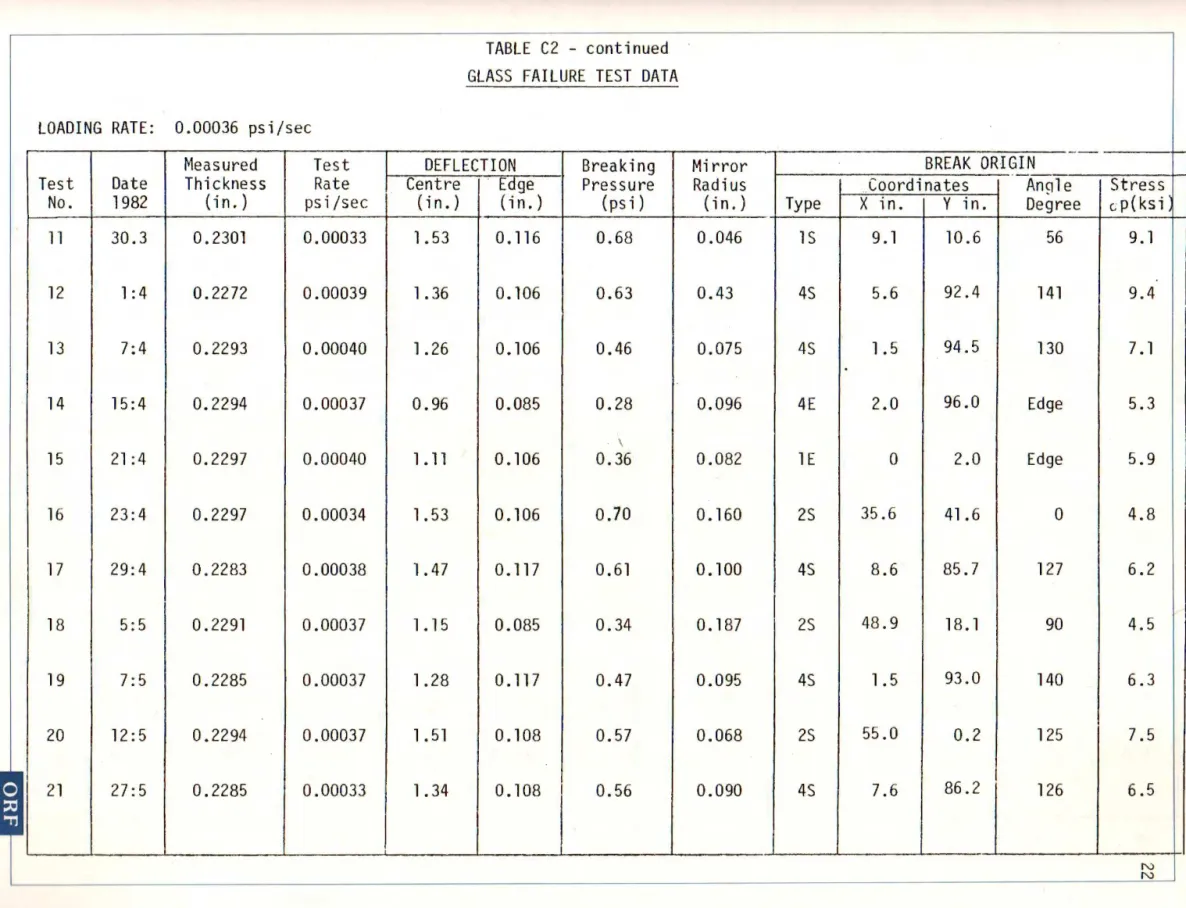
; )TABLE C2 - cont inued GLASS FAILURE TEST DATA LOADING RATE: 0.00036 psi/sec
Measured Test DEFLECTION Breaki ng Mi rror BREAK ORIGIN
Test Date Th i ckness Rate Centre Edge Pressure Radius _Coordin ates An91e Stress
No. 1982 (in. ) psi/sec (in.) (in. ) (psi ) (in. ) Type X in. Y in. Degree c; p( ks i
11 30.3 0.2301 0.00033 1. 53 0.116 0.68 0.046 1S 9.1 10 .6 56 9.1 12 1:4 0.2272 0 .00039 1. 36 0.106 0.63 0.43 4S 5.6 92.4 141 9.4 13 7:4 0. 2293 0.00040 1. 26 0.106 0.46 0.075 4S 1.5 94.5 130 7. 1 14 15:4 0.2294 0.00037 0.96 0.085 0.28 0.096 4E 2.0 96.0 Edge 5.3 \ 15 21:4 0.2297 0.00040 1.11 0.106 0.36 0.082 1 E 0 2.0 Edge 5.9 16 23:4 0.2297 0.00034 1.53 0.106 0.70 0.160 2S 35.6 41.6 0 4. 8 I ! 17 29:4 0.2283 0.00038 1.47 0. 117 0.61 0.100 4S 8.6 85 . 7 127 6.2 18 5:5 0.2291 0.00037 l. 15 0.085 0.34 0.187 2S 48 .9 18.1 90 4.5 19 7:5 0.2285 0.00037 1.28 0.117 0.47 0.095 4S 1.5 93.0 140 6.3 20 12:5 0.2294 0.00037 1.51 0.108 0.57 0.068 2S 55.0 0.2 125 7. 5
•
21 27:5 0.2285 0.00033 1.34 0.108 0.56 0.090 4S 7.6 86 . 2 126 6.5t
N - - - NTABLE C3
GLASS FAILURE TEST DATA
-LOADING RATE : 0.0036 psi/sec
Mea sured Test DEFLECTI ON Breaking Mirror BREAK ORIGIN
Test
I
DateI
Thickness Rate CentreI
Edge Pressu re Radi us ·.Coordinates ·Ang le StressNo. 1982 (in. ) ps i /sec (in. ) (in . ) (psi) (in. ) Type X in. Y in. Degree oP(ksi)
22 : l I 0. 2302 I 0.0035 I 1. 59
r
o.
148 0.795 0.080 1E 0 3. 1 Edge 6.9 2 29: 1 0.2307 0.0036 1.6 3 0. 140 0. 720 0.069 1S 1. 63 6.6 47 7.4 3 5:2 0. 2289 0.0037 1.56 0.127 0.65 0.064 4E 3.0 96 Edge 7. 7 4 I 12:2 I 0.2291 I 0.0035 I 1.1 8 Io
. 088 I 0.44 I 0.088 I 2E I 58. 0 0 Edge I 6. 6 5t I 16:2 I 0.2286 I 0.0036 I 1. 27 Io.
133 I 0.44 I 0. 069 I 4E I 5. 1 I 96 Edge 7. 4 6t I 19:2 I 0.2290 I 0.0034 I 1. 58 Io.
125 I 0. 71 I 0.044 I 2E I 55. 5 I 0 Edge 9. 3 7 I 10: 3 I 0.2294 0.0032 1. 53 0.064 0. 64 0.050 1S 9.6 7.6 35 8. 7 8 23:3 0.2292 0.0047 1. 39 0. 095 0. 57 0.078 35 55 . 2 95. 75 I 52 I 7. 0 9 26:3 0. 2289 0.0036 1. 56 0.1 27 0. 64 0.070 4E 0 92 . 9 Edge 7. 4 10I
31 = 3I
0.2288 I 0.0035 I 1. 59 Io.
106 I 0. 68 I 0.059 I . 45 I 9. 6 I 84 . 4 - 8. 0t-1
m
I
I
I
N wl
.
.
,TABLE C3 - cont i nued GLASS FAILURE TEST DATA LOADING RATE: 0. 0036 psi/sec.
Meas ured Test DEFLECTION Breaking Mirror BREAK OR IGIN
Test Da t e Th ickness Rate Centre Eage Pressure Radi us ·.Coord i nates Angle Stress
No . 1982 (in. ) ps i /sec (i n. ) (in. ) (psi) (i n. ) Type X in . Y in. Degree a p{ks i)
11 2:4 0. 2272 0. 0039 1. 30 0. 095 0.47 0 .110 l S 2. 8 1. 8 50 5. 9 ' 12 13: 4 0. 2292 0.0036 1. 12 0. 064 0. 36 0 .1 00 4E 5.0 96 .0 Edge 6. 2 13 22 :4 0.2300 0.0036 1. 71 0.1 06 0. 79 0. 034 3S 56.2 95.8 51 10. 6 14 27 :4 0. 2291 0.0037 1. 48 0.1 38 0. 63 0 .026 l S 7. 6 5. 1 35 12. 1 15 29:4 0.2288 0.0037 1. 34 0.1 00 0. 50 0. 087 4S 1. 5 94.8 128 6.6 16 4:5 0.2285 0. 0035 1. 30 0. 085 0.46 0. 085 l S 2. 8 4. 2 45 6. 7 17 6:5 0.2293 0 .0036 1. 64 0. 117 0. 90 0.025 3S 57 . 2 95 . 5 55 12. 3 18 6:5 0.2287 0.0036 1. 22 0 .100 0. 40 0. 225 4S 2.0 91.0 140 4. 1 19 12:5 0.2284 0. 0036 1. 64 0 .1 33 0. 74 0. 072 4S 1. 5 89 . 5 135 7. 3 20 19:5 0. 2289 0.0037 1. 38 0.127 0.54 0. 082 4S 9. 1 84 .9 124 6.8 !
•
セ@
21 28 : 5 0.2286 0.0035 l. 55 0. 100 0. 68 0. 055 4S 7.6 82 . 4 105 8. 3 N .,J::o - ·LOADING RATE: 0.036 psi /sec.
'
Meas ured Tes t DEFLECTION Breaking Mirror BREAK ORIGIN
Test Date Thi ckne ss Rate Centre · Edge Pressure Radius · Coordinates __ P.ngl e Stress
No. 1982 (in. ) ps i/sec (i n. ) (in. ) (ps i) (in.) Type X in. Y in. Gegree oP(ksi)
1 t 19: 1 0.231 2 0.034 1.58 - 0.70 0.062 2S 55.9 2.1 140 7. 8 2t 26 :1 0.2322 0.033 1.68 0.096 0. 84 0.015 4S 1.6 95.8 125 15.9 3 2:2 0.2312 0.033 l. 73 0. 158 0.96 0.032 4S 8. 1 83 . 4 108 10.9 ' 4 ·r 9: 2 0.2286 0. 034 l. 71 0.180 0.80 0.100 1E 1. 5 0 Edge 6.2 5 t 12:2 0.2"311 0.034 1. 85 0. 121 0.95 0.023 4S 5. 1 88 . 9 125 12.9 6t 17 :2 0.2295 0.031 1.62 0.24 0.75 0.056 1E 0 2.2 Edge 8 . 2 7t 24:2 0.2281 0.035 1. 83 0. 158 0 .92 0.029 1S 11.6 18 . 6 90 11. 5 8 t 10: 3 0.2294 0.035 1. 80 0.127 0.90 0.082 4S 4.8 95.5 135 6.8 9 23:3 0. 2294 0.038 1. 80 0.148 0.90 0.087 4E 0 93 .0 Edge 6.6 10 24: 3 0. 2293 0.037 l. 73 0.127 0. 80 0.038 4S 7.8 80 .4 90 10. 0
•
セ@
11 26:3 0.2293 0.036 1.59 0. 138 0.69 0. 088 1S 2. 1 6. 6 45 6. 6 N Ul -·-TABLE C4 - conti nued GLASS FAI LUR E TEST DATA LOADI NG RAT E: 0.036 pse/sec.
Meas ured Tes t DEFLECTI ON Break i ng Mirror BREAK ORI GI N
Tes t Date Th i cknes s Rat e Centre Edge Pres sure Radiu s Coordi na t es Angl e St ress
No. 1982 (in . ) ps i / sec (i n. ) (in. ) (ps i ) (i n. ) Type X i n. Y i n. Degree cr P( ks i I)
1-12 30: 3 0. 2289 0. 036 1. 47 0. 148 0. 64 0.127 4E 0 94 . 0 Edge 5. 4 13 6: 4 0. 2294 0. 038 1. 55 0. 127 0.75 0. 091 3E 58 . 0 96. 0 Edge 6.5 14 7: 4 0.2288 0.036 1. 75 0 . 127 0. 84 0.043 l S 9.6 13. 1 62 9. 4 15 14: 4 0. 2291 0. 036 1. 55 0.1 06 0. 70 0. 11 5 4S 1.1 91. 4 135 5.7 16 15:4 0. 2299 0.036 1. 29 0. 095 0. 50 0. 084 2E 58 . 0 0 Edge 6. 7 17 19:4 0. 2297 0. 036 1. 61 0.1 27 0. 74 0. 05 1 l S 9. 1 12. 1 32 8.6 18 23 :4 0. 2291 0.036 1. 34 0. 138 0. 51 0. 06 7 1S 2.8 2. 0 48 7.5 19 t 28 :4 0. 2295 0. 035 1. 84 0. 148 1.0 0 . 026 3S 58.8 94. 5 45 12. 1 20 20:5 0. 2300 0. 036 1. 68 0. 148 0. 86 0. 030 3S 58 . 2 91. 4 45 11 .3 21 t 27:5 0. 2292 0. 035 1. 79 0. 146 0. 96 0. 022 2S 54 . 4 6 .6 134 13. 1
•
22 9:6 0. 2285 0. 035 1. 61 0.1 21 0. 78 0 .080 l S 2. 5 8. 2 50 6. 9 • N ())LOADING RATE: 0. 36 psi/sec.
Meas ured Test DEFLECTION Brea king Mirror BREAK ORI GIN
Test Date Thi ckness Rate Ce ntre Edge Pressure Radius Coord i nates Angl e Stress
No. 1982 (in. ) ps i/sec . (in. ) (in. ) (psi) (in . ) Type X in. Y in. Degree oP(ksi)
lt 19: 1 0.2309 0.26 1. 94 - 1. 30 0.007 1S 7.8 7.4 60 23.3 2 21 : 1 0. 2277 0.26 1.64
-
0. 80 0.067 4S 5.6 95. 5 125 7.5 3-t- 26 : 1 0. 2300 0. 24 1.84 0. 183 1.05 0.014 4S 9.6 88.4 154 16.5 4-r 28: 1 0.2297 0.24 1.59-
0.76 0.031 1S 10.3 8.6 30 11 . 1 5-r 28: 1 0.2306 0.36 1.65 0.26 0 . 74 0. 125 2E 58 . 25 0 Edge 5.5 6-t- 9:2 0.2288 0.36 1. 52 0.180 0. 69 0.047 l S 15.6 15.6 35 9.0 7 16:2 0.2289 0.38 1.43 0.125 0. 58 0.106 4E 5.1 96.0 Edge 6.0 8-t- 18:2 0.2293 0.38 1. 99 0.183 1.1 9 - 2S 57.9 1.6 135 -9-t- 23:2 0.2287 0.38 1.67 0.2 17 0.81 0.043 l S 14.6 17. 1 128 9.4 10 10:3 0.2293 0.42 1. 56 0.106 0.81 0.035 4S 9.1 89.2 150 10.4 11 12:3 0.2296 0.27 1. 70 - 0.82 0.028 4S 8. 1 84.2 108 11. 7=
セ@ 12 24:3 0.2304 0.41 1. 88 0.148 1.1 8 0.013 1S 8. 1 9. 6 47 17. 1 セ@-TABLE C5 - cont i nued GLASS FAI LURE TEST DATA LOADIN G RATE : 0. 36 ps i /sec .
Meas ured Tes t
I
DEFLECTI ON Break i ng Mi rror BREAK ORI GINTest Dat e Thi ckness Rate Centre Edge Pressure Ra diu s · Coor dinates __ aョ セ Q ・@ St ress
No. 1982 (in. ) psi/sec (in. ) (in . ) (ps i ) (i n.) Ty pe X i n. Y in . Deyree c p ( ks i
13 1: 4 0. 2295 0. 39 1. 54 0. 095 0. 76 0. 050 1S 8. 8 7. 1 30 8. 7 14 2: 4 0.2304 0. 35 1. 71 0.1 27 0. 92 0. 027 4E 0 93 . 0 Edge 11 . 9 I 15 6: 4 0.2290 0. 38 1. 67 0. 127 0. 78 0. 074 4S 9. 8 90 . 9 155 7. 2 16 8: 4 0.2296 0.39 1. 65 0 . 127 0. 84 0. 082 3S 54.4 95 . 5 50 6. 8 17 13.4 0.2299 0. 46 1. 65 0.1 27 0. 81 0.044 3S 58 . 5 91. 5 45 9. 3 18 16: 4 0. 2286 0. 39 1. 53 0 . 085 0. 84 0. 069 1S 9.6 4.6 15 8. 0 19 20 : 4 0. 2296 0.39 1. 80 0. 106 0. 98 0. 048 1E 0 3.5 Ed ge 8. 9 20 22: 4 0. 2280 0. 38 1. 53 0.1 27 0.70 0. 048 4S 1. 5 92.8 137 8. 9 21 27 : 4 0. 2292 0. 37 1. 66 0.1 27 0. 84 0.051 4S 9.1 91. 7 158 8. 6 22 29 : 4 0. 2288 0. 38 1. 55 0.1 27 0.76 0. 045 4S 2.5 91. 0 137 9. 2
•
23 5:5 0.2294 0.36 1. 56 0.1 27 0.69 0.11 0 3E 57 . 096.01:
5.9セ@
24 9:6 0.2293 0. 34 1. 97 0.1 29 1. 22 0.012 1S 9. 1 10. 6 60 17. 8 N coMeas ured Tes t DEFL ECTION Break i ng Mirror BREAK ORI GIN
Test Dat e Thi ck ness Ra t e Ce ntre Edge Press ure Rad ius Coo rdi nat es Angl e St ress
No. 1982 (i n. ) ps i /sec ( in . ) (i n. ) (ps i ) (i n. ) Type X in . Y in . Degree c. p ( ks i )
1 20: 1 0. 2288 3.5 0. 72* - 0.66 0. 064 1S 3. 5 1. 0 46 7.7 2 21: 1 0.2288 3. 6 0. 95*
-
0. 88 0.1 00 2E 60. 0 5.0 Edge 6. 2 3 29: 1 0. 2312 4. 7 1 . 18* 0.213 1. 28 0. 022 1S 10. 6 24. 6 66 13. 1 4 4:2 0. 2318 5.7 1.03* 0. 175 1.1 2 0. 015 4S 9. 6 88 .4 159 15. 9 5 10: 2 0. 2284 4. 8 0. 93* 0. 16 7 0. 81 0. 049 3S 58. 4 94.5 52 8. 8 6 17:2 0. 2295 6. 2 0. 8* 0. 08 0. 70 0.11 2 1S 2.1 5. 1 39 5. 8 7 24: 2 0. 2291 7. 8 0.98* 0 .1 83 0. 98 0. 032 4S 15. 1 76 . 9 44 10. 9 8 11 :3 0. 2289 2.7 1. 47 0 .1 06 0. 80 0.035 2S 54 . 9 0. 2 130 10.4 9 t 12:3 0. 230 1 2.6 1. 46 0. 127 0.78 0.033 l S 10. 6 12. 8 40 10.7 I 10 25 . 3 0. 2293 4. 0 1. 61 0. 169 0. 70 0 . 028 4S 1. 5 93 . 5 135 11. 7 II
* Inac urate Defl ecti on Heasurer.1ents (f or deta il s see page 8) N
セ@
I.Dセ@
セ@
(
l'lea-sured To;;$ 1 ; - - - セBセ オZlect セ i o nM _are a.ki o_g_ Mirror BREAK OR IGIN
Test Date Thi ckne ss Rate Centre Edge Pressure Radius · Cooro ina:tes セ ョァQMN@ セエMセ@
No. 1982 (in . ) ps i /sec (in.) (in . ) (psi ) (in. ) Type X i n. Y in. Degree op{ksi )
11 31: 3 0. 2281 4.7 1.62 0.148 0.84 0.057 1E 0 2.0 Edge 8.2 12 8: 4 0.2 288 4.3 1.43 0. 064 0. 70 0. 042 4S 1. 5 94 . 5 133 9.5 13 14:4 0.2294 3.6 l. 93 0.1 48 1. 34 0.010 4S 9. 6 89 . 2 158 19.5 14 16:4 0. 2299 3. 0 l. 79 - l. 14 0.021 4S 9. 1 89.4 170 13.5 15 29: 4 0.2288 5. 9 l. 71 0. 127 0.88 0.065 2E 57 . 5 0 Edge 7.6 16 4:5 0.2 293 5.8 1.65 0. 150 0. 87 0.055 2E 58 .0 0 Edge 8. 3 17 7:5 0.2285 5.0 1.56 0.133 . 0.75 0.025 1S 2. 5 6.0 40 12.3 I 18 11: 5 0.2292 3. 7 1. 87 0.133 1. 22 0.018 4S 10 . 1 88.9 157 14. 5 19 28:5 0.2293 3. 2 1.42 0.142 0.81 0. 022 4S 2. 2 95 . 5 126 13 . 1 w 0
セ@
セ@
セ@ Loading Rate (psi/s ) 0.0036 0. 36 0. 36 0. 36 0.36 3.6 3.6 3. 6
*
TABLE C. 7Different Break Origin s・ ャ・」エセ、@ Using The 11
Alternate 1•1ethod11
Br eak Origin
Tes t No. Type X in Y in Angle Stre ss op
( Ks i) 14 4S 2.5 1. 8 128 12.3 6 4S 1.1 2. 8 130 11.7 17 l S 13.6 18. 1 7c. 8. 4 16 l S 0.5 1. 2 40 9.2 24 4S 5.6 7.1 124 18. 6 2 4S 6. 1 11.6 90 10.6 6 4S 4. 6 0. 2 122 6.7 8 4S 9. 1 9.1 135 11.1 - - - - -セM - - - -- -w 1-'
32
TABLE C8
Mean and Standar d Deviation Breaking Pressure
Breaking Pressure (psi)
Rate of Typ e of No . of Standard
Loading Breaking Dat a Mean Deviation
(psi/s) Points
0 . 00036 Sur face 17 0 . 52 O.ll
Edge 4 0 . 38 0.08 All 21 0 . 50 0 . 12 0 . 0036 Surf ace 14 0 . 62 0 . 14 Edge 7 0 . 58 0 . 16 All 21 0 . 61 0.15 0 . 036 Surf ace 16 0 . 82 0 . 13 Edge 6 0 . 72 0 . 14 All 22 0 .80 0.14 0.36 Surface 19 0 . 89 0 .19 Edge 5 0 . 78 0 . 17 All 24 0 . 87 0.19 3 . 6 Sur face 15
o.
92 0 . 24 Edge 4 0 . 87 0.02 All 19 0 . 91 0 . 21Ra t e of Loadi ng : 0 . 00036 ps i /sec.
Tes t Total Numbe r Location Mirror Radi us Stress
No . of Break Or igins セ@ X (in . ) Y ( in . ) Angle 10-3 in . (ksi)
1 1 lS 3 . 1 4.2 40 163 4.8 2 2 4S 4 . 0 95 .6 125 64 7 . 7 4S 0 . 2 92. 5 135 47 9 . 0 3 1 1S 2 . 8 3.0 45 102 6 .1 4 2 4S 2. 6 95.5 114 100 6 . 2 4E 0 92. 7 Edge 18 14.5 5 2 4S 1.6 92.4 130 132 5 . 4 4E 3 . 6 96 . 0 Edge 32 10 . 9 6 2 2E 60 . 0 2 . 0 Edge 170 4 . 7 2E 55 . 0 0 Edge 121 5 . 6 7 1 Cen t re 30 48 0 388 3.1 8 1 1S 2 . 6 4.1 42 168 4 . 8 9 2 1E 3 . 2 0 Edge 38 10 . 0 1E 0 2 . 9 Edge 30 11.3 10 1 1S 8 . 6 16 . 1 90 141 5 . 2 11 1 1S 9 . 1 10.6 56 46 9.1 12 1 4S 5.6 92.4 141 43 9 . 4 13 1 4S 1.5 94.5 130 75 7 .1 14 1 4E 2 . 0 96 . 0 Edge 96 5 . 3 15 1 1E 0 2.0 Edge 82 5 . 9 16 1 2S 35 .6 41.6 0 160 4 . 8 17 1 4S 8 . 6 85 . 7 127 100 6 . 2 18 1 2S 48.9 18 . 1 90 18 7 4 . 5 19 1 4S 1.5 93.0 140 95 6.3 20 2 2S 55.0 0 . 2 125 68 7.5 2S 59 . 8 3.5 140 25 12 . 3 21 1 4S 7. 6 86.2 126 90 6 . 5
•
• MM セセセセセセ]]MMMMセMM MM MMMMセMMMMMMMMセセMMMMMMMM MM MM MMセ M セMMMMセセMMMMMMMM MMMTABLE ClO
POSSIBLE FRACTURE ORI GI NS
Ra te of Loading: 0 . 0036 psi / sec.
Tes t No . 1 2 3 4 5 6 7 8 9 10 11 12 13 14 15 16 17 18 19 20 21 Total Number of Break Origins 1 1 2 1 2 1 1 1 1 1 1 1 1 3 1 1 1 2 1 1 1 Location セ@ X (in.) Y (in . ) l E 0 3 . 1 lS 1.63 6 . 6 4E 3 . 0 96.0 4E 0 93 . 0 2E 58.0 0 4E 5.1 96.0 4E 0 91.9 2E 55.5 0 lS 9 . 6 7 . 6 3S 55 . 2 95 . 8 4E 0 92. 9 4S 9 . 6 84 . 4 lS 2. 8 1.8 4E 5 . 0 96. 0 3S 56 . 2 95 . 8 4S 2 . 5 94.2 4E 0 92. 0 lS 7.6 5 . 1 4S 1.5 94. 8 lS 2 .8 4 . 2 3S 57. 2 95.5 4S 2 . 0 91.0 4S 4 . 0 95. 8 4S 1. 5 89 . 5 4S 9 . 1 84 . 9 4S 7. 6 82. 4 Angle Edge 47 Edge Edge Edge Edge Edge Edge 35 52 Edge 50 Edge 51 128 Edge 35 128 45 55 140 126 135 124 105 Mirror Radius 10- 3 in . 80 69 64 45 88 69 44 50 78 70 59 llO 100 34 25 15 26 87 85 25 225 45 72 82 55
..
34 Stress (ksi) 6 . 9 7. 4 7 .7 9.2 6 . 6 7. 4 9 . 3 8. 7 7 .0 7. 4 8 . 0 5.9 6 . 2 10 . 6 12 . 3 15 .9 12 .1 6 . 6 6 . 7 12 . 3 4 . 1 9 . 2 7 . 3 6 . 8 8. 3•
•Rate of Loading: 0 . 036 osi / sec.
Test Tot al セオュ「・ イ@ Location Mirror Radius Stress
No . of Break Origins セ@ X (in. ) Y (in. ) Angle 1o- 3 in . (ksi)
1 1 2S 55.9 2.1 140 62 7.8 2 1 4S 1.6 95.8 125 15 15.9 3 2 45 8.1 83.4 108 32 10.9 15 5.7 7. 8 37 27 11.9 4 3 1E l. S 0 Edge 100 6 . 2 1E 0 2.0 Edge 18 14.5 45 10.6 88.4 141 16 15.4 5 2 4S 5.1 88.9 125 23 12 . 9 1S 9.9 6. 1 34 11 18 . 6 6 1 1E 0 2. 2 Edge 56 8.2 7 2 1S 11.6 18.6 90 29 11.5 2S 53.9 8.8 128 10 19.5 8 2 4S 4. 8 95 . 5 135 82 6. 8 2S 46.4 10.4 135 20 13 . 8 9 l 4E 0 93. 0 Edge 87 6. 6 10 1 45 7.8 80.4 90 38 10.0 l l l 15 2.1 6.6 45 88 6.6 12 2 4E 0 94 . 0 Edge 127 5.4 4E 2. 0 96 . 0 Edge 76 7.1 13 1 3E S8 .•
....
:;o.o Edge 91 6. 5 14 1 1S 9. 6 13.1 62 43 9 . 4 / 15 2 4S 1.1 91.4 135 115 5 . 7 lS 9 . 8 12 . 6 55 28 11.7 16 1 2E 58.0 0 Edge 84 6.7 17 2 1S 9.1 12 . 1 32 51 8.6 4S 9.3 87.7 126 23 12.8 18 1 lS 2. 8 2.0 48 67 7 . 5 1'3 3 3S 58.8 94.5 45 26 12 . 1 4S 4.8 91.4 130 6 25 . 2 2S 49.2 8.8 138 5 27 . 6 20 2 15 8. 9 9.6 so 8 21 . 8 35 58 . 2 91.4 45 30 11.3 21 2 25 54.4 6.6 134 22 13 . 1 35 48·.9 87 .9 45 10 19 . 5 22 1 15 2. 5 8.2 50 80 6. 9./
-TABLE Cl2
POSSIBLE FRACTURE ORIGINS 36
Rate of Loading: 0.36 psi/sec.
Test Total Number Location Mirror Radius Stress
No. of Break Origins セ@ X (in.) Y ( in.) Angle 10-3 in. (ksi)
1 1 1S 7.8 7.4 60 7 23.3 2 1 4S 5 . 6 95.5 125 67 7.5 3 1 4S 9 . 6 88.4 154 14 16 . 5 4 1 lS 10.3 8 . 6 30 31 11.1 5 2 2E 58. 25• 0 Edge 125 5.5 2E 60.0 1. 75 Edge 6 2 4S 1.1 93.2 130 28 11.7 1S 15.6 15.6 35 47 9.0 7 2 4E 5.1 96.0 Edge 106 6.0 4E 0 91.9 Edge 70 7. 4 . 8 2 2S 57.9 1.6 135 4S 1.2 91.4 138 16 15 . 4 9 1 lS 14.6 17.1 43 128 9 . 4 10 3 4S 9.1 89.2 150 35 10.4 lS 9.8 9.1 42 19 14 . 1 2S 50.2 18.6 120 30 11.3 11 2 4S 8.1 84.2 108 28 11.7 lS 8.1 9.8 45 13 17.1 l2 1 lS 8 .1 9.6 4 7 13 17.1 13 2 lS 8 . 8 7.1 30 50 8 . 7 4S 7 .1 85 . 4 132 30 11 .3 14 1 4E 0 9J.O Edge 27 11.9 15 2 4S 9.8 90. 9 155 74 7. 2 lS 5 .6 9 . 6 60 14 16 . 5 16 2 lS 13 . 6 18.1 72 54 8.4 3S 54.4 95.5 50 82 6 . 8 17 2 3S 58 . 5 セQNU@ 45 44 9. 3 lS 0 .5 4 . 2 40 45 9 . 2 18 2 lS 9.6 4 . 6 15 60 8 . 0 4S 9.1 87.9 145 30 11.3 19 1 lE 0 3.5 Edge 48 8 . 9
Rate of Loading: 0.36 psi/sec .
Test Total Number Location Mirror Radius Stress
No . of Br eak Origins IYE.§_ X (in. ) Y (in . ) Angle lo- 3 in . (ksi)
20 2 4S 1.5 92 . 8 137 48 8 . 9 lS 10 . 1 14.6 63 28 11.7 21 1 4S 9. 1 91. 7 158 51 8 . 6 22 2 4S 2 . 5 91. 0 137 45 9 . 2 lS 9 . 8 11.1 20 23 12 . 9 23 1 3E 57 . 0 96 . 0 Edge 110 5.9 24 2 4S 5. 6 88.9 124 11 18.6 lS 9. 1 10.6 60 12 17 . 8
•
•TABLE Cl3
38
POSSIBLE FRACTURE ORI GINS
Rat e of Loading: 3.6 psi/sec .
Test Total Number Location Mirror Radius Stress
No. of Break Or igins セ@ X (in.) Y (in.) Angle lo-3 in. (ksi)
1 1 lS 3. 5 1.0 46 64 7.7 2 3 4S 6.1 84.4 90 34 10 . 6 2E 60 . 0 5.0 Edge 100 6.2 lS 6.4 9.1 107 8 21.8 3 5 lS 10 . 6 24.6 66 22 13 . 1 4S 0.5 91.4 140 3S 50.4 87 . 4 125 2S 50.4 9.1 133 5 27 . 6 2S 52 . 9 7 . 6 128 4 30 . 8 4 2 4S 9.6 88 . 4 159 15 15.9 3S 59.8 93 . 4 36 5 1 3S 58 . 4 94.5 . 52 49 8.8 6 2 4S 4.6 95 . 8 122 84 6. 7 lS 2 . 1 5.1 39 112 5 . 8 7 3 4S 15.1 76 . 9 44 32 10 . 9 4S 10 . 1 90.7 169 22 13.1 lS 7.8 5 . 8 25 14 16 . 5 3 2 4S 9.1 86 . 9 135 31 11.1 2S 54.9 0 . 2 130 35 10 . 4 9 2 lS 10.6 12.8 40 33 10.7 2E 56.0 0 Edge 24 12 . 6 10 1 4S 1.5 93 . 5 135 28 11.7 11 2 lE 0 2. 0 Edge 57 8 . 2 l E 2. 0 0 Edge 33 10.7 12 1 4S 1.5 94.5 133 42 9.5 13 5 4S 9.6 89.2 158 10 19 . 5 4S 6.6 86.9 115 3 35.6 lS 6. 3 9.6 54 3 35 . 6 lS 10 . 1 5.1 40 1 61.7 3S 55.4 89 . 7 35
Rate of Loading: 3 . 6 psi/sec .
Location Test
No .
Total Number
of Break Origins セ@ X (in . ) Y ( in. ) Angle
14 l 4S 9.1 89.4" 170 15 4 2E 57 . 5 0 Edge 4S 10.1 87.4 155 1S 9.1 6. 1 21 3S 55.5 91.5 60 16 1 2E 58 .0 0 Edge 17 2 lS 2. 5 6 . 0 40 3E 55 . 5 96 . 0 Edge 18 2 4S 10 . 1 88.9 157 lS 4.8 4 . 8 45 19 1 4S 2 . 2 95.5 126 Mirror Radius 10- 3 in. 21 65 18 27 14 55 25 18 22 St ress (ks i ) 13 . 5 7 . 6 14.5 11.9 16.5 8.3 12 . 3 14 . 5 13 . 1
•
•-1
40
3 5 7 9 11 13 15 17 19 21
Test No .
FIGURE Cl : Brea king PressurevsTest Number for 0.00036 Loading Rate ( For details, see page 7).
... セ@ (/) c.. "-" <ll
""
:l (/) (/) <ll""
p.. eo セ@ "M .!G (1j <ll""
セ@ . 91 . 80 t . 69\
\
. 45 . 35 セ MMMNMMMM セセ セMM MMLMMMセMMセセMM セMM MM セ MMセセMM セ@ 1 3 5 7 9 11 13 15 17 19 21 Tes t No .FIGURE C2 : Break i ng PressurevsTest Number for 0. 0036 Loading Rate (For details , see page 7)
1.01 0.91 0.80
セ@
セ@セ@
0 . 70 0.59 42 1 3 5 7 9 11 13 15 17 19 Test No .FIGURE C3: Breaking Pressure vs Test Number for 0. 036 Loading Rate (For details, see page 7)
1 • 31 ... l. 16 ᄋ セ@ Cll 0. .._, Ill ,.. :l Cll Cll 1 . 01 Ill
,..
!l.o 0.0 t:: ᄋセ@ セ@ Cll Ill ,.. . 87 I'Q . 72 . 57I
vt-セ@
+ 3 5 7 9 11 13 15 17 19 21 23 Test No.FIGURE C4 : Break in g Pressure vs . Tes t Number for 0. 36 Loading Rate ( For details , see page 7 )
---1. 35 1. 21 ...-. .,.; (/) a. ..._,. <l.l セ@ ::l (/) (/) 1.07 <l.l セ@ p.. eo c .,.; セ@ t1l <l.l セ@ .93 iXl . 79 .65 44
+
+\
セ カ@
3 5 7 9 11 13 15 17 Test ilo .FIGURE C5 : Breaking Pressure vs . Test Number for 3. 6 psi / sec Loading Rate
(For deta i 1 s , see page 7)
+-+
++
+
+ ++
+
-;- +++ +...
+
+
+ + 1 I I I I I I I 0. 36 0 . 45 0 . 53 0.62o.
71Breaking Pressure ( psi)
FIGURE C6: Centre Deflection 'vs . Breaking Pressu r e fo r Tests at
U. 00036 psi / sec . Loading Rate
u=or
details , see page 8 )-'E
1
f.' セ@ セ@ セ@ᄋセ@
i
セ@ 46 1.72+
+
+ + + + + 1. 57 iT+
+ 1. 42 ++
-
+ ++ 1. 28 ++
--t 1. 13-+ P N YX[ TM MMMM セL MMセ N MM MMM NM L MMMN ャ MM MMMNM L MMMN L MMMM MNM ャ MMML ャイMMMM セ N MMML L@ 0 . 27 0 . 40 0.53 0.65 0 . 78 0 . 91Breaki ng Pressur e (psi )
FIGURE C7: Centre Deflecti on vs . Breaking Pressure for tests at 0. 0036 psi/sec . Loading Rate
r--C/l QJ ..: u l:l
""
...,. c 0""
セ@ u QJ ,....; セ@ QJ 0 QJ H セ@ c QJ u 1 . 86-+
+
+-
+
1. 74 ++
t+
-
-lo 1.63+
++
+
-
++
+
+
1.51+
-1.40+
1.2e+-
I I 0.49 0 . 59 0.70 0 . 80 0 . 91 1.01Breaking Pressure (psi)
FIGURE CU: Centre Ueflection vs. Breaking Pressure for Tests at 0.036 psi / sec. Loading Rate
(For details, see page 8)
---,... (1)
1
t
セ@ Cl)i
c: 48 2 . 00 -++
-
t 1.88+
-1.77.,...
+ + + :+- i- + 1. 65 - + t' +-
+ + t + 1. 54 . -++-+
...
1.42 i-I I I I I I 0 .57 0 . 72 0 . 8 7 1.01 1.16 1. 31Breaking Pressure (p si)
FIGURE C9: Centre Deflection vs . Breaking Press ure fo r tests at 0.36 psi / sec . Loading Rate
2. 0 1.7 1. 4 Vl QJ セ@ (.) !:: 1. 2 !:: 0
...,
(.) QJ ,.... 4-. 9 QJ Cl <I) 1-< セ@ r:: <I) u .6 + + ++
t- t -+ -+ ++
t-+ + t + + + .65.
9 • 93 1.07 l. 21Breaking Pressure (psi)
FIGURE ClO: Centre Deflection vs . Breaking Pressure for tests at 3. 6 psi / sec . Loading Rate
( For details , ウ・セ@ page8)
+
1. 35
50
APPENDIX D
•r-V1 c. セ@ Q) s.. :::1 V1 V1 Q) s.. 0.. -o OJ ·. ..-c. c. c:x:: 2. 5 133 2.0 N 114 1 o 95 -76 57 38 0.5 19 Pセ セMMMセMMMMMMセMMMMMMMMMセMMMMMMセ]]セセ L]]セMMM ャ ッ@ 0 0.5 1.0 1.5 2.0 2.5 .0 Time, sec.
FIGURE 0. 1: Applied Pressure vs. Time and Centre Deflection vs . Time for 0. 36 Loading Rate showing Vibration. (Test No . 5, Table C.5 ) . ... X V1 Q) ...c: u 1::: •r-セ@ 1::: 0 •r-+> u Q) ..-セ@ Q) 0 Q) s.. +> 1::: OJ w
TABLE D2
Corrected Breaking Pressure Data for Tests With Superimposed Vibrations
Uncorrected
Loading Test No . Test Rate Breaking Correction
Rate Pressure Factor
(psi) 0 . 00036 4 0 . 00034 0 . 68 1.00 0.00036 5 0 . 00035 0 . 49 1.01 0.0036 5 0 . 0036 0 . 44 1.01 0 . 0036 6 0 . 0034 0 . 71 1.01 0 . 036 1 0 . 034 0 . 70 1.02 0.036 2 0 . 033 0 . 84 1.00 0.036 4 0 . 034 0 . 80 1.01 0 . 036 5 0.034 0 . 95 1.01 0.036 6 0 . 031 0 . 75 1.01 0 . 036 7 0 . 035 0 . 92 1. 01 0 . 036 8 0.035 0 . 90 1.01 0.036 19 0 . 035 1.00 1.00 0 . 036 20 0 . 036 0 . 86 1. 00 0 . 036 21 0 . 035 0 . 96 1.00 0 . 36 1 0 . 26 0.80 1.01 0 . 36 2 0 . 26 1.05 1.0 0 . 36 3 0 . 24 1.05 1.00 0 . 36 4 0.24 0.76 1.02
o.
36 5 0 . 36 0 . 74 1.04 - - - - · - - - -- - - セ MMM M ᄋセ@ Corrected Breaking Pressure ( psi) 0 . 68 0 . 49 0.44 0 . 72o.
71 0.84 0 . 81 0 . 96 0 . 76o.
93 0 . 91 1.00 0.86 0 . 96 0 . 81 1.05 1.05o.
77o.
77 .I
<.n NUncorrected
Loading Test No. Test Rate Breaking Correction
Rate Pressure Factor
(psi) 0.36 6 0 . 36 0 . 69 1.01